Taras Slobodyanik / Perfil
- Informações
|
9+ anos
experiência
|
60
produtos
|
226
versão demo
|
|
615
trabalhos
|
0
sinais
|
0
assinantes
|
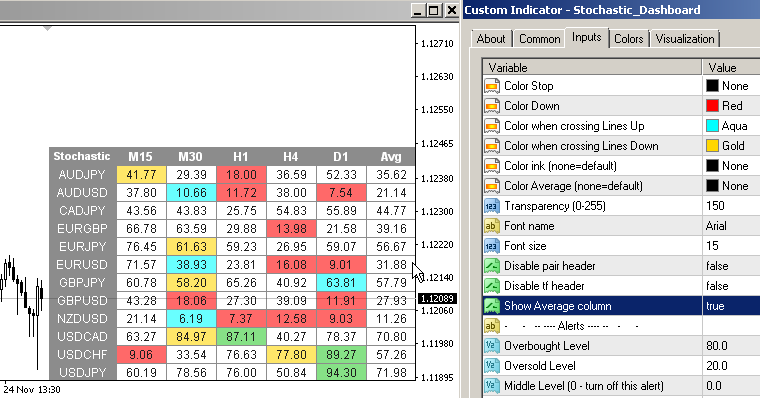
1) Added a column for the average ('Show Average column').
2) Added a parameter for the color of the average column ('Color Average').
------------------------------------------------------------
Dashboard Stochastic Multicurrency (обновление 3.70)
1) Добавлена колонка для среднего значения ('Show Average column').
2) Добавлен параметр для цвета колонки среднего значения ('Color Average').
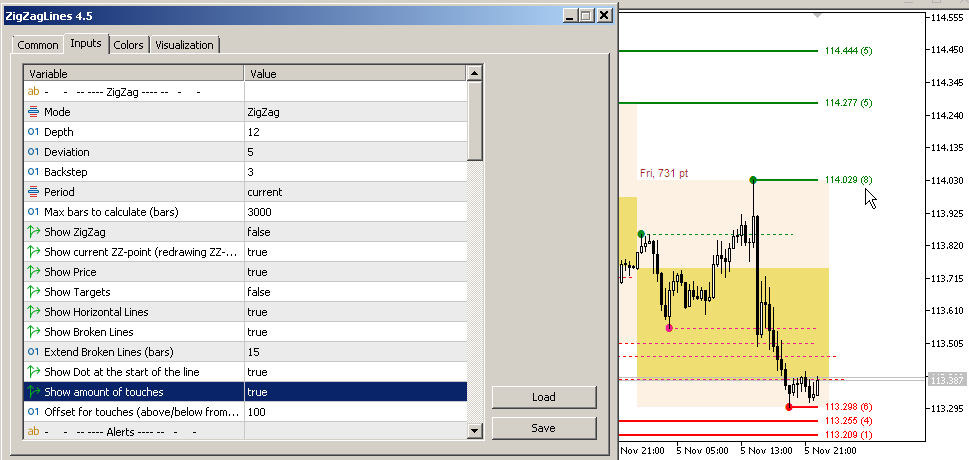
1) Added parameters for displaying the number of times the price touches the ZigZag point. (Show amount of touches, Offset for touches)
------------------------------------------------------------
ZigZag Lines MTF (обновление 4.50)
1) Добавлены параметры для отображения количества касаний ценой точки ЗигЗага. (Show amount of touches, Offset for touches)
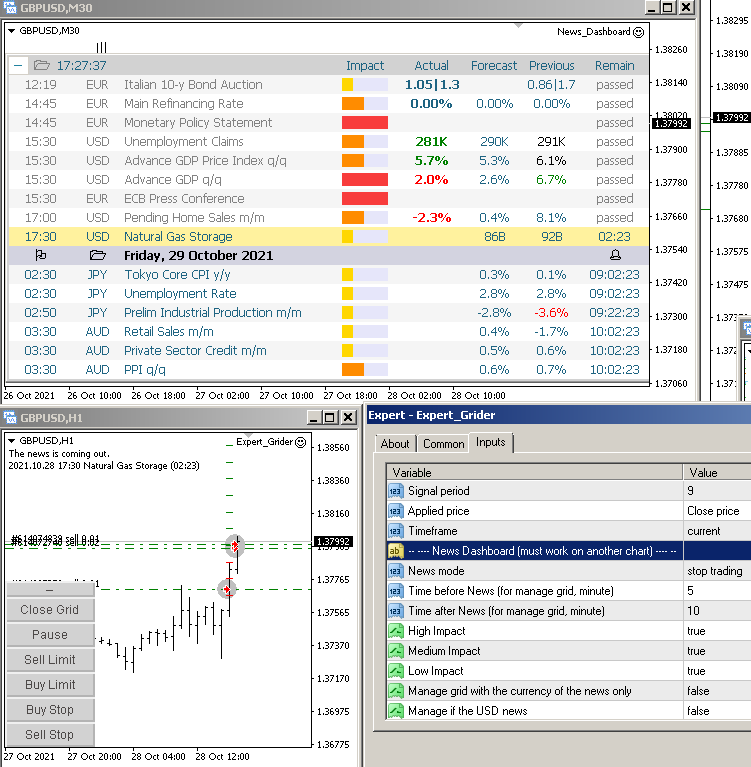
1) Added parameters for using news from "News Dashboard".
2) Separate parameters for opening the next steps (Next Steps).
------------------------------------------------------------
Easy Grider (обновление 4.20)
1) Добавлены параметры для использования новостей из "News Dashboard".
2) Отдельные параметры для открытия последующих шагов (Next Steps).
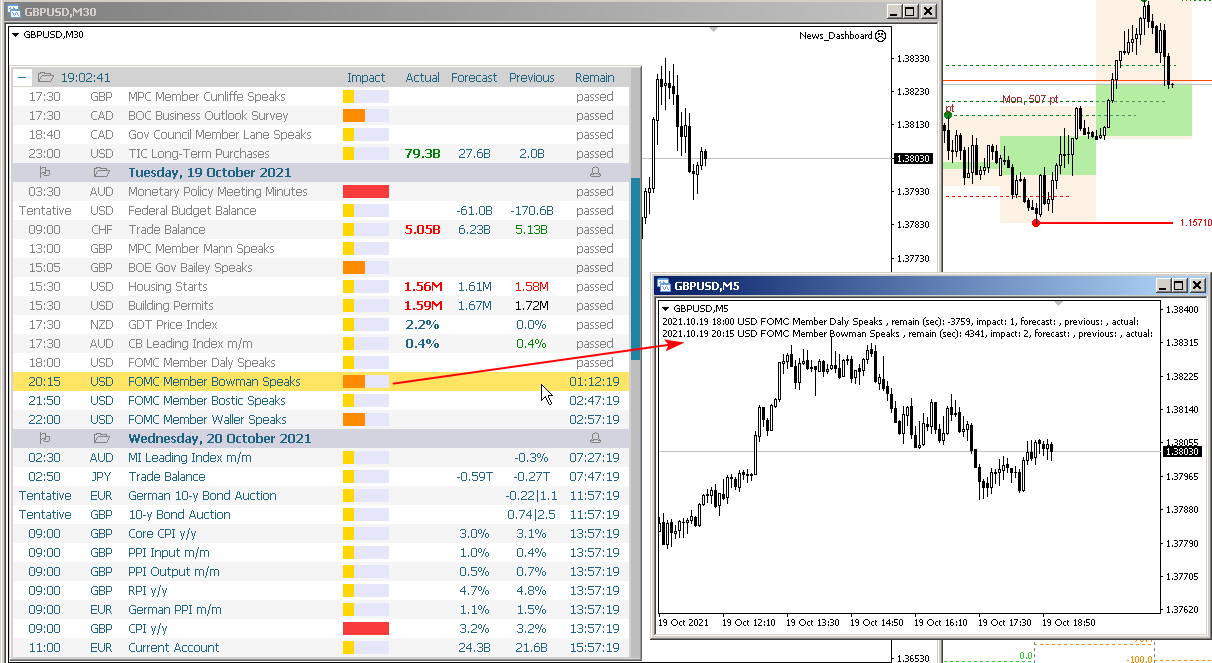
1) Now your EA (or indicator) can take news from the Dashboard. See the description in the comments.
--------------------------------------------------------------------------------------------------------
News Dashboard (обновление 2.90)
1) Теперь ваш ЕА (или индикатор) может брать новости из Дашбоард. Смотри описание в комментариях.
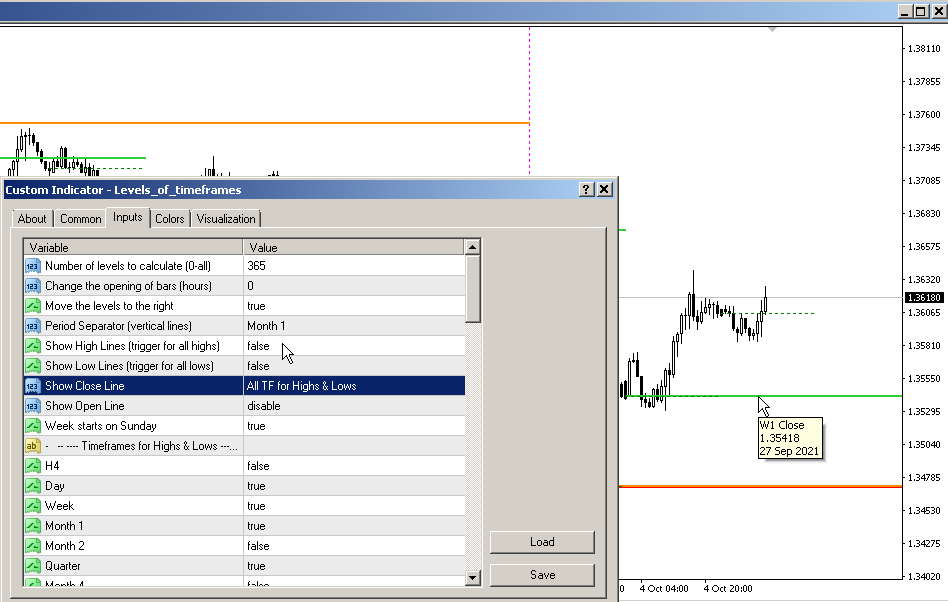
1) Added options to disable drawing of Highs/Lows levels. Now you can only see the Close levels.
2) Added the "All TF for Highs & Lows" option to draw Close/Open levels. You can now see these levels from many timeframes.
3) Added alerts when crossing the Close levels.
4) Fixed a bug with drawing Close levels on the current bar.
------------------------------------------------------------
Levels of Timeframes (2.60-2.70)
1) Добавлены параметры для отключения рисования уровней Хай/Лоу. Теперь вы можете видеть только уровни Закрытия.
2) Для рисования уровней Закрытия/Открытия добавлена опция "All TF for Highs & Lows". Теперь вы можете видеть эти уровни из многих таймфреймов.
3) Добавлены алерты при пересечении уровней Закрытия.
4) Исправлен баг рисования уровней Закрытия на текущем баре.
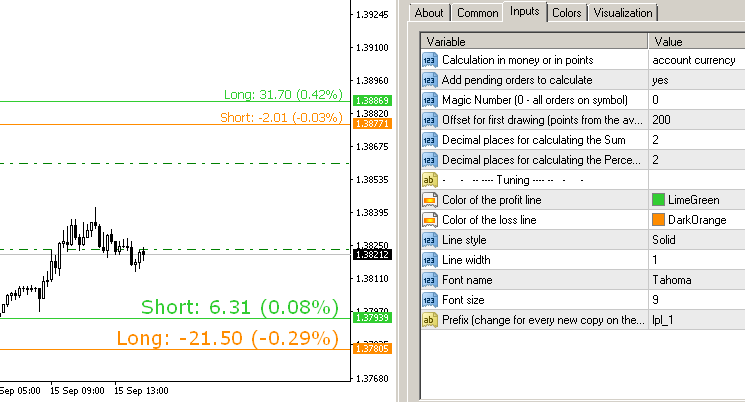
1) Added options for changing the font.
2) Added a prefix for the ability to run multiple copies on one chart.
3) Added line width.
------------------------------------------------------------
Lines Profit Loss (обновление 3.00)
1) Добавлены параметры для изменения шрифта.
2) Добавлен префикс для возможности запускать несколько копий на одном чарте.
3) Добавлена толщина линии.
O indicador ADX é usado para determinar a tendência e sua força. A direção do preço é mostrada pelos valores +DI e -DI, e o valor ADX mostra a força da tendência. Se +DI estiver acima de -DI, então o mercado está em tendência de alta, se ao contrário, está em tendência de baixa. Se o ADX estiver abaixo de 20, não há uma direção definida. Assim que o indicador ultrapassa este nível, começa uma tendência de força média. Valores acima de 40 indicam uma tendência forte (tendência de baixa ou
O indicador ADX é usado para determinar a tendência e sua força. A direção do preço é mostrada pelos valores +DI e -DI, e o valor ADX mostra a força da tendência. Se +DI estiver acima de -DI, então o mercado está em tendência de alta, se ao contrário, está em tendência de baixa. Se o ADX estiver abaixo de 20, não há uma direção definida. Assim que o indicador ultrapassa este nível, começa uma tendência de força média. Valores acima de 40 indicam uma tendência forte (tendência de baixa ou
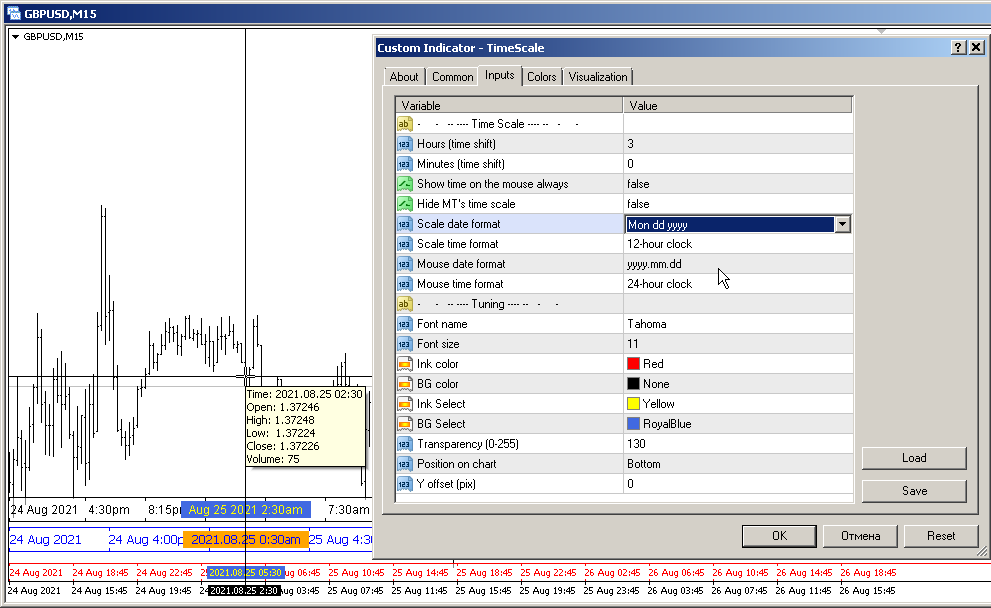
1) Added parameters to control the date and time format (on the scale and on the mouse).
2) Fixed a bug when loading an indicator from a template.
------------------------------------------------------------
Time Scale (обновление 1.50)
1) Добавлены параметры для управления форматом даты и времени (на шкале и на мышке).
2) Исправлен баг при загрузке индикатора из шаблона.
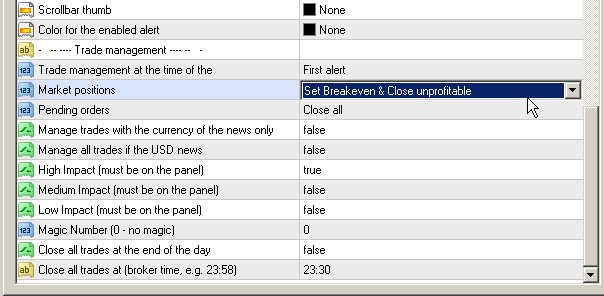
1) Added "Trade management" parameters. Now EA can close positions and orders before news, set breakeven and close trades at the end of the day.
------------------------------------------------------------
News Dashboard (обновление 2.60)
1) Добавлены параметры "Trade management". Теперь ЕА может закрывать позиции и ордера перед новостями, устанавливать безубыток и закрывать трейды в конце дня.
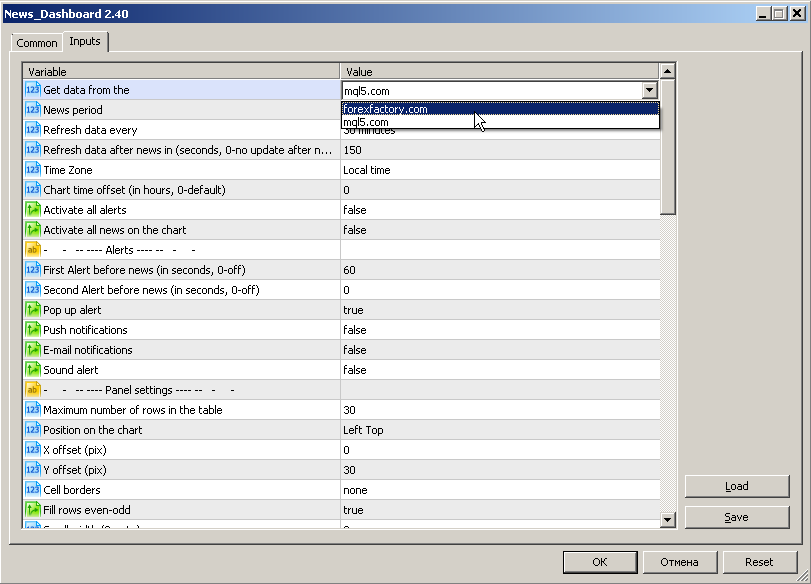
1) Added mql5.com calendar for MT5 version (www.mql5.com/en/economic-calendar).
------------------------------------------------------------
News Dashboard (обновление 2.40)
1) Для версии МТ5 добавлен календарь mql5.com (www.mql5.com/en/economic-calendar).
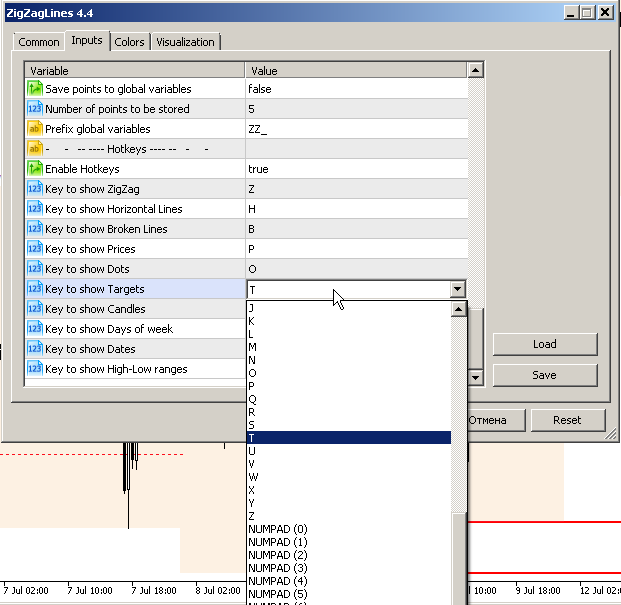
1) Added "Hotkeys" parameters. Now you can switch the display of indicator elements by pressing hot keys.
------------------------------------------------------------
ZigZag Lines MTF (обновление 4.40)
1) Добавлены параметры "Hotkeys". Теперь вы можете переключать отображение элементов индикатора нажатием на горячие клавиши.
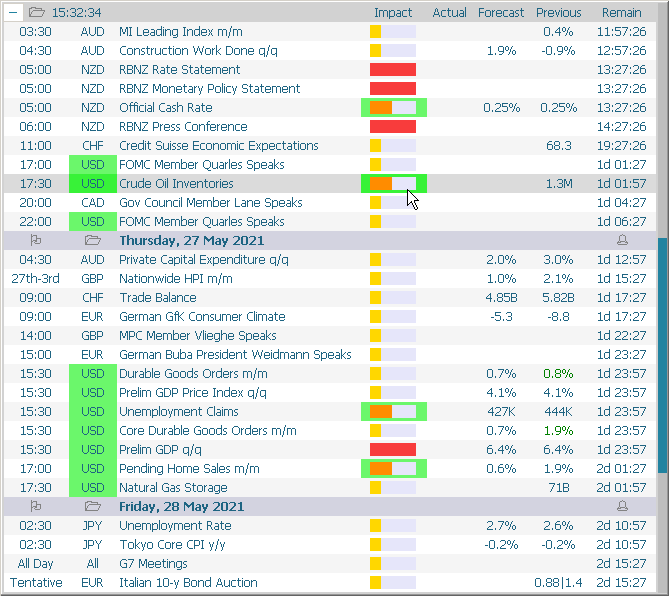
1) Now while holding down the CTRL key, you can select the desired currencies and the impact of news. After releasing the CTRL button, only the selected currencies (and impact) will be displayed.
2) Added a parameter to activate all alerts at once (at start) - "Activate all alerts".
3) Added a parameter to activate all news on the chart (at start) - "Activate all news on the chart".
4) Added parameters for sorting news without using a mouse - "Use static settings (don't use mouse select)".
------------------------------------------------------------
News Dashboard (обновление 2.10)
1) Теперь при зажатой клавише CTRL, вы можете выбрать желаемые валюты и важность новостей. После отжатия кнопки CTRL, только выбранные валюты будут отображены.
2) Добавлен параметр для активации всех алертов сразу (при старте) - "Activate all alerts".
3) Добавлен параметр для активации всех новостей на чарте (при старте) - "Activate all news on the chart".
4) Добавлены параметры для сортировки новостей без использования мышки - "Use static settings (don't use mouse select)".
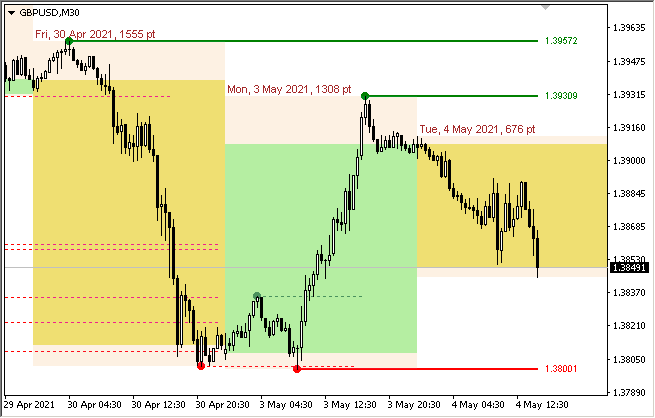
1) For the parameter "Candles" added "Show Day of week", "Show Date" and the ability to specify a color for each day of the week.
------------------------------------------------------------
ZigZag Lines MTF (обновление 4.30)
1) Для параметра "Свечи" добавлены "Show Day of week", "Show Date" и возможность указания цвета для каждого дня недели.
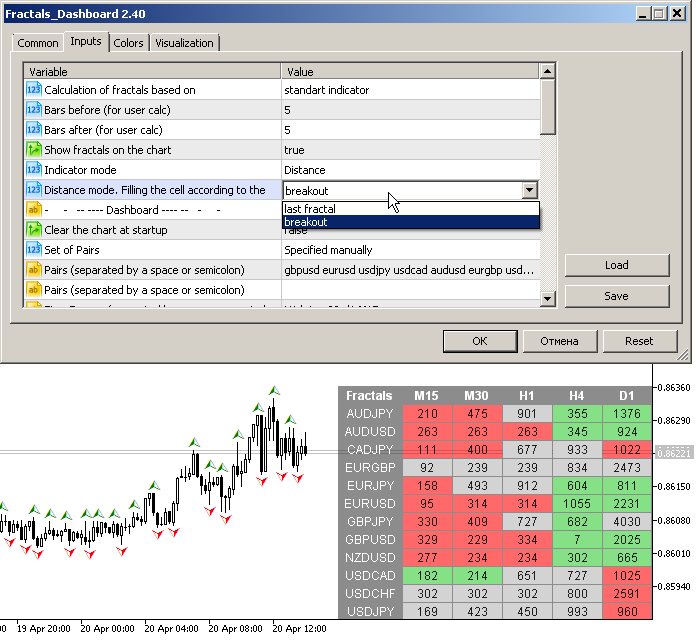
1) For the "Distance mode", the parameter "Filling the cell according to the breakout or the last fractal" has been added.
2) Added parameter "Allow to move the table manually". Now, after double-clicking on the table headers, you can move it with the mouse. The binding to the corner of the chart remained unchanged.
3) Added options to disable the table headers.
4) Now, in the "user bars" calculation mode, fractals can appear in front of the current bar.
------------------------------------------------------------
Fractals Dashboard MT4/MT5
1) Для режима "Расстояние между фракталами", добавлен параметр "Filling the cell according to the breakout or the last fractal".
2) Добавлен параметр "Allow to move the table manually". Теперь после двойного клика на заголовках таблицы вы можете перемещать ее мышкой. Привязка к углу чарта осталась неизменной.
3) Добавлены параметры для отключения шапки таблицы.
4) Теперь, при режиме расчета "user bars", фракталы могут появляться перед текущим баром.
1) Added a clock showing the current time. Click on the clock - go to the current news.
2) Added an icon for collapsing and expanding all days at once.
3) Added highlighting of the current today's news.
4) Correction of minor bugs.
------------------------------------------------------------
News Dashboard (обновление 1.20)
1) Добавлены часы показывающие текущее время. Клик по часам - переход к текущей новости.
2) Добавлена иконка сворачивания и разворачивания всех дней сразу.
3) Добавлена подсветка текущей сегодняшней новости.
4) Исправление мелких багов.
Este painel exibe notícias atuais de três fontes: do site ForexFactory.com (calendário FFC), do site Investing.com e do Calendário Econômico de mql5.com. Você pode classificar as notícias por impacto e por país e exibi-las no gráfico com um clique. Ao manter pressionada a tecla 'Ctrl', você pode selecionar várias 'moedas' ou 'impactos' diferentes para classificar. Além disso, este utilitário mostra não apenas a previsão, mas também os valores reais após aparecerem no site. Você pode definir uma
Este painel exibe notícias atuais de três fontes: do site ForexFactory.com (calendário FFC), do site Investing.com e do Calendário Econômico de mql5.com. Você pode classificar as notícias por impacto e por país e exibi-las no gráfico com um clique. Ao manter pressionada a tecla 'Ctrl', você pode selecionar várias 'moedas' ou 'impactos' diferentes para classificar. Além disso, este utilitário mostra não apenas a previsão, mas também os valores reais após aparecerem no site. Você pode definir uma
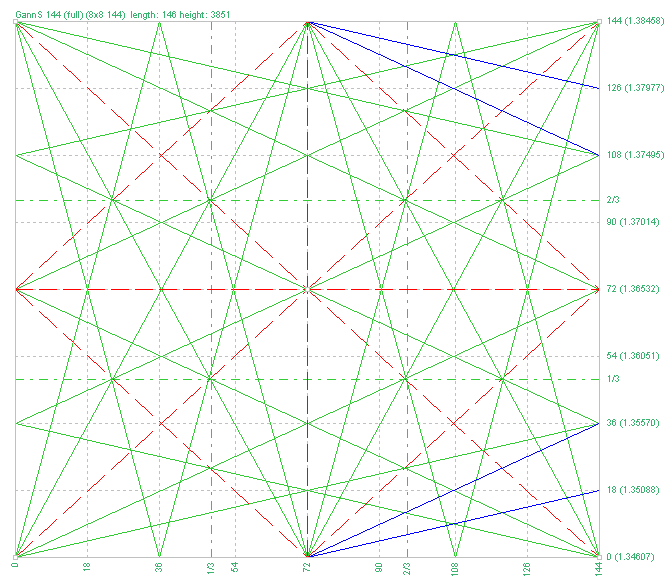
1) Added parameters for additional angles (Additional angles 1/4 & 1/8).
------------------------------------------------------------
Gann Square of 144 (обновление 3.00)
1) Добавлены параметры дополнительных углов (Additional angles 1/4 & 1/8).
Symbol Manager or Grid Manager, designed to group orders into one position (by Symbol or by Magic Number). This utility will be useful to multi-currency traders (many EAs), who can have multiple orders on several pairs. You will be able to see the total number of lots, the total profit, and set virtual stop loss and virtual take profit. To set a real TP (or SL), you must first set the virtual value, and then enter the command in this cell: "set". If you want to set real TP/SL for all


