Suleiman Alhawamdah / Perfil
- Informações
|
6+ anos
experiência
|
2
produtos
|
4
versão demo
|
|
0
trabalhos
|
0
sinais
|
0
assinantes
|
Journalist...a hobbyist in indicator programming "I only know what I need."
Suleiman Alhawamdah
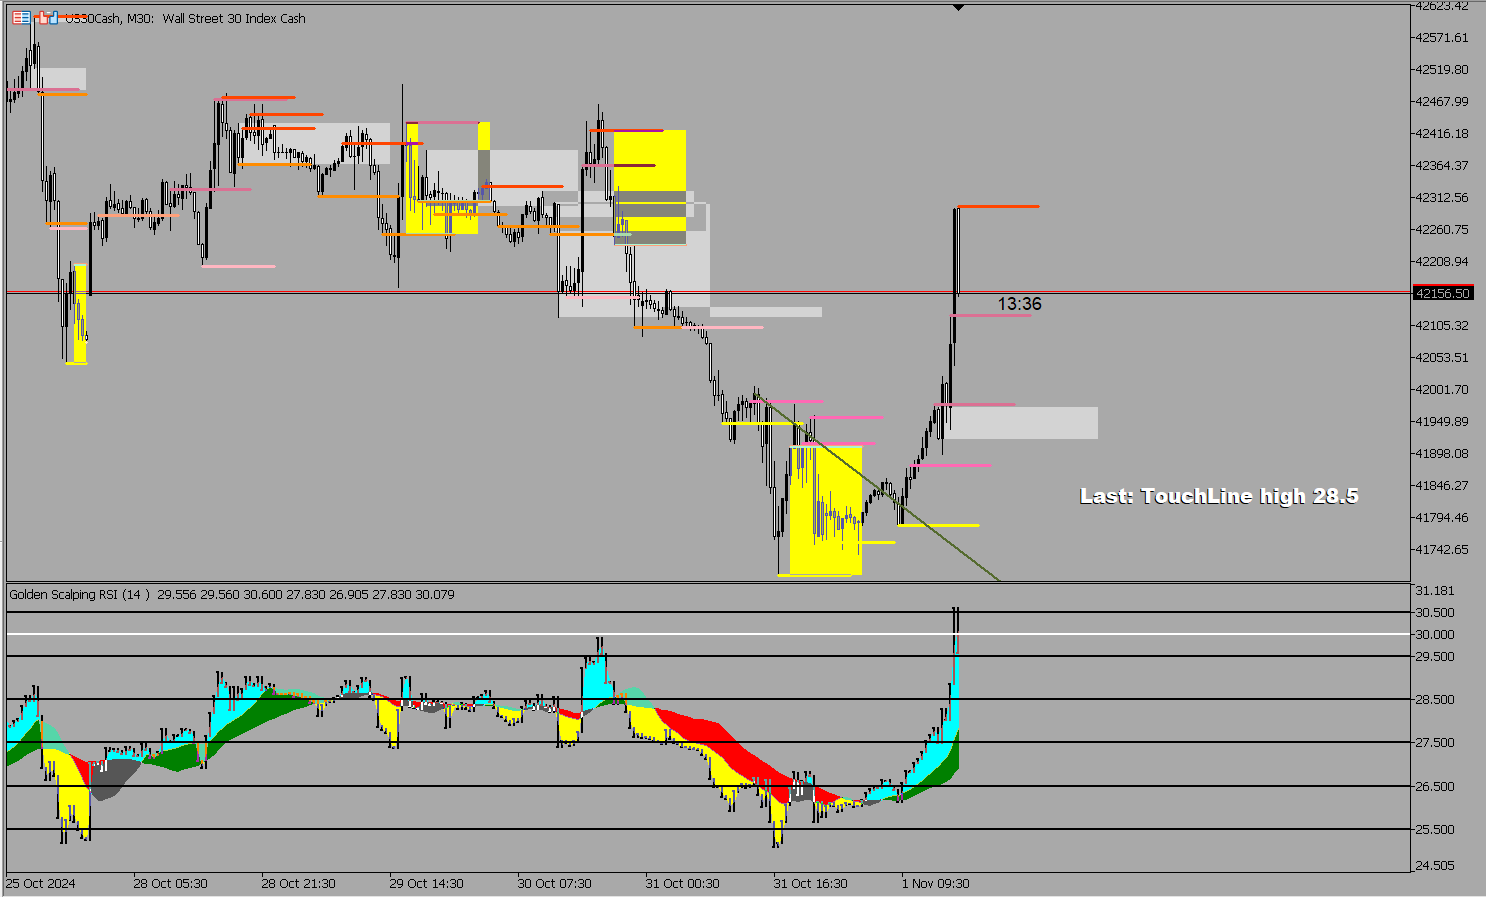
If we take into account the other analyses as well as the trends formed in the analysis, it seems that the yellow rectangles that appear are not to be taken lightly. The level anomalies generally seem to form an area of “potential” transition or a price imbalance area that is "invisible to us as traders," or at the very least, it could serve as a warning that this area might precede a transition or a continuation.
This is an example for the Dow Jones on the 30-minute time frame.
This is an example for the Dow Jones on the 30-minute time frame.
Suleiman Alhawamdah
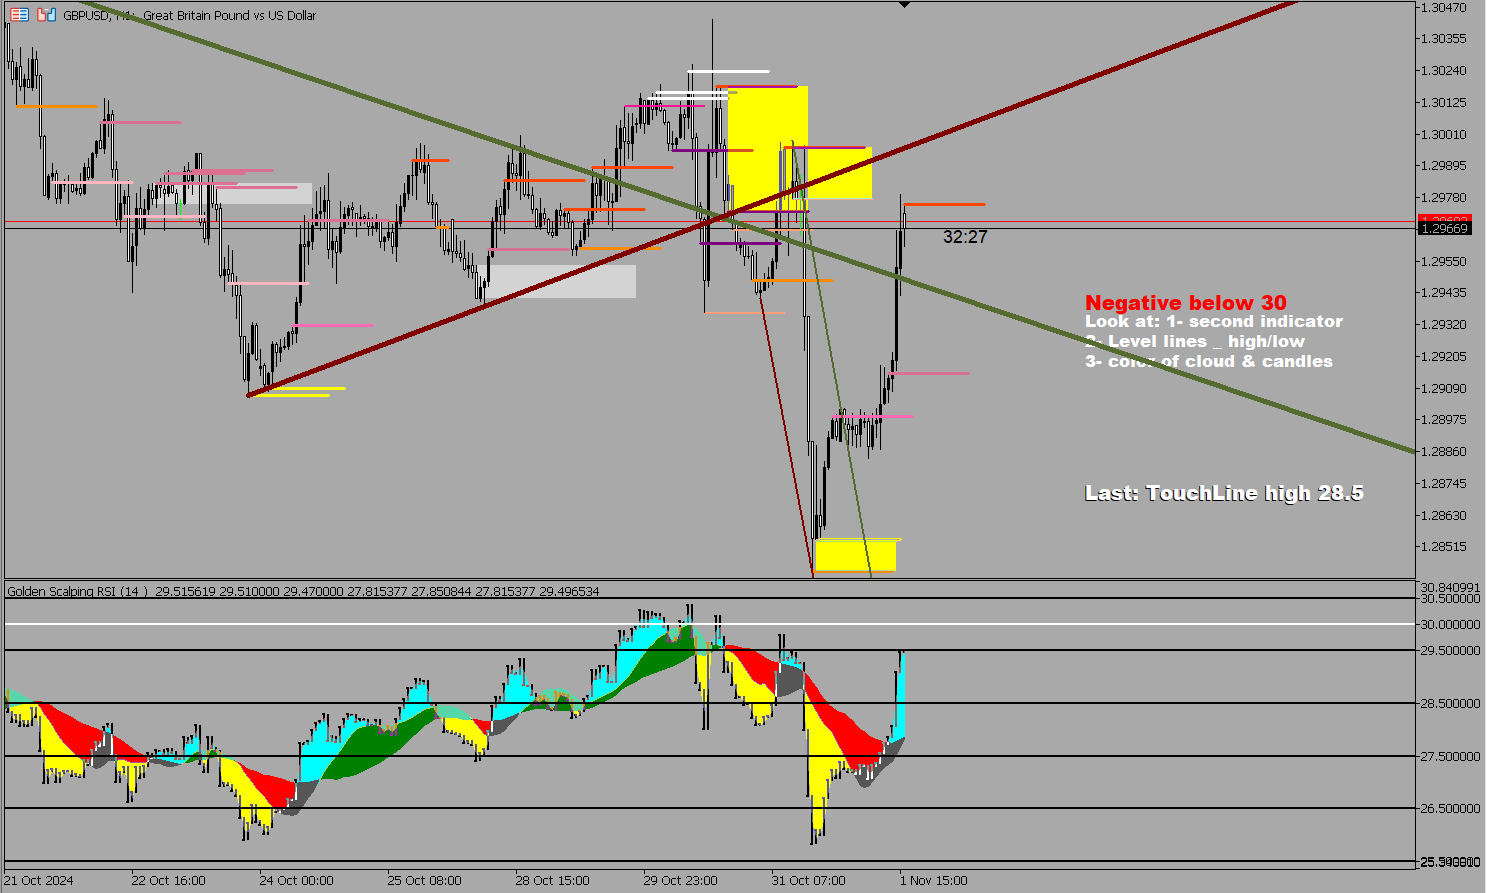
Also, on the 1-H time frame of the GBP/USD, the new indicator and strategy have detected three areas of sudden, rapid anomalies in levels, as shown in the attached image. These three areas appear to contain abrupt, unexpected level irregularities, or, as I described in my personal interpretation, areas of high, sudden, and invisible financial inflow that caused level differences and were subsequently detected by the new indicator.
Suleiman Alhawamdah
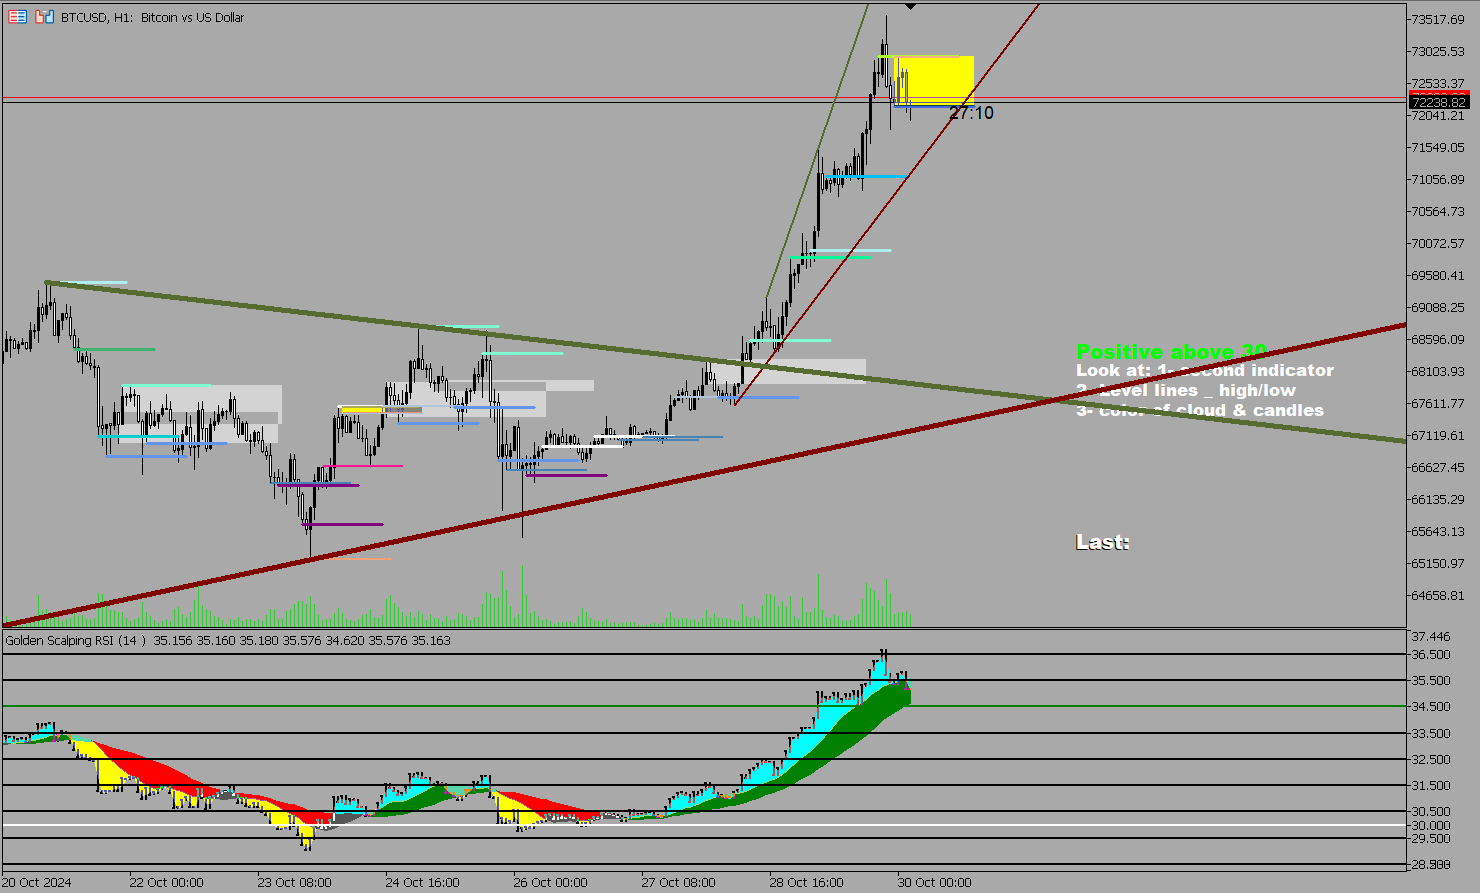
إن شاء الله - Insha'Allah, in the new indicator that I will publish soon, there is a shaded area within a yellow rectangle, which, so far, seems to be an impressive and unique zone. This yellow area only appears in the new indicator based on certain programmed conditions. This area does not seem random; it results from an anomaly in the levels and, according to my personal interpretation, could indicate a high financial inflow—potentially from banks or large traders, etc.—although it remains invisible. Through these levels and the indicator's tracking of this rapid and sudden level variation, as we see in this image of Bitcoin on the 1-hour time frame, the new strategy and indicator detected the anomaly in the yellow box. In the next image, which I will include in the second post, we’ll see how the price dropped from that area until a new anomaly occurred, leading to an upward movement. This, again, according to my personal interpretation, might be due to a high and invisible financial inflow, causing a second rise after the second yellow box, as shown in the second image that I will post. I will also add a third image showing the gold chart on the 1-hour time frame and how the yellow rectangle detected the anomaly zone.
first image of Bitcoin
first image of Bitcoin
Suleiman Alhawamdah

The passion for catching the price from the very beginning has always been exciting and motivating. Personally, I don't think any other indicator was able to detect the Nasdaq price reversal from this area, even for analysts. This is something special, even across different timeframes.
first image on 3-H
first image on 3-H
Suleiman Alhawamdah

US30 - 1 hour The price reached the high level line 31.5 and bounced from it with very high accuracy, the level line was higher than the chart, the deal here is clearer, we have a red cloud, and the decline was
Suleiman Alhawamdah

The price reached the high level of 35.5, bounced off it, and the line formed above the chart price. The silver reversal was detected early and with high accuracy. This is for those asking about these breakout levels.

Suleiman Alhawamdah

Now there is complete control.. A clearer and more comprehensive view of the scene.. Analyzing the chart with one look.. Now we can say that everything has a reason: why up here and why it fell there and why it stopped at this point
1- Revolutionary level lines
2- The cloud
3- Three groups to draw trend lines
1- Revolutionary level lines
2- The cloud
3- Three groups to draw trend lines
Suleiman Alhawamdah


Before discussing the advanced trading strategy I will explain in this article, it is essential to emphasize that the indicator this strategy is based on differs greatly from the traditional RSI indicator we know. It is different in every aspect, including key levels and much more...
Compartilhar nas redes sociais · 3
153
Suleiman Alhawamdah
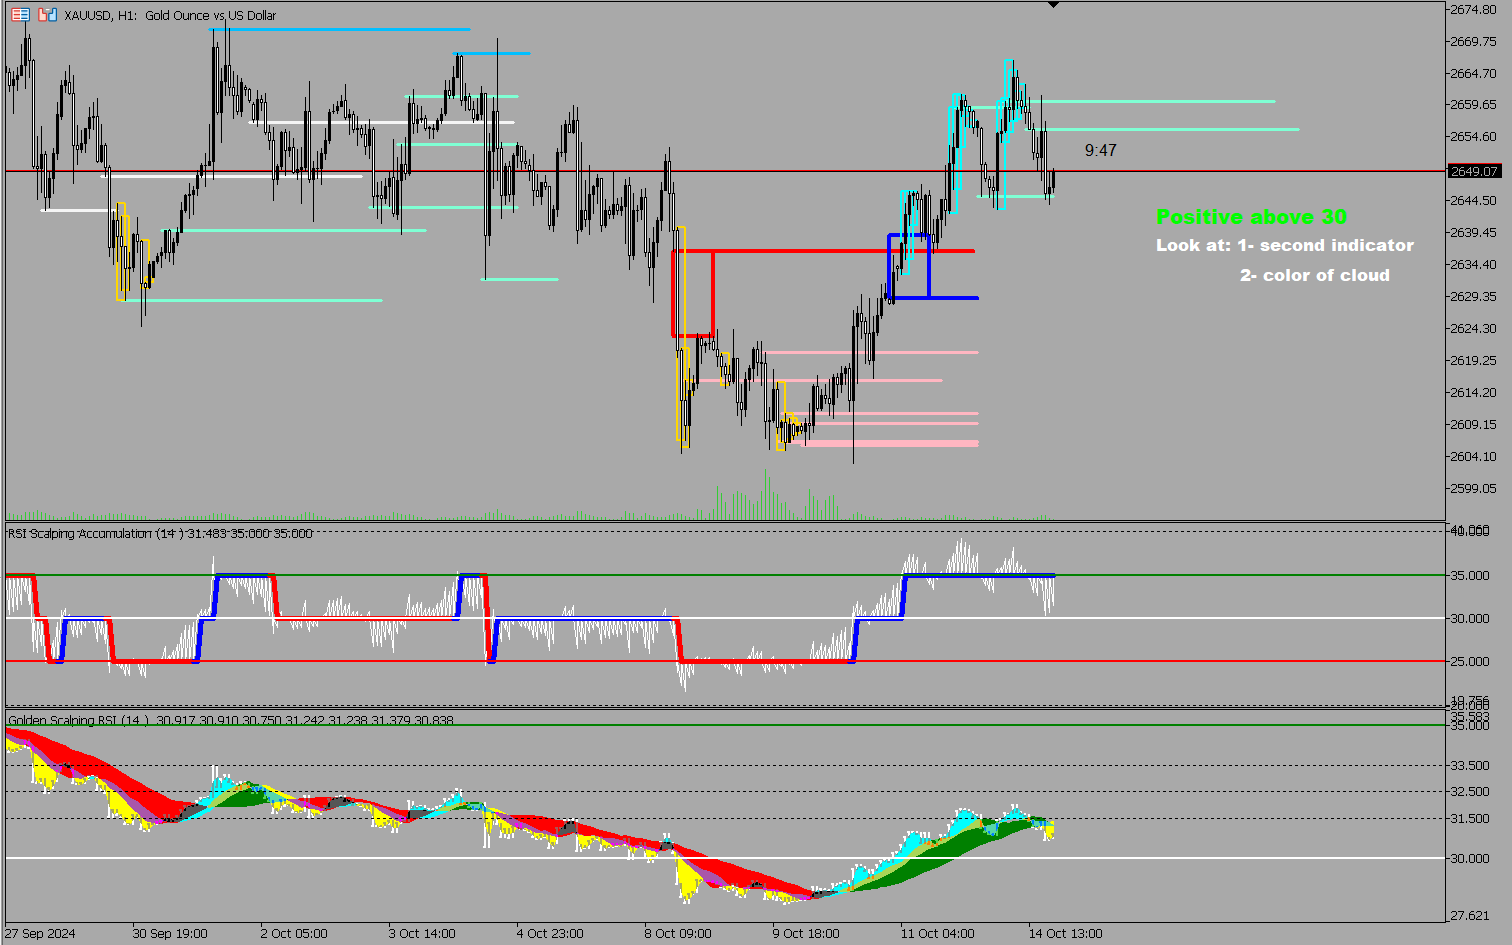
Everything has become easy.
These lines are a true treasure and priceless.
There is a high breakout, a low breakout, and a touch.
They are still under testing. The lines are real and do not repaint.
These lines are a true treasure and priceless.
There is a high breakout, a low breakout, and a touch.
They are still under testing. The lines are real and do not repaint.
Suleiman Alhawamdah
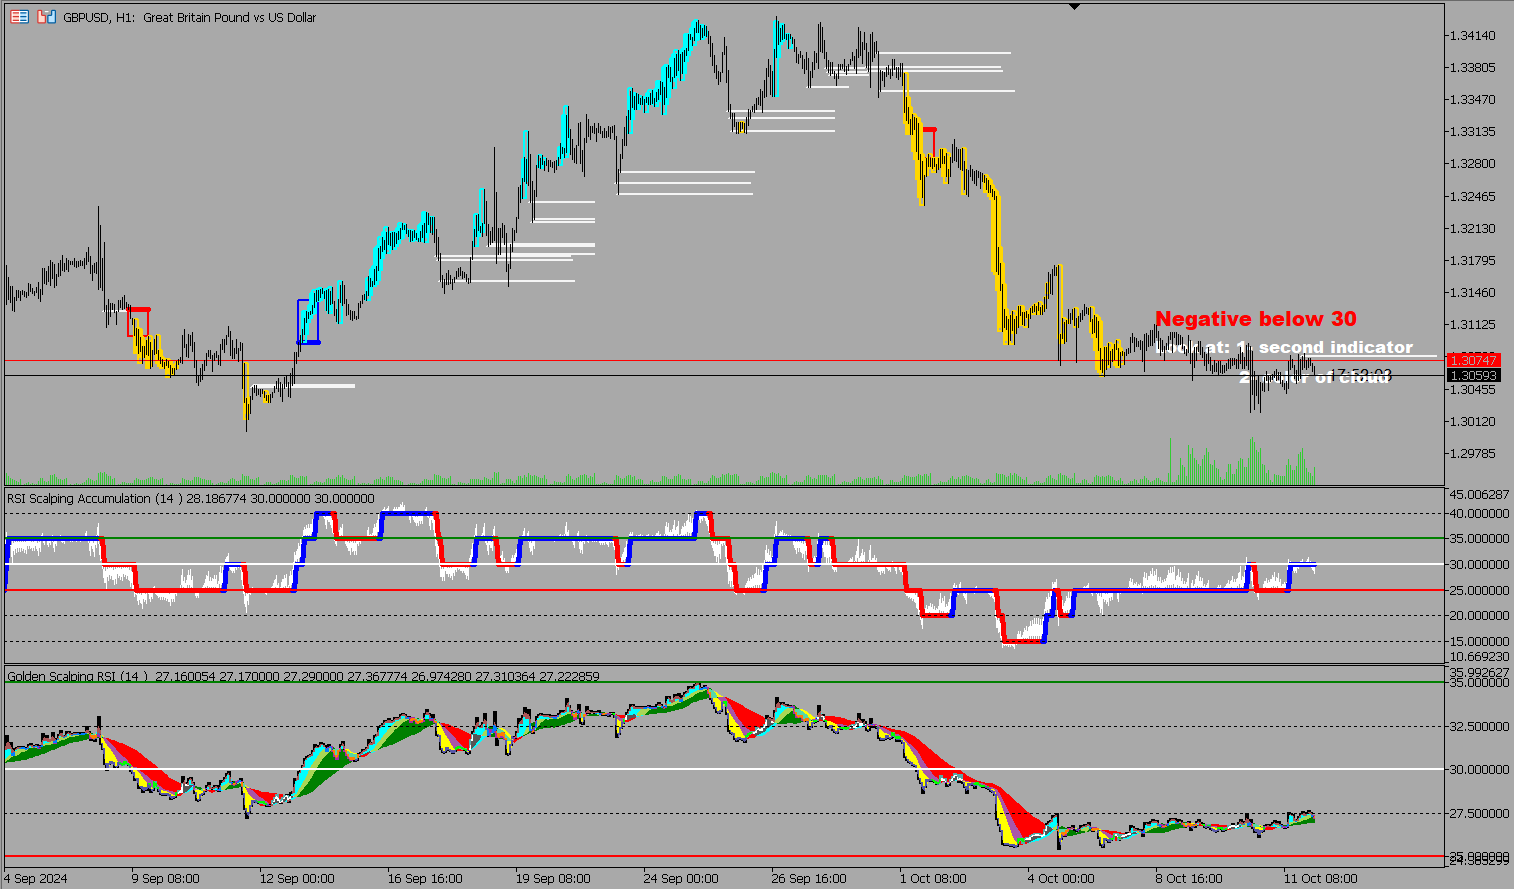
Testing for a possible update next week.
Adding two important new levels.
Adding white lines on the chart indicating the possibility of a trend reversal or a possible pullback for continuation...decision for sell or buy will depend on monitoring the type of cloud formed ("rising or falling") and the type of candles.
Adding two important new levels.
Adding white lines on the chart indicating the possibility of a trend reversal or a possible pullback for continuation...decision for sell or buy will depend on monitoring the type of cloud formed ("rising or falling") and the type of candles.
: