Mirza Baig / Perfil
- Informações
|
10+ anos
experiência
|
0
produtos
|
0
versão demo
|
|
0
trabalhos
|
0
sinais
|
0
assinantes
|
::: You must expect to be stung by bees when in search of honey :::
::: He who is not courageous enough to take risks will accomplish nothing in life :::
::: He who is not courageous enough to take risks will accomplish nothing in life :::
Amigos
302
Pedidos
Enviados
Mirza Baig
compartilhou o código do autor Roberto Jacobs
ZigZag Arrow
ZigZag Arrow indicator is based on a built-in ZigZag indicator that replaces the Line Section with Arrow.
Mirza Baig

Sergey Golubev
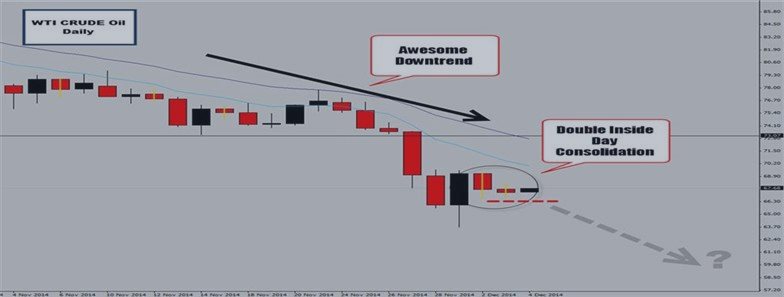

Inside bars are easily identified pricing patterns that can be found on virtually any chart. The pattern itself requires some simple technical analysis, which includes identifying a series of highs and lows on a daily chart...
Mirza Baig

Sergey Golubev
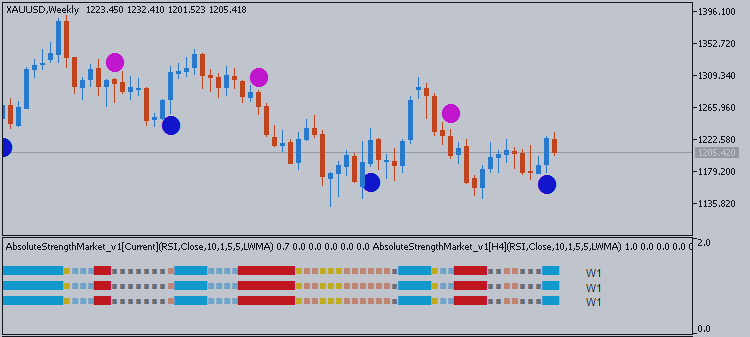

US Dollar - "In the week ahead, there are plenty of indicators and Fed speeches on the docket. Yet, few of them really hit the high-profile level that we would expect to single-handedly benchmark the timing for the first rate hike...
Mirza Baig

Sergey Golubev
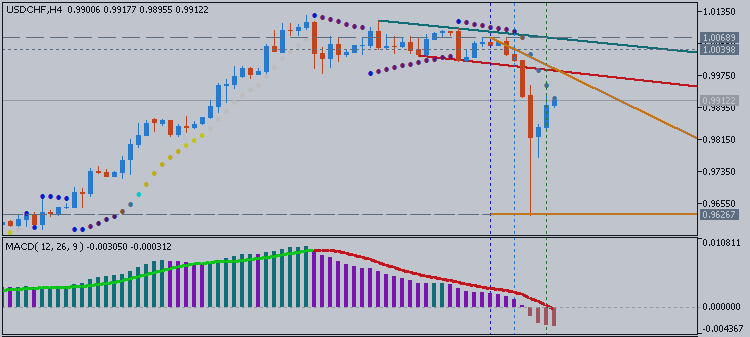

The US Dollar moved sharply lower against the Swiss Franc, issuing the largest decline in two months. A daily close below trend line support at 0.9769 exposes the 23.6% Fibonacci retracement at 0.9695. Alternatively, a move above the 14.6% Fib at 0...
Mirza Baig
compartilhou o código do autor Roberto Jacobs
MonEx indicator
MonEx indicator is the Weighted Close (HLCC/4) candlestick bar combined with ZigZag indicator.
Mirza Baig
compartilhou o código do autor Roberto Jacobs
FiboPivotCandleBar
Este indicador é um conjunto da combinação de diversos indicadores: Fibonacci, Pivot Point, ZigZag, MACD.
Mirza Baig
compartilhou o código do autor Roberto Jacobs
BB_OsMA
O indicador BB_OsMA é o mesmo indicador OsMA sob a forma de esferóides com desvios das bandas superior e inferior.
Mirza Baig

Sergey Golubev
EURUSD Technical Analysis 2015, 22.03 - 29.03: Bearish Ranging with 1.0461 Key Support Level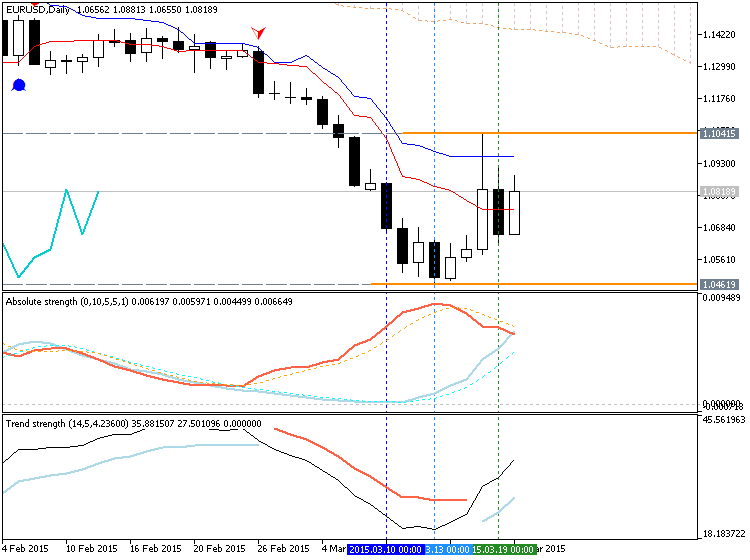
D1 price is on primary bearish market condition with the secondary ranging: The price is located below Ichimoku cloud/kumo and below Sinkou Span A line Chinkou Span line is located too far for any future possible breakdown/breakout Nearest support

Mirza Baig

Sergey Golubev


Strong Dollar Hammers Profits at U.S. Multinationals (WSJ) Richard Fisher, Often Wrong but Seldom Boring, Leaves the Fed (NY Times) Economists agree: deflation is either good, or bad, or irrelevant (FT Alphaville) Why are so few homes for sale in the Bay Area...
2
Mirza Baig
compartilhou o código do autor Roberto Jacobs
ForexLine
ForexLine indicator provide signals for trade, white line (sell signal) and the blue line (buy signal).
Mirza Baig

Sergey Golubev
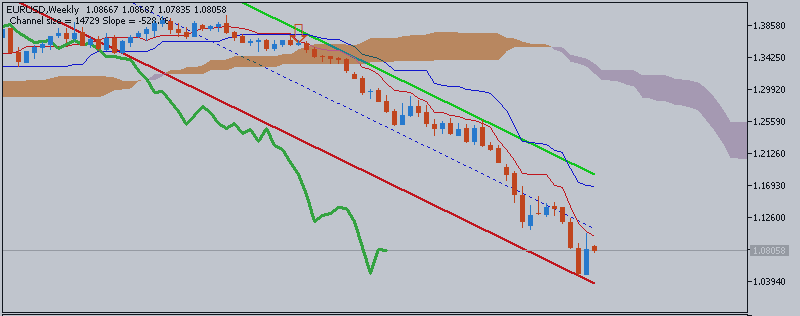

Ichimoku Trading Strategies For Finding Winning Trades by Hubert Senters | Real Traders Webinar A brief look at the terminology, signals and methods for taking trades using Ichimoku Kinko Hyo. ============== Ichimoku threads/posts on mql5.com forum The theory of the signals...
2
Mirza Baig

Matthew Todorovski
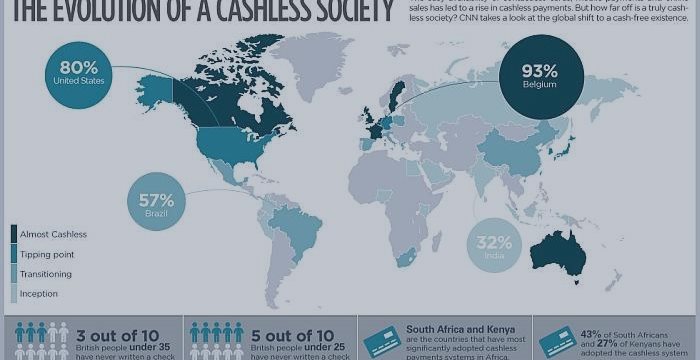

March 24, 2015 Santiago, Chile French paper Le Parisien didn't mince words in the headline: "La chasse au cash est lancee". Basically 'hunting season on cash is launched'...
2
Mirza Baig

Sergey Golubev
EURUSD Technical Analysis 2015, 29.03 - 05.04: Bearish Ranging Within 1.0551 and 1.1051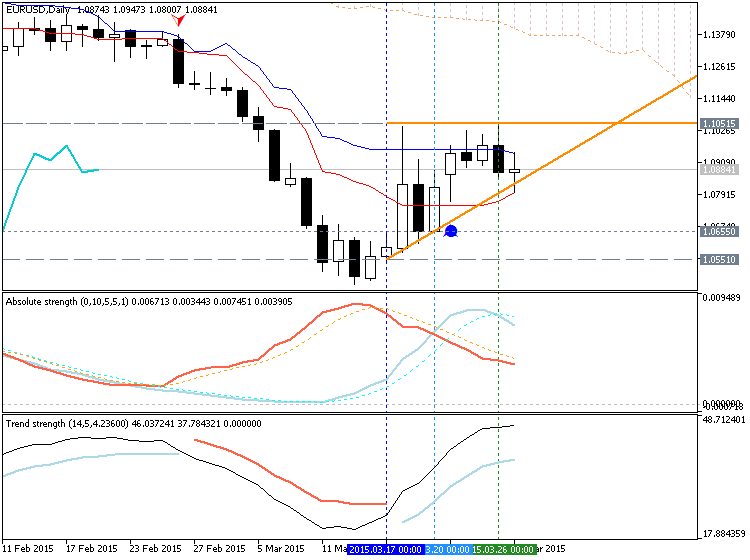
D1 price is on ranging bearish market condition: The price is located below Ichimoku cloud/kumo and far below Sinkou Span A line Chinkou Span line is too far for any possible reversal of the price movement from bearish to the bullish Nearest support

Mirza Baig

Sergey Golubev

US Stock Market Conclusion, or There are three ways to play a bear market.
30 março 2015, 18:11
Since the beginning of January 2014 stocks have shown signs of institutional selling. This can be seen in the small capitalization stocks index the Russell 2000. This group of stocks generally leads the S&P 500. The chart posted below shows some of my analysis of the SP500 index...
2
Mirza Baig

Sergey Golubev


• iPhone Killer: The Secret History of the Apple Watch (Wired) • Renegades of Junk: The Rise and Fall of the Drexel Empire (Bloomberg) • Wall Street Executives from the Financial Crisis of 2008: Where Are They Now...
2
Mirza Baig

Sergey Golubev
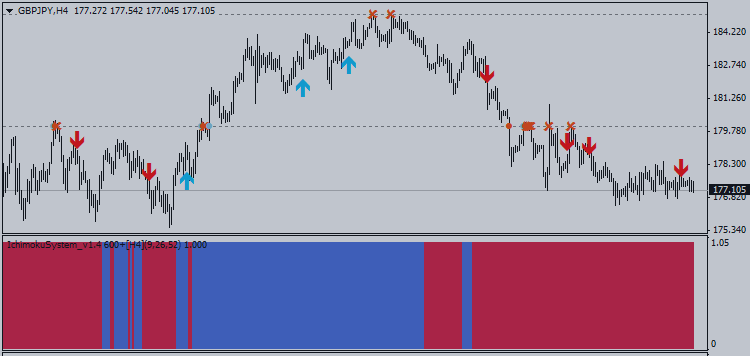

By examining the daily chart of the GBPJPY pair, we easily can notice that the pair has moved aggressively downwards during the previous period after placing a short-term top in the 185.00 regions. The psychological areas of 185.00 intersect with 61.8% Fibonacci of the major decline from 189...
2
Mirza Baig

Sergey Golubev
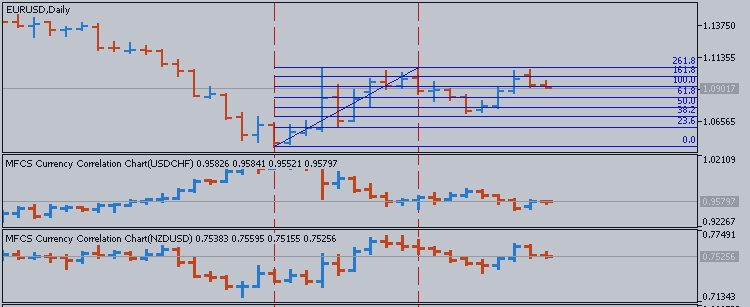

EURUSD correlation with both pairs USDCHF and NZDUSD is very strong. EURUSD holds positive correlation with NZDUSD in an hourly time frame ONLY while it establishes strong negative correlation with USDCHF pair both in an hourly and daily time frame...
2
: