|
7+ anos
experiência
|
8
produtos
|
87
versão demo
|
|
1
trabalhos
|
0
sinais
|
0
assinantes
|
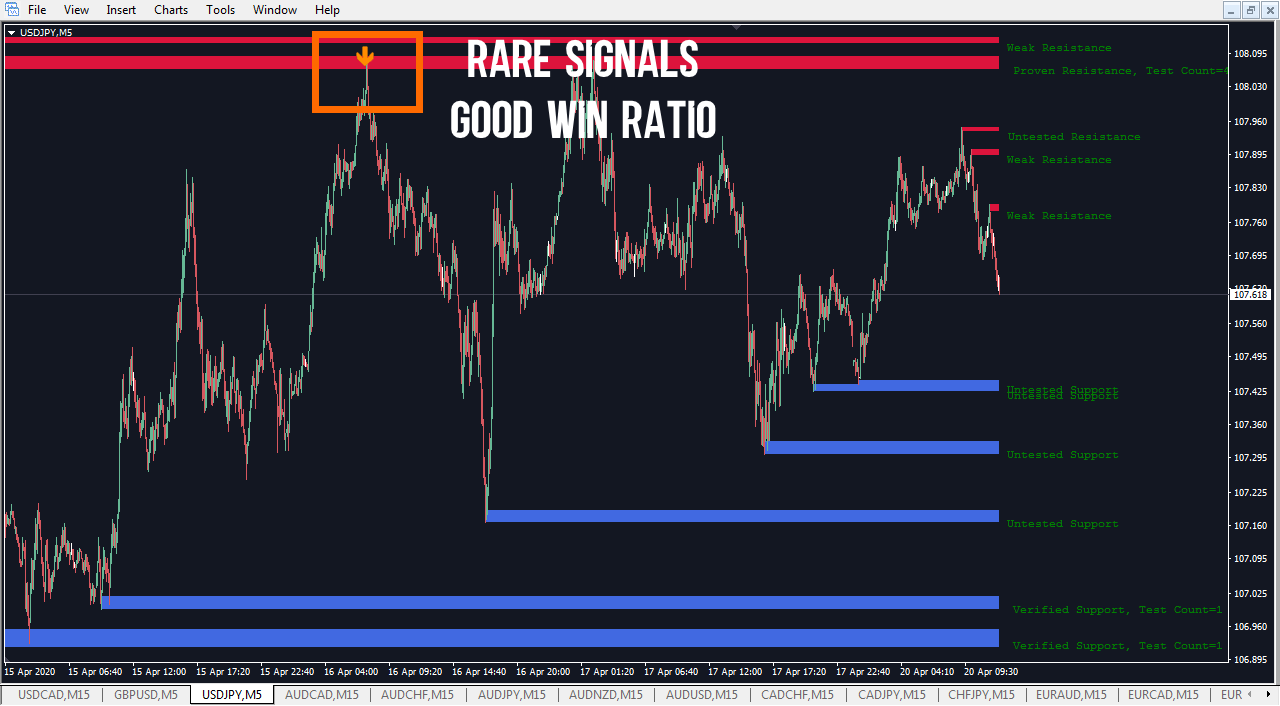
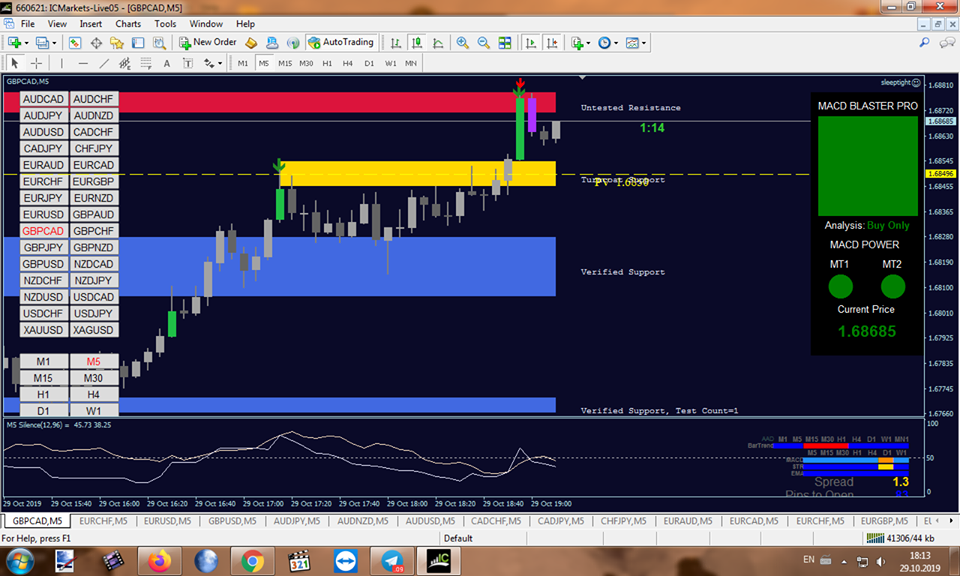
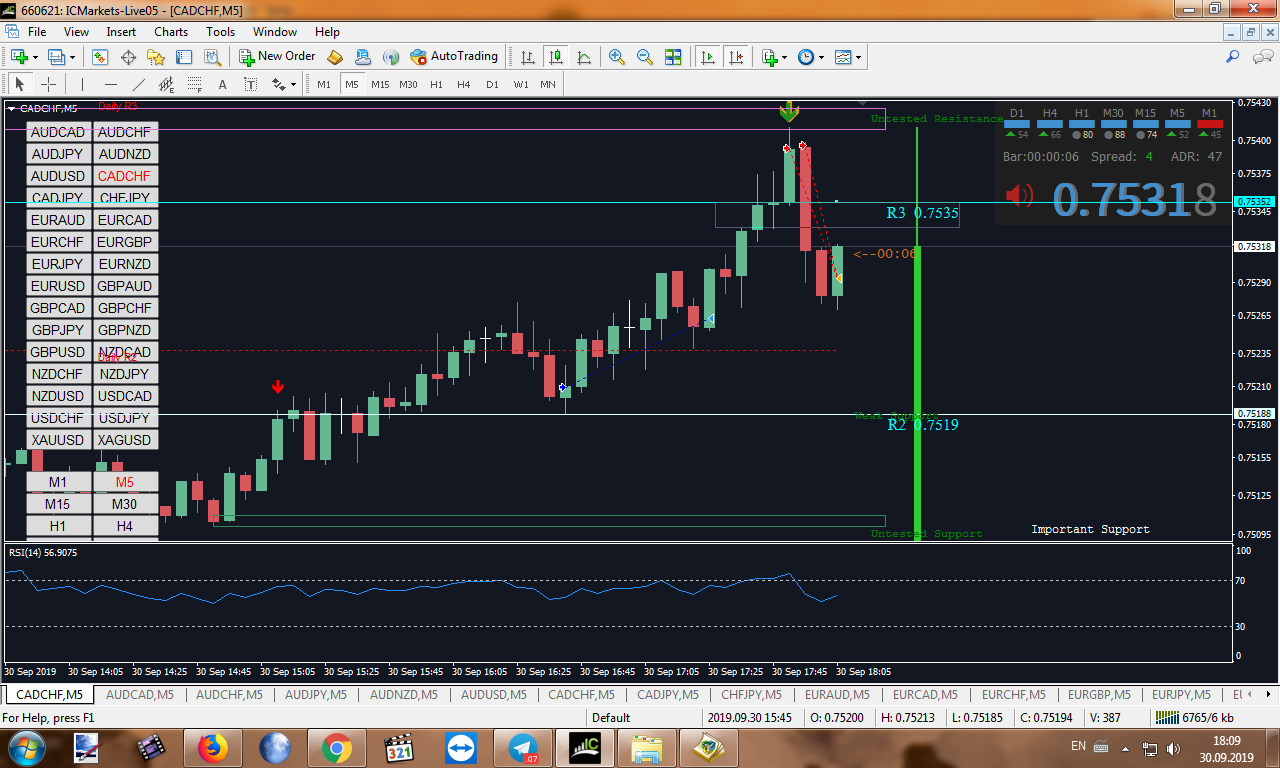
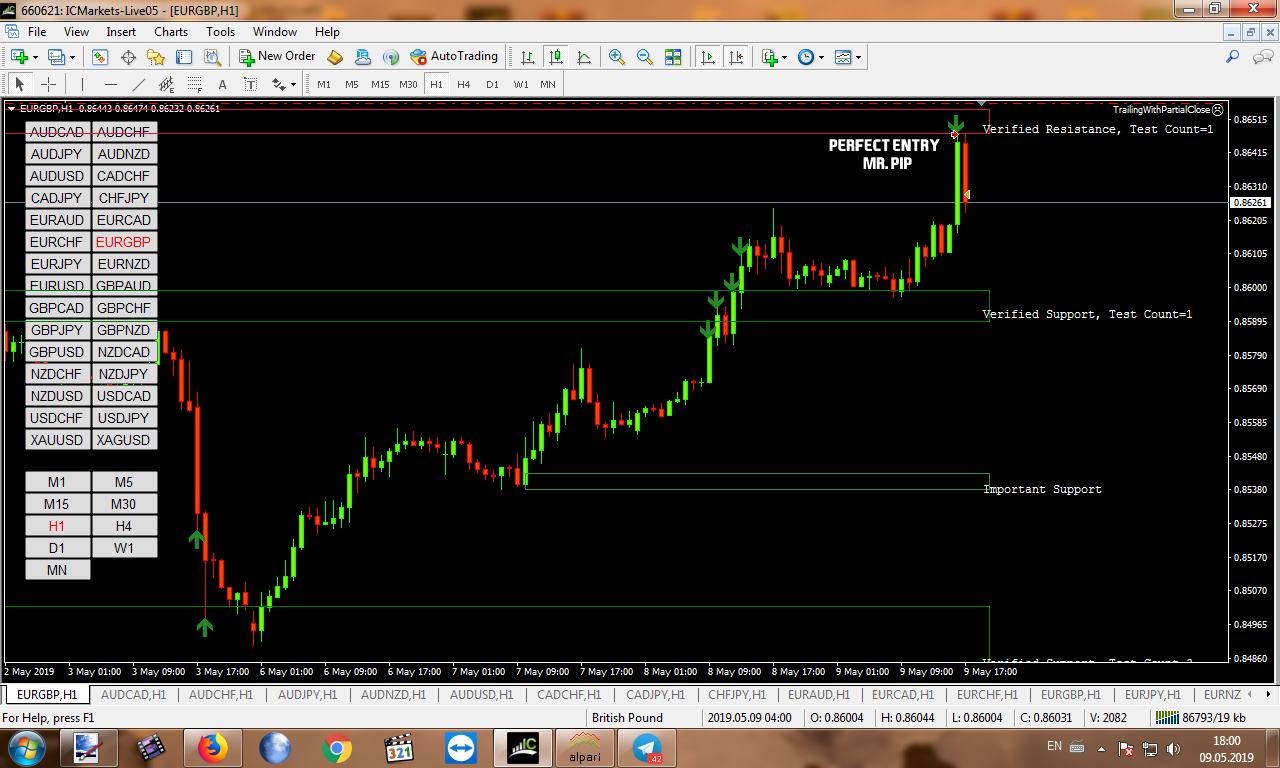
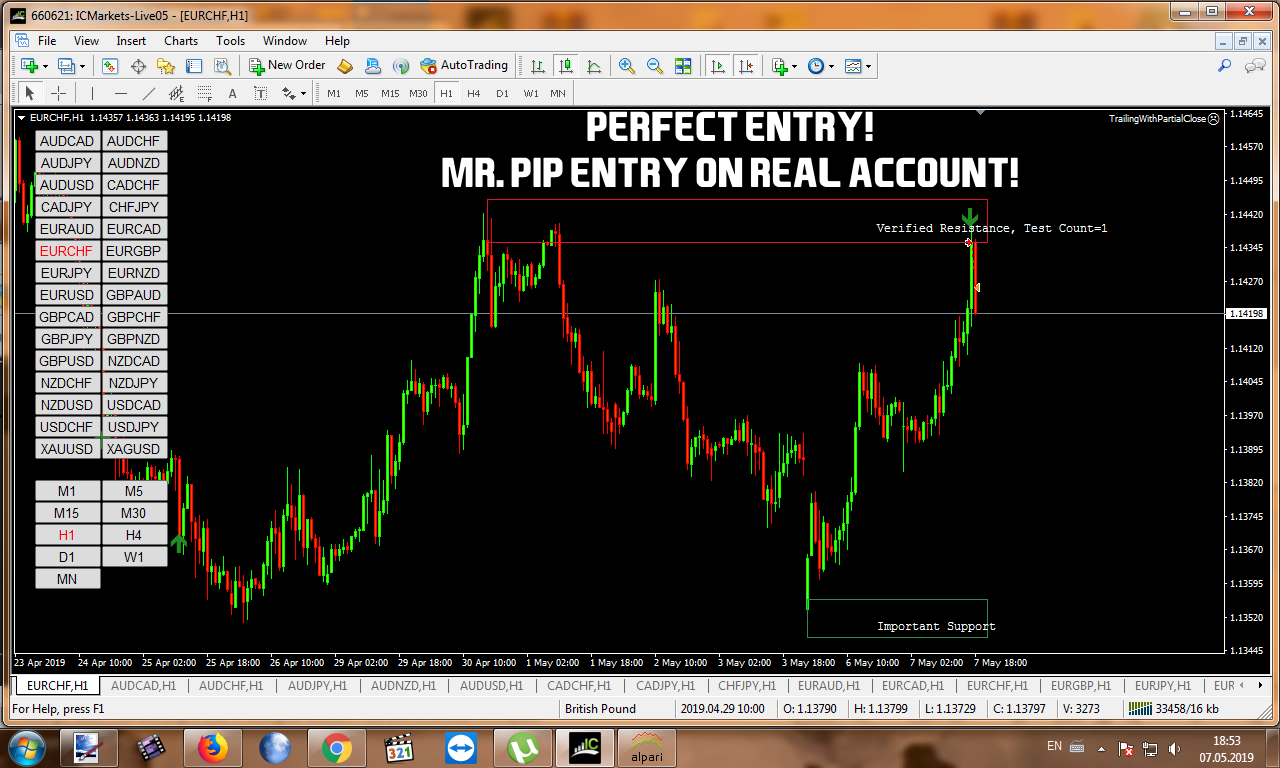
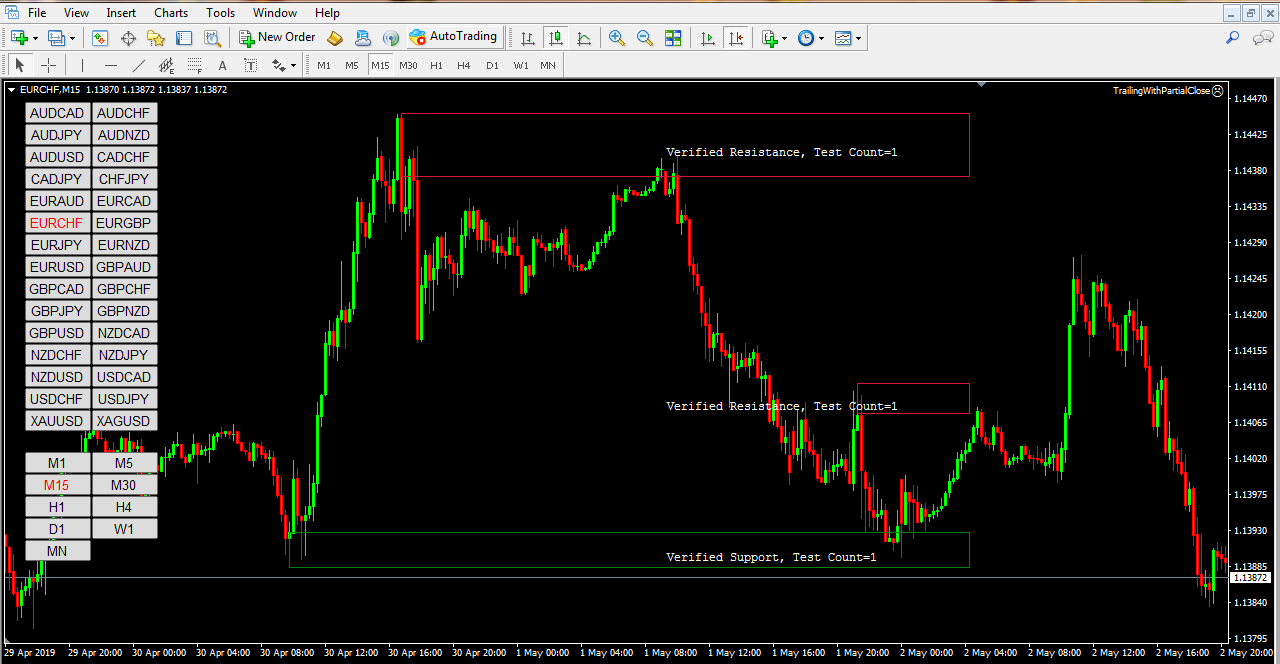
I am fulltime trader with over 7 years of forex experience. I developed my own strategy based on supply/demand levels!
I also trade binary options for fun, the real money comes from forex!
Motto: Take what you need and leave, don't look back!
I also trade binary options for fun, the real money comes from forex!
Motto: Take what you need and leave, don't look back!