Young Ho Seo / Perfil
- Informações
|
10+ anos
experiência
|
62
produtos
|
1182
versão demo
|
|
4
trabalhos
|
0
sinais
|
0
assinantes
|
Harmonic Pattern Indicator - Repainting + Japanese Candlestick Pattern Scanner + Automatic Channel + Many more
https://www.mql5.com/en/market/product/4488
https://www.mql5.com/en/market/product/4475
https://algotrading-investment.com/portfolio-item/harmonic-pattern-plus/
Non Repainting and Non Lagging Harmonic Pattern Indicator – Customizable Harmonic + Japanese Candlestic Pattern Scanner + Advanced Channel + Many more
https://www.mql5.com/en/market/product/41993
https://www.mql5.com/en/market/product/41992
https://algotrading-investment.com/portfolio-item/profitable-pattern-scanner/
Supply Demand Indicator – Multiple Timeframe Scanning Added + Non Repainting + Professional Indicator
https://www.mql5.com/en/market/product/40076
https://www.mql5.com/en/market/product/40075
https://algotrading-investment.com/portfolio-item/ace-supply-demand-zone/
Momentum Indicator – Path to Volume Spread Analysis
https://www.mql5.com/en/market/product/30641
https://www.mql5.com/en/market/product/30621
https://algotrading-investment.com/portfolio-item/excessive-momentum-indicator/
Elliott Wave Indicator for the Power User
https://www.mql5.com/en/market/product/16479
https://www.mql5.com/en/market/product/16472
https://algotrading-investment.com/portfolio-item/elliott-wave-trend/
Forex Prediction - Turn Support and Resistance to the Advanced Strategy
https://www.mql5.com/en/market/product/49170
https://www.mql5.com/en/market/product/49169
https://algotrading-investment.com/portfolio-item/fractal-pattern-scanner/
MetaTrader 4 and MetaTrader 5 Product Page: https://www.mql5.com/en/users/financeengineer/seller#products
Free Forex Prediction with Fibonacci Analysis: https://algotrading-investment.com/2020/10/23/forex-prediction-with-fibonacci-analysis/
Free Harmonic Pattern Signal: https://algotrading-investment.com/2020/12/17/harmonic-pattern-signal-for-forex-market/
============================================================================================================================
Here are the trading education books. We recommend reading these books if you are a trader or investor in Forex and Stock market. In the list below, we put the easy to read book on top. Try to read the easy to read book first and try to read the harder book later to improve your trading and investment.
First Link = amazon.com, Second Link = Google Play Books, Third Link = algotrading-investment.com, Fourth Link = Google Books
Technical Analysis in Forex and Stock Market (Supply Demand Analysis and Support Resistance)
https://www.amazon.com/dp/B09L55ZK4Z
https://play.google.com/store/books/details?id=pHlMEAAAQBAJ
https://algotrading-investment.com/portfolio-item/technical-analysis-in-forex-and-stock-market/
https://books.google.co.kr/books/about?id=pHlMEAAAQBAJ
Science Of Support, Resistance, Fibonacci Analysis, Harmonic Pattern, Elliott Wave and X3 Chart Pattern (In Forex and Stock Market Trading)
https://www.amazon.com/dp/B0993WZGZD
https://play.google.com/store/books/details?id=MME3EAAAQBAJ
https://algotrading-investment.com/portfolio-item/science-of-support-resistance-fibonacci-analysis-harmonic-pattern/
https://books.google.co.kr/books/about?id=MME3EAAAQBAJ
Profitable Chart Patterns in Forex and Stock Market (Fibonacci Analysis, Harmonic Pattern, Elliott Wave, and X3 Chart Pattern)
https://www.amazon.com/dp/B0B2KZH87K
https://play.google.com/store/books/details?id=7KrQDwAAQBAJ
https://algotrading-investment.com/portfolio-item/profitable-chart-patterns-in-forex-and-stock-market/
https://books.google.com/books/about?id=7KrQDwAAQBAJ
Guide to Precision Harmonic Pattern Trading (Mastering Turning Point Strategy for Financial Trading)
https://www.amazon.com/dp/B01MRI5LY6
https://play.google.com/store/books/details?id=8SbMDwAAQBAJ
http://algotrading-investment.com/portfolio-item/guide-precision-harmonic-pattern-trading/
https://books.google.com/books/about?id=8SbMDwAAQBAJ
Scientific Guide to Price Action and Pattern Trading (Wisdom of Trend, Cycle, and Fractal Wave)
https://www.amazon.com/dp/B073T3ZMBR
https://play.google.com/store/books/details?id=5prUDwAAQBAJ
https://algotrading-investment.com/portfolio-item/scientific-guide-to-price-action-and-pattern-trading/
https://books.google.com/books/about?id=5prUDwAAQBAJ
Predicting Forex and Stock Market with Fractal Pattern: Science of Price and Time
https://www.amazon.com/dp/B086YKM8BW
https://play.google.com/store/books/details?id=VJjiDwAAQBAJ
https://algotrading-investment.com/portfolio-item/predicting-forex-and-stock-market-with-fractal-pattern/
https://books.google.com/books/about?id=VJjiDwAAQBAJ
Trading Education Book 1 in Korean (Apple, Google Play Book, Google Book, Scribd, Kobo)
https://books.apple.com/us/book/id1565534211
https://play.google.com/store/books/details?id=HTgqEAAAQBAJ
https://books.google.co.kr/books/about?id=HTgqEAAAQBAJ
https://www.scribd.com/book/505583892
https://www.kobo.com/ww/en/ebook/8J-Eg58EDzKwlpUmADdp2g
Trading Education Book 2 in Korean (Apple, Google Play Book, Google Book, Scribd, Kobo)
https://books.apple.com/us/book/id1597112108
https://play.google.com/store/books/details?id=shRQEAAAQBAJ
https://books.google.co.kr/books/about?id=shRQEAAAQBAJ
https://www.scribd.com/book/542068528
https://www.kobo.com/ww/en/ebook/X8SmJdYCtDasOfQ1LQpCtg
About Young Ho Seo
Young Ho Seo is an Engineer, Financial Trader, and Quantitative Developer, working on Trading Science and Investment Engineering since 2011. He is the creator of many technical indicators, price patterns and trading strategies used in the financial market. He is also teaching the trading practice on how to use the Supply Demand Analysis, Support, Resistance, Trend line, Fibonacci Analysis, Harmonic Pattern, Elliott Wave Theory, Chart Patterns, and Probability for Forex and Stock Market. His works include developing scientific trading principle and mathematical algorithm in the work of Benjamin Graham, Everette S. Gardner, Benoit Mandelbrot, Ralph Nelson Elliott, Harold M. Gartley, Richard Shabacker, William Delbert Gann, Richard Wyckoff and Richard Dennis. You can find his dedicated works on www.algotrading-investment.com . His life mission is to connect financial traders and scientific community for better understanding of this world and crowd behaviour in the financial market. He wrote many books and articles, which are helpful for understanding the technology and application behind technical analysis, statistics, time series forecasting, fractal science, econometrics, and artificial intelligence in the financial market.
If you are interested in our software and training, just visit our main website: www.algotrading-investment.com
Young Ho Seo
Advanced Harmonic Pattern Detection Indicator for MetaTrader 5
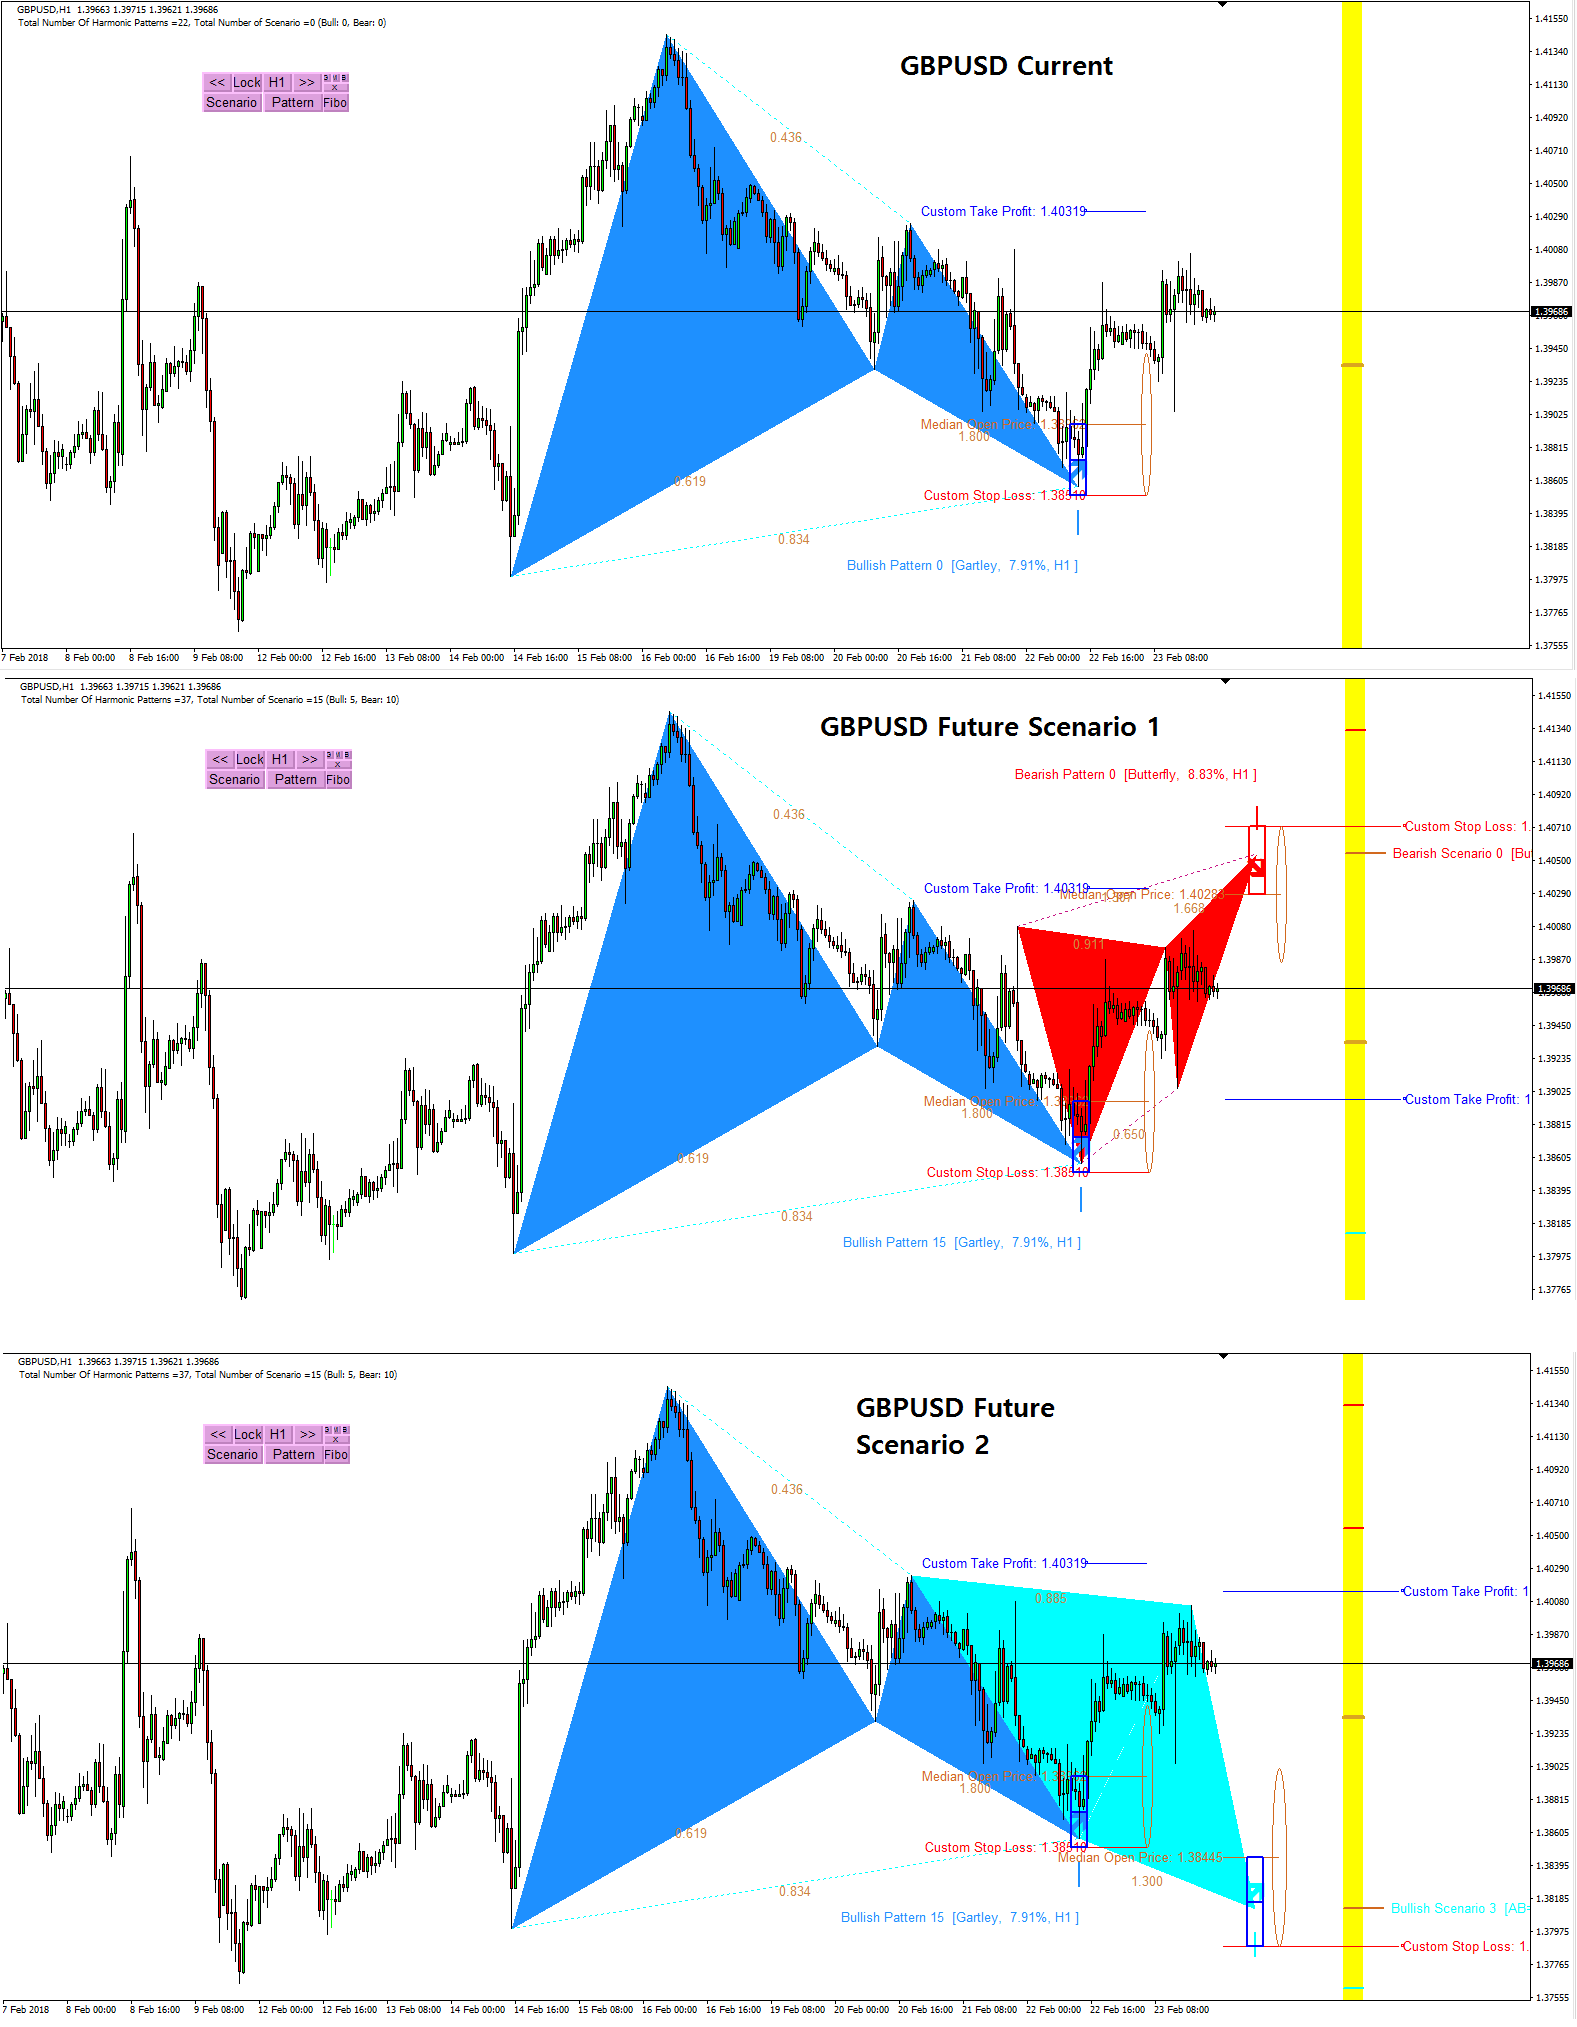
Harmonic Pattern Scenario Planner is an advanced Harmonic Pattern Detection Indicator. This is probably the most sophisticated harmonic pattern detection indicator for MetaTrader 5 platform.
Harmonic Pattern Scenario planner can be used like Harmonic Pattern Plus. Hence, it is easy and friendly to use. At the same time, it combines powerful Monte Carlos Simulation to provide you advanced harmonic pattern search capability.
Monte Carlo Simulation can help you to find future reversal points in advance.
In addition, you can watch the YouTube Video to feel what is the automated harmonic pattern indicator like. For your information, we provides two YouTube videos with title and links below.
YouTube “Harmonic Pattern Indicator”: https://youtu.be/CzYUwk5qeCk
YouTube “Non Repainting Non Lagging Harmonic Pattern Indicator”: https://youtu.be/uMlmMquefGQ
Here is the product link to Harmonic Pattern Scenario Planner for MetaTrader 5. You can find more about the features of this advanced Harmonic Pattern Scenario Planner.
https://www.mql5.com/en/market/product/6101
https://algotrading-investment.com/portfolio-item/harmonic-pattern-scenario-planner/

Young Ho Seo
Turning Point in Pairs Trading
Pairs trading is a market-neutral strategy that involves buying one asset and shorting another. Pairs trading or the similar trading principle is often employed by the hedge funds and institutional investors. Like value investing and the economic data, the pairs trading explains the occurrence of the turning point well. Therefore, if you have the working knowledge of the pairs trading, it could help you to use price pattern better. At the same time, with pairs trading, we can still apply the margin of safety and spread we have learnt from the value investing strategy. Hence, it is the good trading strategy to be covered in this book.
Pairs trading starts with identifying a pair of assets that are believed to have some long-run equilibrium relationship. When the spread has diverged sufficiently, the strategy will buy the undervalued asset and sell the overvalued asset. The strategy achieves a hedging or risk neutral state by taking two assets at the same time in different direction. Pairs trading strategy is applicable to both Forex and Stock market. The process of the pairs trading can be summarized into the following four steps.
Identify two assets whose prices have moved together historically in long term.
Calculate the correlation, co-integration, historical spread between two assets.
When the spread between two assets are diverged excessively high, then buy the undervalued asset and sell the overvalued asset.
When the spread is reverting back to normal range, close the positions of the two assets to take the profit.
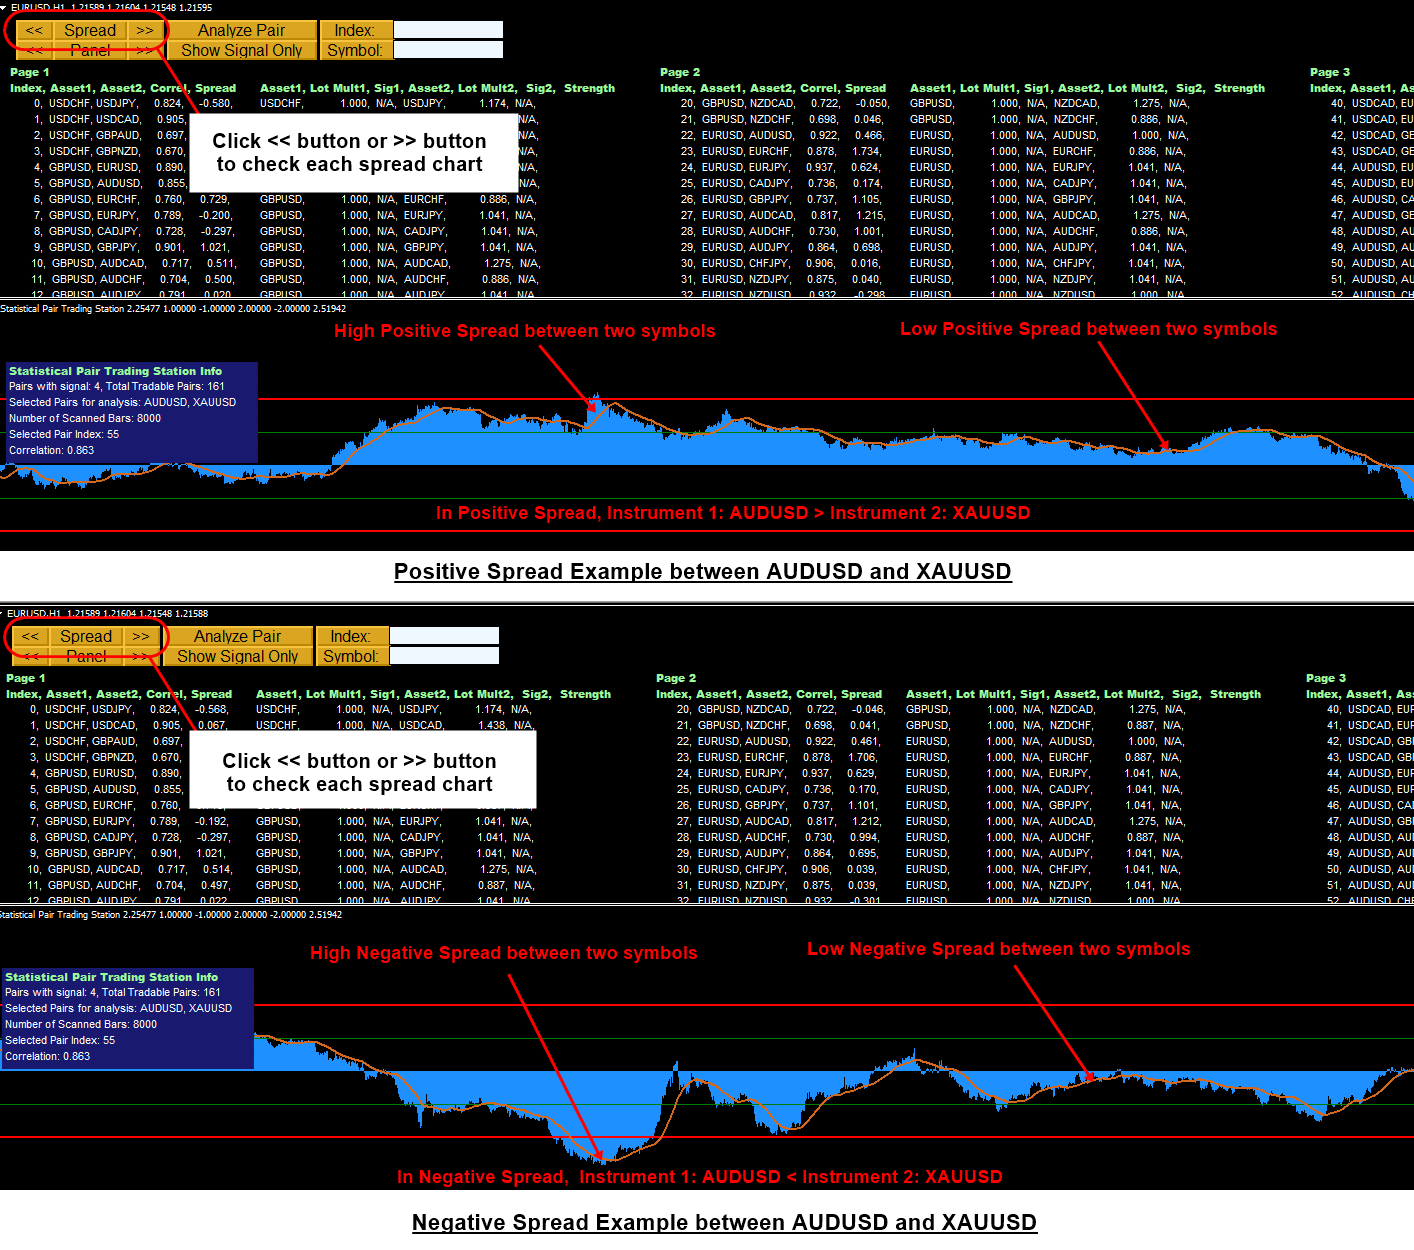
Figure 2-3: Normalized AUDUSD vs EURUSD on the top and spread chart on the bottom (Chart: www.algotrading-investment.com, Optimum Chart)
Except the spread is measured between two assets, the trading principle of the pairs trading is similar to the value investing. For example, the pairs trading involves to recognize the unusual high spread between the two highly correlated assets whereas the value investing involves to recognize the unusual high spread between the intrinsic value and the stock price. Hence, the unusual high spread provides the margin of safety in the pairs trading. In another words, if the spread is higher, then it favours our positions more but with less risk. Typically, the trader applies the statistical knowledge in picking the spread limit to trigger the entry. For example, as in the standard deviation, the spread 3 might be the bottom line to consider the entry. However, the choice of the spread limit to trigger trading could be varying for different assets. Sometimes the historical spread of some assets shows that the spread 4 is the appropriate choice for the spread limit. Sometimes, the historical spread of some assets shows that the spread 3 is the appropriate choice for the spread limit. To choose the right spread limit, it is best to inspect the historical spread first in the chart. However, to provide you some rule of thumb guideline, for the stock market, spread 4 or over might be considered to trigger the entry. For the Forex market, the spread 3.5 or over might be considered to trigger the entry. As the pairs trading shares common ground with statistics, some people call the pairs trading as the statistical arbitrage. As in the margin of safety in the value investing, the higher spread between two assets, the absolute spread in fact, can be considered as the higher margin of safety.
Since the pairs trading involves to take the positions for two assets, this provides some of its own properties, which is different from other strategy. For example, we could provide two illustrative examples when the positions are closed with profits. These two illustrative examples are not necessarily the exhaust list of scenarios for the movements of two assets. However, we have selected them as they can visualize the process of the formation of the turning point better than other scenarios.
For the first example, consider that we bought the one asset with low price and sold another asset with high price when the spread was diverged sufficiently high. In this example, the asset with low price (=Symbol B) could make the bullish turning point to reach the price level of another asset because they are supposed to move together in long run. We are in profit due to the sharp rise in the asset with low price (=Symbol B) after the bullish turning point.
Figure 2-4: Normalized EURUSD vs GBPUSD on the top and spread chart on the bottom (Chart: www.algotrading-investment.com, Optimum Chart)
In the second example, the asset with high price (=Symbol B) could make the bearish turning point to reach the price level of another asset because they are supposed to move together in long run. We are in profit due to the sharp fall in the asset with high price (=Symbol B) after the bearish turning point.
Figure 2-5: Normalized CADJPY vs EURJPY on the top and spread chart on the bottom (Chart: www.algotrading-investment.com, Optimum Chart)
From the two illustrative examples, we could draw two useful trading principle. Firstly, when the spread is sufficiently high, it is possible to have a turning point between two assets. The bullish turning point could happen to the asset with low price or the bearish turning point could happen to the asset with high price. As in value investing, the pairs trading provides an explanation to the formation of the turning point in the financial market. Secondly, taking the opposite positions on two assets reduce the risk of the market volatility. This is considered as the hedging or the risk neural strategy. Since we are holding one position in opposite direction to other position, we are exposed less on the market volatility. Although hedging is an optional practice only, you never know if you like or dislike such a trading principle. If you do not understand the hedging effect, you might open a Forex demo or simulation account for an educational purpose. Search two highly correlated assets. Then buy one and sell the other. Monitor the profits and loss of the two assets for some time.
In the Forex market, since you can enter the sell position as well as the buy position, the pairs trading can be applicable. The pairs trading can be applicable to the stock trading too. If the pairs trading strategy provides the high spread between two stocks in your portfolio, then you can sell the stock in your portfolio and buy more on the other stock in your portfolio. If the pairs trading strategy provides the high spread between one stock in your portfolio and the other stock outside your portfolio, then you can sell the stock in your portfolio and buy the new stock for your portfolio. Since the spread in the pairs trading is calculated in real time, it can be considered as the quantitative trading strategy. This helps us to trade with less emotion. In addition, the price pattern can be combined with the pairs trading strategy to improve their performance. In that case, the margin of safety in the pairs trading could be applied to confirm the direction of the price pattern. However, there are some disadvantages for the pairs trading too. For example, this technique might be more complicated than other trading strategy. Firstly, they could be more complicated because the technique involves dealing with two assets at the same time. Secondly, they could be more complicated because the technique requires some knowledge of statistics and statistical trading.
About this Article
This article is the part taken from the draft version of the Book: Science Of Support, Resistance, Fibonacci Analysis, Harmonic Pattern, Elliott Wave and X3 Chart Pattern. Full version of the book can be found from the link below:
https://algotrading-investment.com/portfolio-item/science-of-support-resistance-fibonacci-analysis-harmonic-pattern/
You can also use Pairs Trading or Spread Analysis in MetaTrader to accomplish your technical analysis. Here is the landing page for Pairs Trading Station in MetaTrader 4 and MetaTrader5.
https://algotrading-investment.com/portfolio-item/pair-trading-station/
https://www.mql5.com/en/market/product/3303
https://www.mql5.com/en/market/product/3304
Below is the landing page for Optimum Chart, which is the standalone tool to scan the trading opportunities for all symbols and all timeframe in one button click.
https://algotrading-investment.com/2019/07/23/optimum-chart/

Young Ho Seo
Most advanced Elliott Wave Software for MetaTrader 5
MetaTrader 5 is the next generation trading platform developed by Meta Quote who developed MetaTrader 4. MetaTrader 5 is far exceeding trading platform of its predecessor, MetaTrader 4. MetaTrader 5 is accessible for free of charge for any trader from all over the world. More and more brokers are now offering MetaTrader 5 trading options even including US based firms.
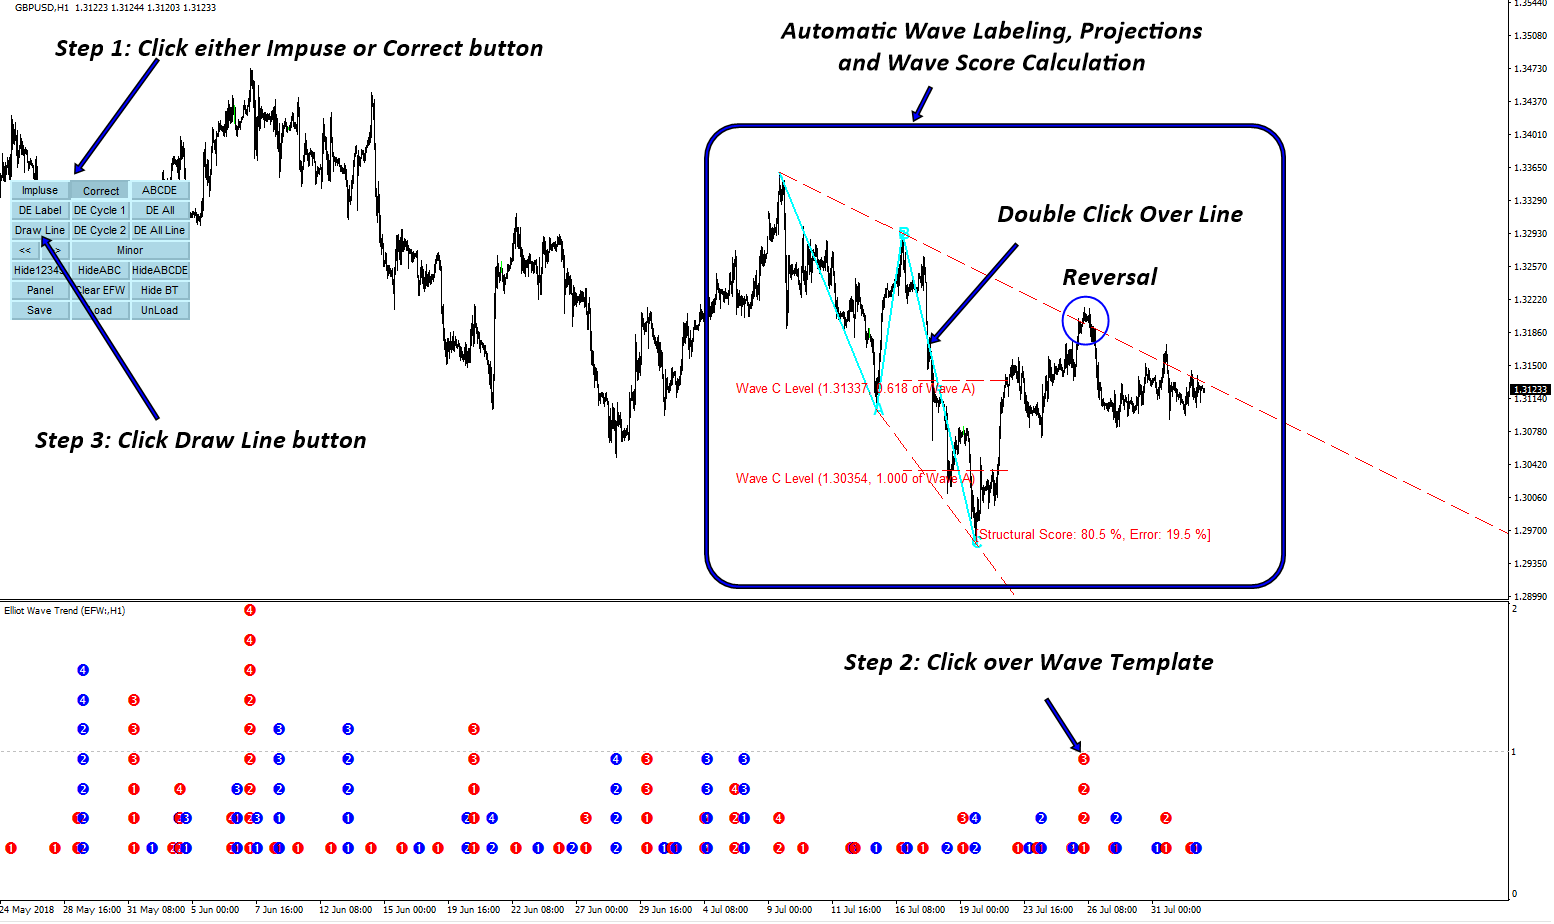
Elliott Wave Trend is the most advanced Elliott Wave Trading software, which helps you to trade with various Elliott Wave patterns like Wave .12345 pattern and Wave .ABC and Wave .ABCDE, etc. Elliott Wave Trend was built on the concept of Precision Trading with Elliott Wave Structure Score. Our Elliott Wave Trend is professional tool for professional trader. Yet, the price of it is affordable.
Our Elliott Wave Trend is available in both MetaTrader 4 and MetaTrader 5 version.
https://algotrading-investment.com/2018/10/25/how-elliott-wave-can-improve-your-trading-performance/
At the same time, you can watch YouTube video titled as “Elliott Wave Trend Intro to find out more about Elliott Wave Trend Indicator.
YouTube Link: https://youtu.be/Oftml-JKyKM
Link to Elliott Wave Trend.
https://algotrading-investment.com/portfolio-item/elliott-wave-trend/
https://www.mql5.com/en/market/product/16472
https://www.mql5.com/en/market/product/16479

Young Ho Seo
Special Discount for Happy Christmas on MetaTrader Indicators and Scanners
The Festive Season is a time for celebration, enjoyment, and goodwill, especially at the Christmas. However, Christmas is bound to look different this year due to the attack of the COVID 19. However, still, we can have the best Christmas this year with our family and friends. Just make sure to keep the basic guide line to be safe from the COVID 19 during this Festive Season.
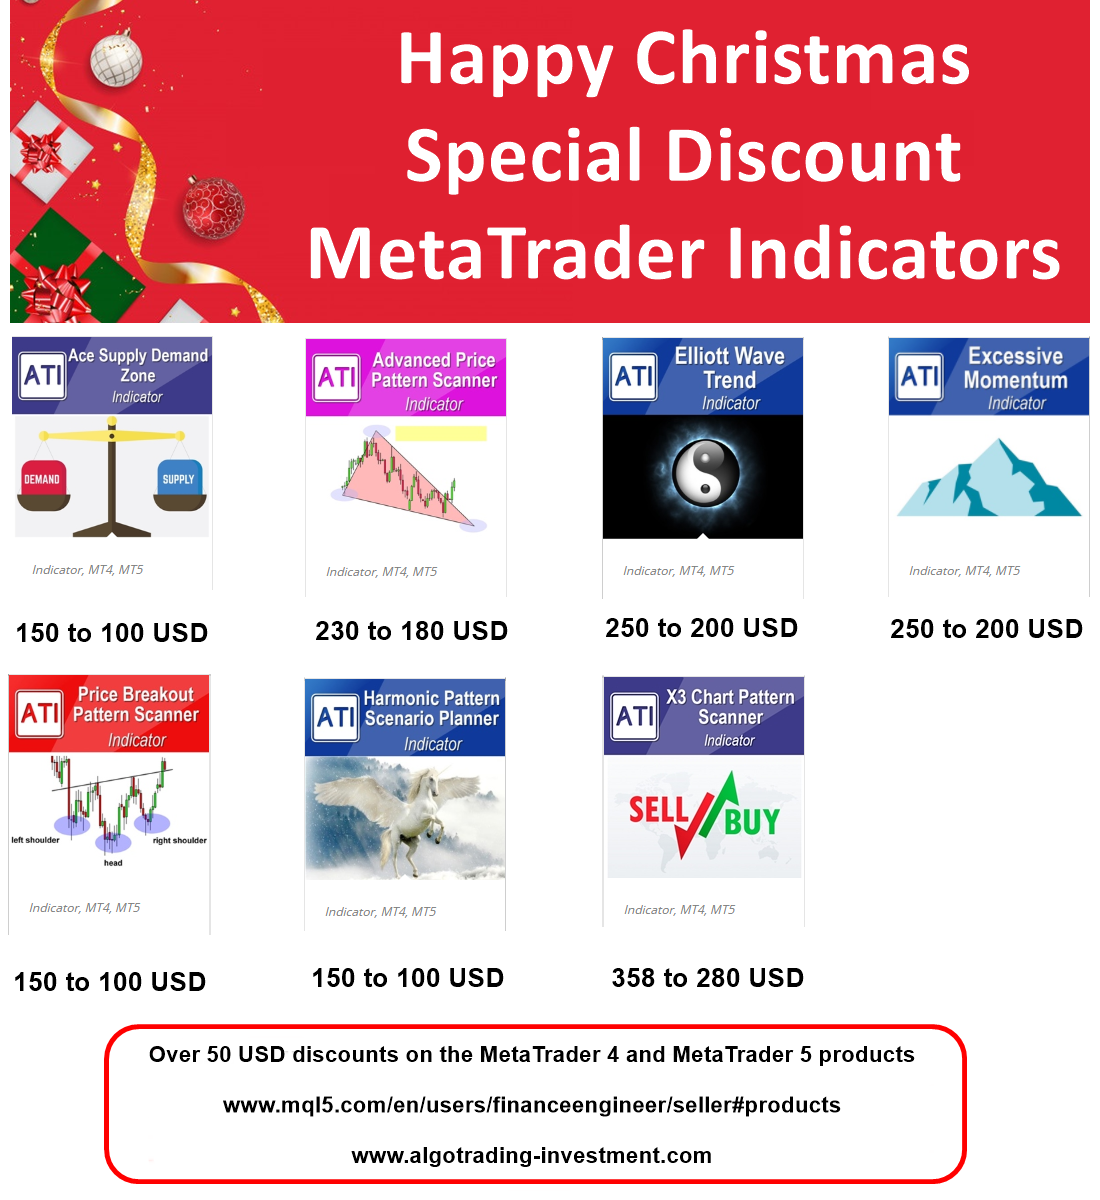
By the way, in this Christmas, we will provide over 50 dollar direct discounts on the following MetaTrader 4 and MetaTrader 5 products on mql5.com. Make sure that you get these MetaTrader indicators and scanners before they go back to the original price.
Ace Supply Demand Zone indicator (150 to 100 dollar)
Advanced Price Pattern Scanner (230 to 180 dollar)
Elliott Wave Trend (250 to 200 dollar)
Price Breakout Pattern Scanner (150 to 100 dollar)
Harmonic Pattern Scenario Planner (150 to 100 dollar)
X3 Chart Pattern Scanner (358 to 280 dollar)
Excessive Momentum Indicator (250 to 200 dollar)
For your information, above price does not include 20% VAT. The discounted MetaTrader products are available from the link below:
https://www.mql5.com/en/users/financeengineer/seller#products
https://www.algotrading-investment.com/

Young Ho Seo
Guide to Precision Harmonic Pattern Trading Book on Google Play Book and Google Book
We have our Book: Guide to Precision Harmonic Pattern Trading on Google Play Book and Google Book. This is a great book delivering the latest Harmonic Pattern Trading knowledge. A must read if you are using Harmonic Pattern Indicator or scanner or manually trading with Harmonic Patterns for Forex trading. This book details with how to improve your trading and the risk management when you use the harmonic pattern. Besides the Google Play Book and Google Book, you should be able to find this book from many other international book distributor like amazon.com, scribd.com, apple book and so on.
Here is the link for Google Play Book.
https://play.google.com/store/books/details?id=8SbMDwAAQBAJ
Here is the link for Google Book
https://books.google.com/books/about?id=8SbMDwAAQBAJ&redir_esc=y
Also there are some free articles to help your Forex Trading. Of course, these articles are useful for your trading and free as usual.
https://algotrading-investment.com/2019/07/23/trading-education/
You can watch the YouTube Video to feel what is the automated harmonic pattern indicator like. For your information, we provides two YouTube videos with title and links below.
YouTube “Harmonic Pattern Indicator”: https://youtu.be/CzYUwk5qeCk
YouTube “Non Repainting Non Lagging Harmonic Pattern Indicator”: https://youtu.be/uMlmMquefGQ
Below is the website link providing automated Harmonic Pattern and Elliott Wave Pattern Trading tools for Forex and Stock Market.
a) Harmonic Pattern Plus
https://www.mql5.com/en/market/product/4488
https://www.mql5.com/en/market/product/4475
https://algotrading-investment.com/portfolio-item/harmonic-pattern-plus/
b) Harmonic Pattern Scenario planner
https://www.mql5.com/en/market/product/6240
https://www.mql5.com/en/market/product/6101
https://algotrading-investment.com/portfolio-item/harmonic-pattern-scenario-planner/
c) X3 Chart Pattern Scanner
https://www.mql5.com/en/market/product/41993
https://www.mql5.com/en/market/product/41992
https://algotrading-investment.com/portfolio-item/profitable-pattern-scanner/
All the best for your Forex trading.

Young Ho Seo
Introduction to Equilibrium Fractal Wave Analytics
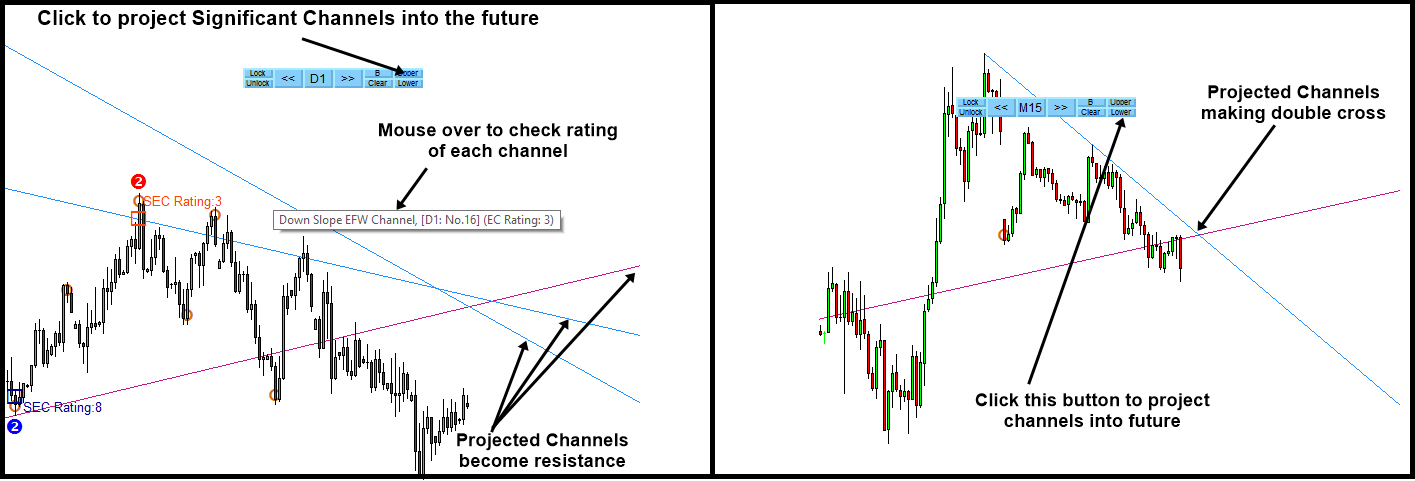
EFW Analytics was designed to accomplish the statement “We trade because there are regularities in the financial market”. EFW Analytics is a set of tools designed to maximize your trading performance by capturing the repeating fractal geometry, known as the fifth regularity in the financial market. The functionality of EFW Analytics consists of three parts including:
1. Equilibrium Fractal Wave Index: exploratory tool to support your trading logic to choose which ratio to trade
2. Superimposed Pattern Detection as turning point analysis
3. Superimposed Channel for market prediction with Golden ratio expansion
4. Superimposed Channel for market prediction with whole number expansion
5. Equilibrium Fractal Wave (EFW) Channel detection
6. Superimposed Channel Rating (Higher rating = higher predictive power)
EFW Analytics provide the graphic rich and fully visual trading styles. In default trading strategy, you will be looking at the combined signal from Superimposed pattern + EFW Channel or Superimposed pattern + Superimposed Channel. In addition, you can perform many more trading strategies in a reversal and breakout mode. You can also run two different timeframes in one chart to enforce your trading decision. Sound alert, email and push notification are built inside the indicator.
Below is the link to the EFW Analytics:
https://algotrading-investment.com/portfolio-item/equilibrium-fractal-wave-analytics/
https://www.mql5.com/en/market/product/27703
https://www.mql5.com/en/market/product/27702

Young Ho Seo
Harmonic Pattern Signal – Free
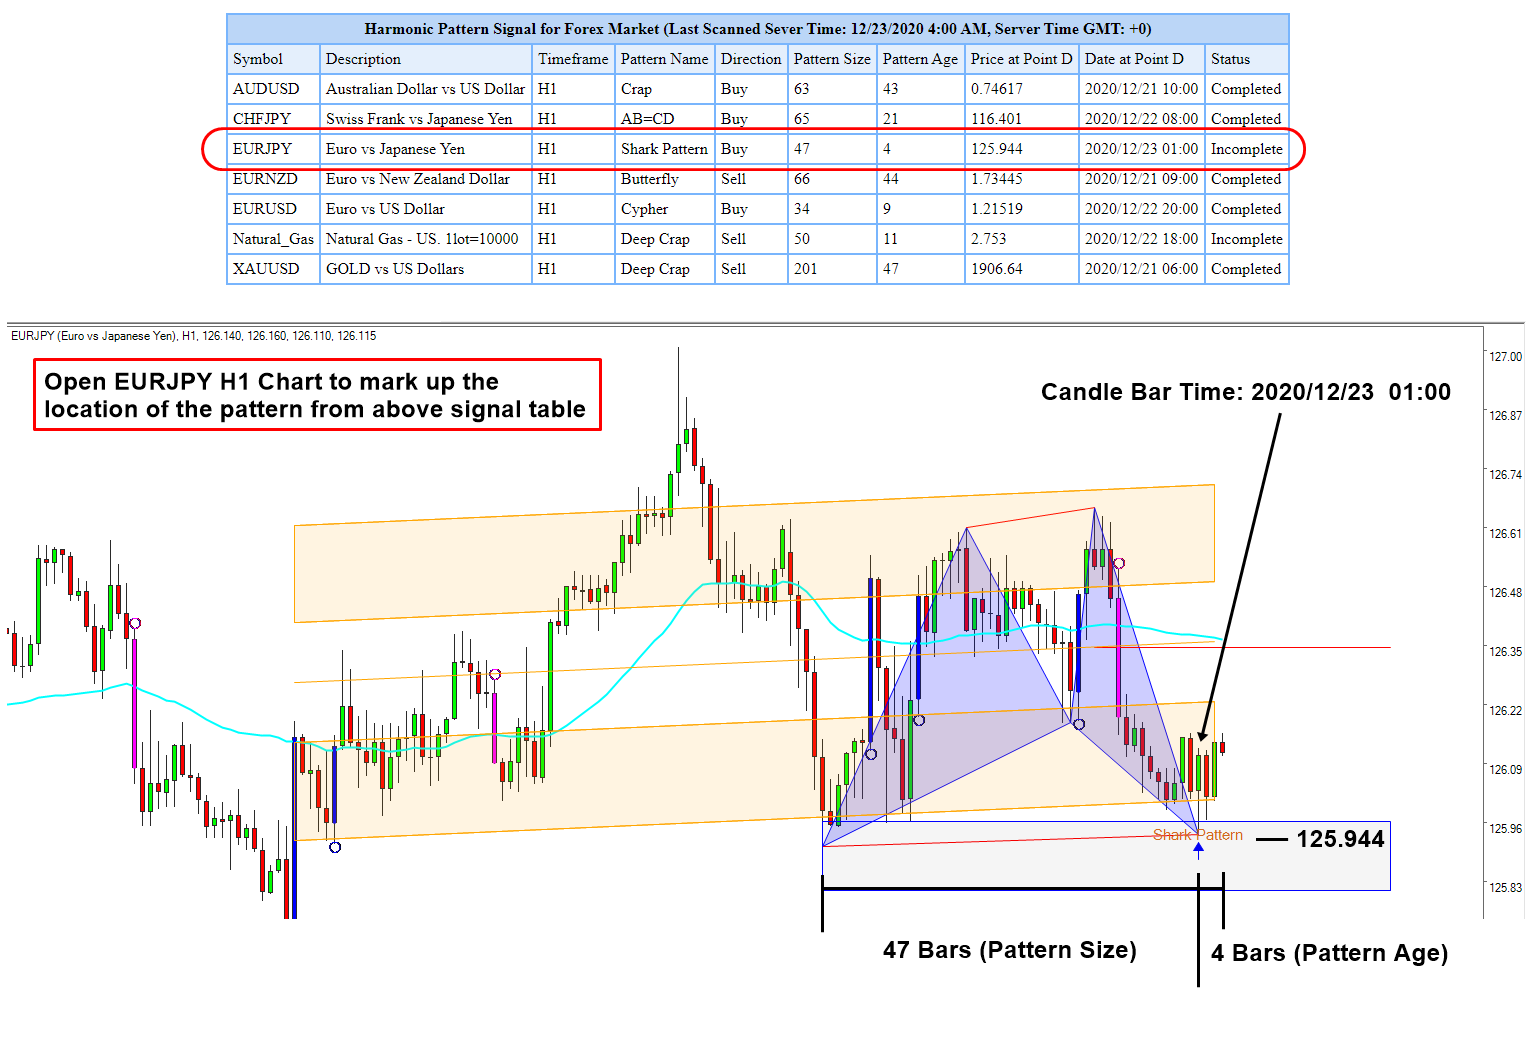
Harmonic Pattern Trading Signal provides a mean of detecting the turning point in the market. It is one way to solve the puzzle of market geometry, which is often not solvable with other technical indicators. Especially, we provide the Harmonic Pattern Signal for your trading. It is absolutely free of charge. The Harmonic Pattern Signal can be accessible from the link below.
https://algotrading-investment.com/2020/12/17/harmonic-pattern-signal-for-forex-market/
We present the trading signal in the simple table form. To use this trading signal, you need to mark up the location of the Harmonic Pattern in your chart. You can do this in any trading platform including MetaTrader, Trading View, Ninja Trader and so on. Follow the two steps below:
Open the Chart with the same timeframe shown in the table
Mark up the pattern location using Price at Point D and Date at Point D
That is all. Check the attached screenshot and more detailed Instruction can be found from the above link. Our Harmonic Pattern Trading signal is absolutely free. It is a good staring point for anyone who are interested in trading Forex market. At the same time, we provide the MetaTrader 4 and MetaTrader 5 version of Harmonic Pattern Scanner. If you prefer the indicator version of Harmonic Pattern Signal, then you can visit the product page for Harmonic Pattern Plus or X3 Chart Pattern Scanner.
=================================================
In addition, you can watch the YouTube Video to feel what is the automated harmonic pattern indicator like. For your information, we provides two YouTube videos with title and links below.
YouTube “Harmonic Pattern Indicator”: https://youtu.be/CzYUwk5qeCk
YouTube “Non Repainting Non Lagging Harmonic Pattern Indicator”: https://youtu.be/uMlmMquefGQ
Below are the Links to Harmonic Pattern Plus
https://www.mql5.com/en/market/product/4488
https://www.mql5.com/en/market/product/4475
https://algotrading-investment.com/portfolio-item/harmonic-pattern-plus/
Below are the Links to X3 Chart Pattern Scanner.
https://www.mql5.com/en/market/product/41993
https://www.mql5.com/en/market/product/41992
https://algotrading-investment.com/portfolio-item/profitable-pattern-scanner/

Young Ho Seo
How to Improve Supply and Demand Analysis
The supply and demand analysis does not require any complicated technical indicator and it bases its analysis mostly on the price itself. In fact, supply and demand analysis is another confirmative trading strategy that makes use of the fractal wave structure present in the forex and stock market. In another words, from the pattern identification to setting up the profit target and stop loss, the peak and trough play a crucial role. This characteristic is similar to other technical analysis mentioned earlier like the Support Resistance, Triangle pattern, Fibonacci Analysis, Harmonic Pattern, Elliott Wave pattern and X3 Chart Pattern. Hence, there are several ways to improve the supply and demand trading. In this book, we will show you one straightforward way to improve supply and demand analysis with the knowledge of fractal wave.
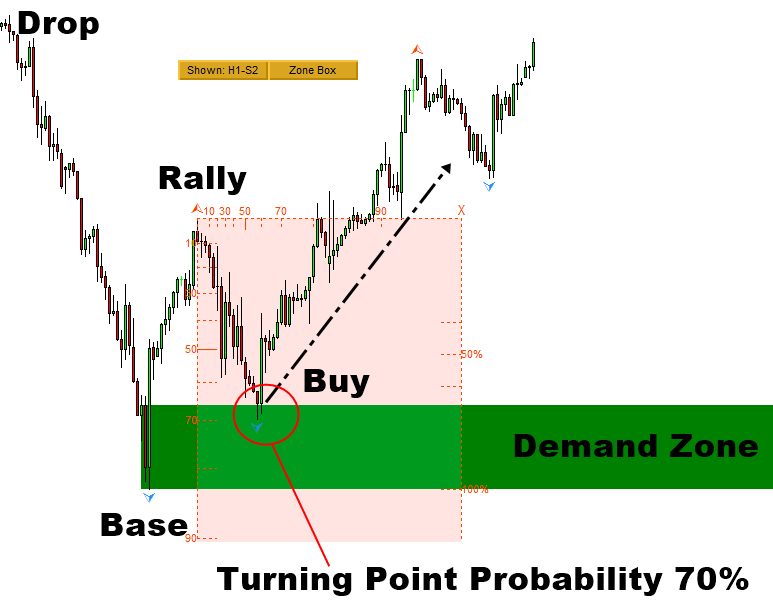
In the previous chapter, we have shown our trading examples using a virgin supply and demand zones. The virgin supply and demand zone refers to the zone that are not touched by price after the pattern was identified for our trading. We can improve the accuracy of this virgin supply and demand zone with the turning point probability. For example, when we trade with demand zone, we can ensure that the turning point probability is high at the location of the buy price. High turning point probability indicates the high chance for the price to turn. In another words, it indicates the high chance that the price approaching to the demand zone can rise soon. In the example for S&P 500 index, the price in its first touch of the demand zone was located around 70% turning point probability. In addition to the higher timeframe check-up, this turning point probability ensures that price is near the trough before going up.
Figure 8-1: S&P 500 index H1 timeframe
Let us have a look at the supply zone trading example. In the example for Gold against US dollar, the price in its first touch of the demand zone was located around 50% turning point probability. Practically, it is recommended to confirm at least 50% turning point probability before making the buy or sell entry.
Figure 8-2: Gold against US Dollar (=XAUUSD) H4 timeframe (www.algotrading-investment.com)
The turning point probability helps us to do two things here. Firstly, it helps us to check the chance of getting the correct turning point after the price touches the zone. Secondly, it helps us to assess the curvature of the price path before it touches the zone. The curvature of the price path is one of the key factor for the successful supply and demand zone identification as it ensures the clear rally and drop pattern around the zone.
Figure 8-3: Curvature marked in red for demand zone (top) and supply zone (bottom)
About this Article
This article is the part taken from the draft version of the Book: Technical Analysis in Forex and Stock Market (Supply Demand Analysis and Support Resistance). Full version of the book can be found from the link below:
https://algotrading-investment.com/portfolio-item/technical-analysis-in-forex-and-stock-market/
You can also use Ace Supply Demand Zone Indicator in MetaTrader to accomplish your technical analysis. Ace Supply Demand Zone indicator is non repainting and non lagging supply demand zone indicator with a lot of powerful features built on.
https://www.mql5.com/en/market/product/40076
https://www.mql5.com/en/market/product/40075
https://algotrading-investment.com/portfolio-item/ace-supply-demand-zone/
Turning Point Probability and Trend Probability can be measured with Fractal Pattern Scanner at every price action in your chart. For your information, beside the probability check up, there are many other powerful features built inside the Fractal Pattern Scanner. Below is the landing page to Fractal Pattern Scanner in MetaTrader 4 and MetaTrader 5.
https://www.mql5.com/en/market/product/49170
https://www.mql5.com/en/market/product/49169
https://algotrading-investment.com/portfolio-item/fractal-pattern-scanner/

Young Ho Seo

New Article – Various Risks in Trading and Investment
Trading and investment carry risk. The opportunities in trading and investment without risk rarely exits except some arbitrage opportunities, which will not be discussed in this book. In theory, you could develop several classes of risks for trading and investment. For example, risk in trading and investment can be classified as Macro and Micro risks depending on where they are originated. Macro and Micro risks can be subdivided further into smaller categories like the market risk, operational risk, liquidity risk, credit risk, political risk, etc. Read entire free article from below link:
https://algotrading-investment.com/2020/06/01/various-risks-in-trading-and-investment/
In addition, you can also have an access to important free articles for your trading here.
https://algotrading-investment.com/2019/07/23/trading-education/
Harmonic Pattern Plus (and also Harmonic Pattern Scenario Planner) is the repainting but non lagging Harmonic Pattern Scanner. You can get them for the affordable price. Below is links for them.
https://www.mql5.com/en/market/product/4488
https://www.mql5.com/en/market/product/4475
https://algotrading-investment.com/portfolio-item/harmonic-pattern-plus/
X3 Chart Pattern Scanner is non repainting and non lagging Harmonic Pattern and X3 pattern Scanner. Below is links for them.
https://www.mql5.com/en/market/product/41993
https://www.mql5.com/en/market/product/41992
https://algotrading-investment.com/portfolio-item/profitable-pattern-scanner/

Young Ho Seo
Excessive Momentum Trading
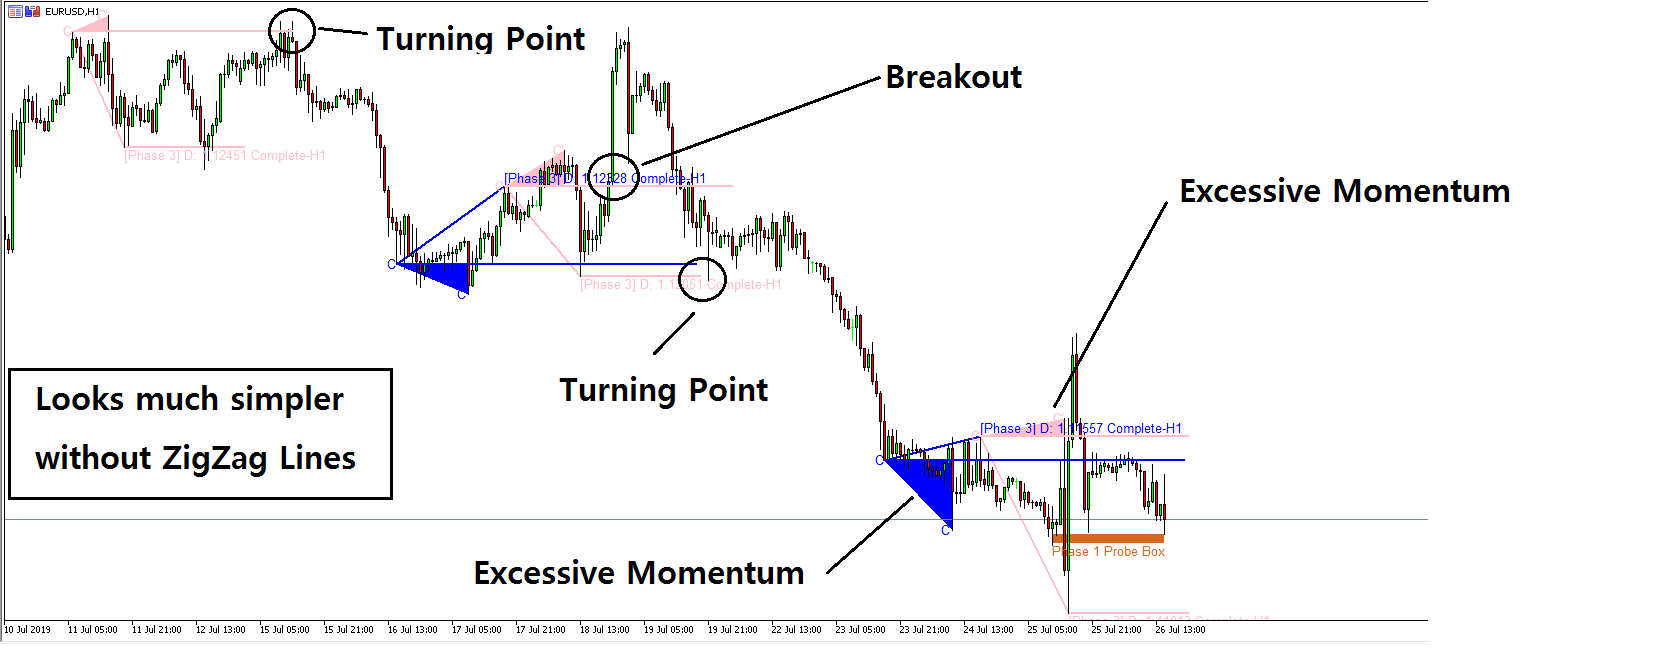
Excessive momentum is an important clue in our trading as well as the sideways market. You can consider Excessive momentum as the opposite concept to sideways market. So why Excessive momentum is important signal in our trading? Imagine that you are pouring some milk in your cup. It is fine until it is overflow. When milk is starting to get split from our cup, we realized that we need to take some correction.
This analogical concept can be applied to our trading too. Simply speaking, Excessive momentum can signal us that market can go through some brand new action from the existing trend. It might be turning point opportunity or reversal opportunity. Around this Excessive momentum area, market is more predictable. In addition, you have an opportunity to become early enterer with good profitable range.
Before, trader did not have a good tool to catch an excessive momentum but now we have the Excessive Momentum Indicator designed to catch Excessive momentum automatically in your chart. Good news is that this entry is more accurate with Excessive momentum than without Excessive momentum presents. Hence, Excessive momentum is ideal location to place your trading. Excessive momentum area is marked up as triangle in Excessive Momentum indicator.
At the same time, this Excessive Momentum Zone can be considered as either Accumulation or Distribution area in the Volume Spread Analysis. You can further find the symptoms of accumulation and distribution area using our Volume Spread Pattern Indicator (Paid and Advanced version) or Volume Spread Pattern Detector (Free and Light version). You can also watch the YouTube video to find out more about Excessive Momentum Indicator.
YouTube Video “Excessive Momentum Indicator”: https://youtu.be/oztARcXsAVA
YouTube Video “Excessive Momentum Indicator Explained”: https://youtu.be/A4JcTcakOKw
======================================
Here is the landing page for Excessive Momentum Indicator available in MetaTrader 4 and MetaTrader 5.
https://www.mql5.com/en/market/product/30641
https://www.mql5.com/en/market/product/30621
https://algotrading-investment.com/portfolio-item/excessive-momentum-indicator/

Young Ho Seo
Special Discount for Happy Christmas on MetaTrader Indicators and Scanners
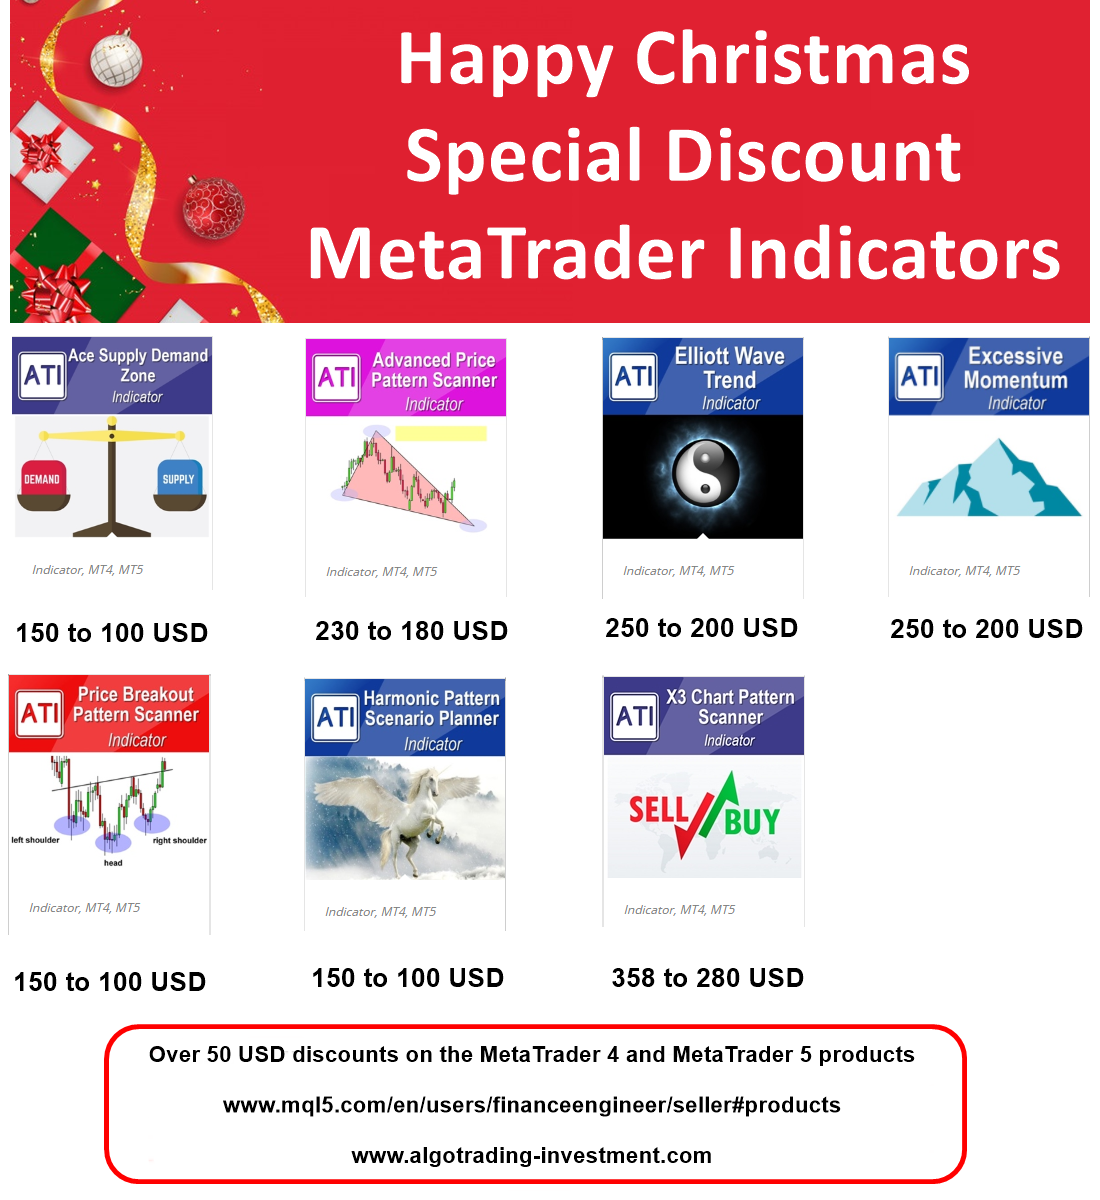
The Festive Season is a time for celebration, enjoyment, and goodwill, especially at the Christmas. However, Christmas is bound to look different this year due to the attack of the COVID 19. However, still, we can have the best Christmas this year with our family and friends. Just make sure to keep the basic guide line to be safe from the COVID 19 during this Festive Season.
By the way, in this Christmas, we will provide over 50 dollar direct discounts on the following MetaTrader 4 and MetaTrader 5 products on mql5.com. Make sure that you get these MetaTrader indicators and scanners before they go back to the original price.
Ace Supply Demand Zone indicator (150 to 100 dollar)
Advanced Price Pattern Scanner (230 to 180 dollar)
Elliott Wave Trend (250 to 200 dollar)
Price Breakout Pattern Scanner (150 to 100 dollar)
Harmonic Pattern Scenario Planner (150 to 100 dollar)
X3 Chart Pattern Scanner (358 to 280 dollar)
Excessive Momentum Indicator (250 to 200 dollar)
For your information, above price does not include 20% VAT. The discounted MetaTrader products are available from the link below:
https://www.mql5.com/en/users/financeengineer/seller#products
https://www.algotrading-investment.com/
The Festive Season is a time for celebration, enjoyment, and goodwill, especially at the Christmas. However, Christmas is bound to look different this year due to the attack of the COVID 19. However, still, we can have the best Christmas this year with our family and friends. Just make sure to keep the basic guide line to be safe from the COVID 19 during this Festive Season.
By the way, in this Christmas, we will provide over 50 dollar direct discounts on the following MetaTrader 4 and MetaTrader 5 products on mql5.com. Make sure that you get these MetaTrader indicators and scanners before they go back to the original price.
Ace Supply Demand Zone indicator (150 to 100 dollar)
Advanced Price Pattern Scanner (230 to 180 dollar)
Elliott Wave Trend (250 to 200 dollar)
Price Breakout Pattern Scanner (150 to 100 dollar)
Harmonic Pattern Scenario Planner (150 to 100 dollar)
X3 Chart Pattern Scanner (358 to 280 dollar)
Excessive Momentum Indicator (250 to 200 dollar)
For your information, above price does not include 20% VAT. The discounted MetaTrader products are available from the link below:
https://www.mql5.com/en/users/financeengineer/seller#products
https://www.algotrading-investment.com/

Young Ho Seo

Scan Supply Demand Zone Across All Timeframe
In Ace Supply Demand Zone indicator, you can scan the supply and demand zone across all timeframe for your Forex trading. This is a powerful feature included in Ace Supply Demand Zone indicator. Controlling the Multiple Timeframe scanning is similar to our other MetaTrader products like Harmonic Pattern Plus or X3 Chart Pattern Scanner. You can control them from the inputs under the Multiple Timeframe Scanning. With the inputs, you can enable or disable multiple timeframe scanning. You can also choose to switch on or off specific timeframe from your dashboard. In addition, you can also control how frequently the indicator should scan. The default value for update frequency is M5 timeframe. However, you can use M1 for update frequency if you need to scan them more frequently.
If you enabled email or push notification in the inputs under General Setting, then you can also receive the alert for the detected supply and demand zone as well as the touched supply and demand zone. The thing you need to understand about multiple timeframe scanning is that it requires multiple computation too per each timeframe. The computation can be heavier up to 7 times or more when you enabled M1 to D1 timeframes. Hence, due to data loading issues, the calculation might be stuck sometimes. In that case, just click Show button to refresh all the calculation. Of course, it is possible to switch off the multiple timeframe scanning if you only want to trade one timeframe.
Ace Supply Demand Zone in MetaTrader 4 and MetaTrader 5
In addition, we provide the YouTube video for Ace Supply Demand Zone Indicator. Hence, you can watch this YouTube Video to learn the basic operation with the supply demand zone indicator.
YouTube “Supply Demand Zone Indicator”: https://youtu.be/lr0dthrU9jo
Landing page for Ace Supply Demand Zone.
https://www.mql5.com/en/market/product/40076
https://www.mql5.com/en/market/product/40075
https://algotrading-investment.com/portfolio-item/ace-supply-demand-zone/

Young Ho Seo
New Article – Trading Setup with Pattern Completion Interval for Harmonic Pattern Trading
Here is another article explaining some useful concept for your harmonic pattern trading. Of course, this is free article to improve your harmonic pattern trading.
https://algotrading-investment.com/2020/06/01/trading-setup-with-pattern-completion-interval/
In addition, you can also have an access to important free articles for your trading here.
https://algotrading-investment.com/2019/07/23/trading-education/
You can watch the YouTube Video to feel what is the automated harmonic pattern indicator like. For your information, we provides two YouTube videos with title and links below.
YouTube “Harmonic Pattern Indicator”: https://youtu.be/CzYUwk5qeCk
YouTube “Non Repainting Non Lagging Harmonic Pattern Indicator”: https://youtu.be/uMlmMquefGQ
Harmonic Pattern Plus (and also Harmonic Pattern Scenario Planner) is the repainting but non lagging Harmonic Pattern Scanner. You can get them for the affordable price. Below is links for them.
https://www.mql5.com/en/market/product/4488
https://www.mql5.com/en/market/product/4475
https://algotrading-investment.com/portfolio-item/harmonic-pattern-plus/
X3 Chart Pattern Scanner is non repainting and non lagging Harmonic Pattern and X3 pattern Scanner. Below is links for them.
https://www.mql5.com/en/market/product/41993
https://www.mql5.com/en/market/product/41992
https://algotrading-investment.com/portfolio-item/profitable-pattern-scanner/

Young Ho Seo
Glossary of Terms for Forex
M1: One minute timeframe in chart
M5: Five minute timeframe in chart
M15: Fifteen minute timeframe in chart
M30: Thirty minute timeframe in chart
H1: One hourly timeframe in chart
H4: Four hourly timeframe in chart
D1: One day timeframe in chart
W1: One week timeframe in chart
MN1: One month timeframe in chart
Artificial Intelligence: Any intelligence demonstrated by machines, in contrast to the natural intelligence displayed by humans and other animals.
Bear Market: A market in which stock prices are falling.
Bearish: Believing that a particular security, sector, or the overall market is about to fall. Opposite of bullish. “Bear” is a trader who believes the market will fall.
Bitcoin: The first global, decentralized currency.
Bull Market: A market in which stock prices are rising.
Bullish: Bullish refers to having a positive outlook on a particular security or an investment. A situation where groups of financial securities are rising.
Candlestick: A candlestick is a type of price chart used in technical analysis that displays the high, low, open, and closing prices of a security for a specific period like 1 hour, 1 day, 1 week and so on.
Commodities: Products used for commerce that are traded on a separate, authorized commodities exchange. Commodities include agricultural products and natural resources such as timber, oil and metals. Commodities are the basis for futures contracts traded on these exchanges.
Crude oil: One of the commodities traded in Forex market, with the two most popularly traded grades of oil being Brent Crude and West Texas Intermediate (WTI). Crude oil prices reflect the market’s volatile and liquid nature, as well as oil being a benchmark for global economic activity.
Dow Jones Industrial Average: The Dow Jones Industrial Average (DJIA), also known as the Dow 30, is a stock market index that tracks 30 large, publicly-owned blue-chip companies trading on the New York Stock Exchange (NYSE) and the Nasdaq. The Dow Jones is named after Charles Dow, who created the index in 1896 along with his business partner Edward Jones.
Equities: Common and preferred stocks, which represent a share in the ownership of a company.
Ethereum: A public blockchain network and decentralized software platform upon which developers build and run applications. As it is a proper noun, it should always be capitalized.
EURUSD or EUR/USD: EURUSD is the rate that euros can be exchanged for US dollars. If the rate is 1.50, it means it takes 1.5 US dollars to buy 1 Euro.
Fractal: In math, a fractal is an infinite pattern that appears similar no matter how closely you look at it. This is also called self-similarity. In layman’s terms, fractal is any curve or geometric shape for which any suitably chosen part is similar in shape to a given larger or smaller part when magnified or reduced to the same size.
Fractal Wave: Fractal or self-similar geometric structure observed in the wave form. Fractal wave is typically observed in the financial market including stock market, forex market and commodity market.
Fractal Triangle: It is the endlessly repeating triangle that represents the market cycles in Forex and Stock market. A Fractal triangle typically consists of one swing high and one swing low.
GBPUSD or GBP/USD: GBPUSD is the rate that British pounds can be exchanged for US dollars. If the rate is 1.20, it means it takes 1.2 US dollars to buy 1 British pounds.
GoldUSD or Gold/USD or XAUUSD: XAUUSD is the rate that an ounce of gold can be exchanged for US dollars. If the rate is 1200, it means it takes 1200 US dollars to buy an ounce of gold.
Rally: A brisk rise in the general price level of the market or price of a stock.
Range: The difference between the highest and lowest price of an asset during a given trading session.
Securities: Transferable certificates of ownership of investment products such as notes, bonds, stocks, futures contracts and options.
Spread: The difference between the bid and the ask prices of a stock.
S&P 500 Index: S&P 500 index is the Standard & Poor’s 500 Composite Stock Price Index, a widely recognized, unmanaged index of common stock prices. You may not invest directly in the S&P 500 Index, and, unlike the Fund, benchmark indices do not incur fees or expenses.
Swing high: Swing high refers to the rising price action from trough toward a peak.
Swing low: Swing low refers to the falling price action from a peak toward a trough.
About this Article
This article is the part taken from the draft version of the Book: Technical Analysis in Forex and Stock Market (Supply Demand Analysis and Support Resistance). Full version of the book can be found from the link below:
https://algotrading-investment.com/portfolio-item/technical-analysis-in-forex-and-stock-market/
You can also use Ace Supply Demand Zone Indicator in MetaTrader to accomplish your technical analysis. Ace Supply Demand Zone indicator is non repainting and non lagging supply demand zone indicator with a lot of powerful features built on.
https://www.mql5.com/en/market/product/40076
https://www.mql5.com/en/market/product/40075
https://algotrading-investment.com/portfolio-item/ace-supply-demand-zone/
Below is the landing page for Optimum Chart (Standalone Charting and Analytical Platform).
https://algotrading-investment.com/2019/07/23/optimum-chart/
Young Ho Seo
Harmonic Pattern – Turning Point and Trend
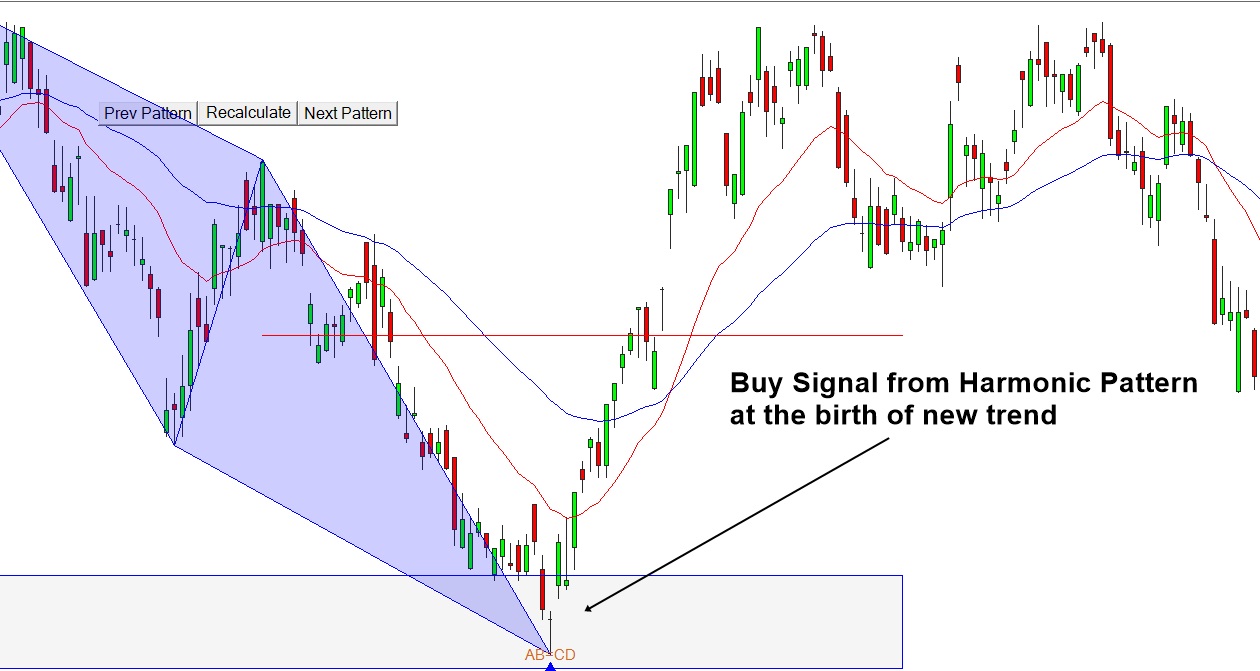
This article “Turning Point and Trend” tries to answer you on when to use Harmonic Pattern Trading in terms of the four market cycle including Birth, Growth, Maturity and Death. If you want to become profitable trader, then you need to decide when your capital to dive into the market. The best way is doing it with the market rhythm, i.e. the market cycle. This article will provide you the clear answer on how to tune your entry with the market. This is the first step for any trader in choosing their strategy in fact. You would also revise the pros and cons of the turning point strategy, semi turning point strategy and trend strategy.
https://algotrading-investment.com/2019/07/06/turning-point-and-trend/
Below are the list of automated Harmonic pattern Indicator developed for MetaTrader 4 and MetaTrader 5 platform.
Harmonic Pattern Plus
One of the first automated Harmonic Pattern detection tool released in 2014. It can detect 11 most popular harmonic patterns with well-defined trading entries and stops. Pattern Completion Interval, Potential Reversal Zone and Potential Continuation Zone are supported. In addition, other dozens of powerful features are added like Japanese candlestick detection, etc. Because of affordable price, this harmonic pattern detection indicator is loved by many traders. Please note that this is repainting and non lagging harmonic pattern trading system.
https://www.mql5.com/en/market/product/4488
https://www.mql5.com/en/market/product/4475
https://algotrading-investment.com/portfolio-item/harmonic-pattern-plus/
Harmonic Pattern Scenario planner
It is an advanced Harmonic Pattern indicator. On top of the features of Harmonic Pattern Plus, you can also predict future harmonic patterns through simulation. This is the tactical harmonic pattern tool designed for Professional harmonic pattern trader. Because of affordable price, this harmonic pattern detection indicator is loved by many traders. Please note that this is repainting and non lagging harmonic pattern trading system.
https://www.mql5.com/en/market/product/6240
https://www.mql5.com/en/market/product/6101
https://algotrading-investment.com/portfolio-item/harmonic-pattern-scenario-planner/
Both Harmonic pattern plus and Harmonic Pattern Scenario planner are the excellent trading system at affordable cost. However, if you do not like repainting Harmonic pattern indicator, then we also provide the non repainting and non lagging harmonic pattern trading. Just check the X3 Chart Pattern Scanner below.
Link to X3 Chart Pattern Scanner
https://www.mql5.com/en/market/product/41993
https://www.mql5.com/en/market/product/41992
https://algotrading-investment.com/portfolio-item/profitable-pattern-scanner/

Young Ho Seo
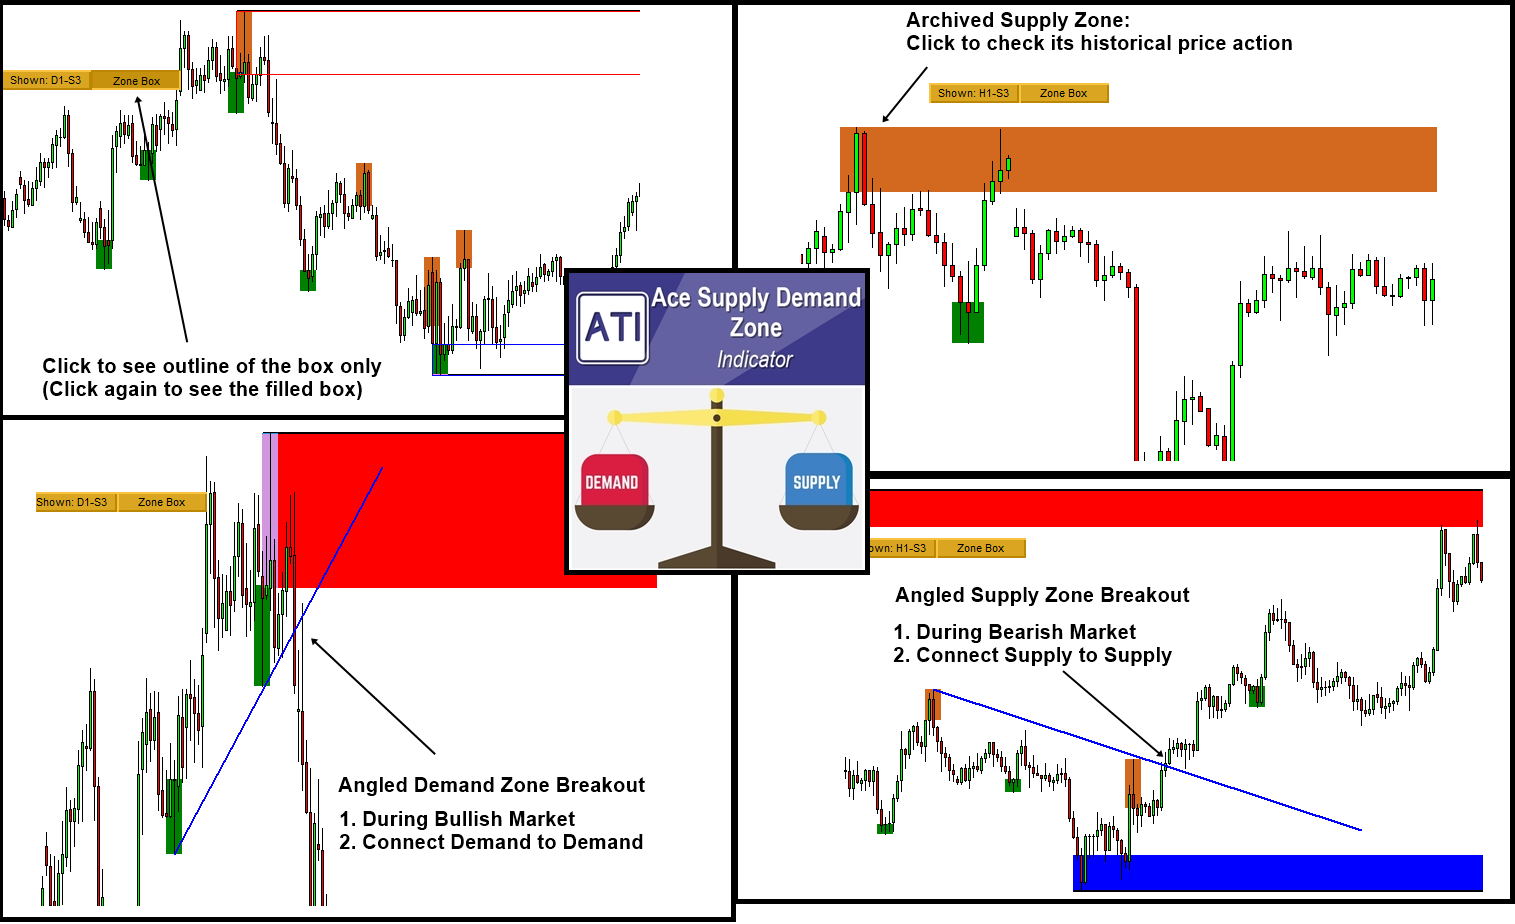
MT4 Supply Demand Zone Indicator
MetaTrader 4 is one of the most popular trading platform since 2010. It is accessible for free of charge for any trader from all over the world. We provide a range of powerful supply demand zone indicator particularly designed for MetaTrader 4 platform.
Here is the list of Advanced Supply Demand Zone Indicator. These supply and demand zone indicators are rich in features with many powerful features to help you to trade the right supply and demand zone to trading.
MT4 – Mean Reversion Supply Demand
Mean Reversion Supply Demand indicator is our earliest supply demand zone indicator and loved by many trader all over the world. It is great to trade with reversal and breakout. You can also fully setup your trading with stop loss and take profit target.
Below are the links to MT4 version of the Mean Reversion Supply Demand indicator.
https://www.mql5.com/en/market/product/16851
https://algotrading-investment.com/portfolio-item/mean-reversion-supply-demand
MT4 – Ace Supply Demand Zone Indicator
Ace Supply Demand Zone indicator is our next generation supply demand zone indicator. It was built in non repainting and non lagging algorithm. On top of many powerful features, you can also make use of archived supply and demand zone in your trading to find more accurate trading opportunity.
Below are the links to MT4 version of the Ace Supply Demand Zone indicator.
https://www.mql5.com/en/market/product/40076
https://algotrading-investment.com/portfolio-item/ace-supply-demand-zone
In addition, we provide the YouTube video for Ace Supply Demand Zone Indicator. In terms of indicator operation, both mean reversion supply demand and ace supply demand zone indicator are similar. Hence, you can watch this YouTube Video to accomplish the supply demand zone indicator.
YouTube “Supply Demand Zone Indicator”: https://youtu.be/lr0dthrU9jo
For your information, both indicators provides many powerful features to complete for your trading. You can also use this indicators together with Harmonic pattern and Elliott wave pattern indicators.

Young Ho Seo

New Article –Rolling Ball Effect and Harmonic Pattern Trading
Rolling ball effect is something you must understand for your reversal trading. Especially, if you are interested in harmonic pattern trading or elliott wave trading or rising wedge or falling wedge patterns, then this is a must understand concept before using them in practice. You can save tons of money in trading by reading this simple article.
Read entire free article from below link:
https://algotrading-investment.com/2020/06/01/rolling-ball-effect-and-harmonic-pattern-trading/
In addition, you can also have an access to important free articles for your trading here.
https://algotrading-investment.com/2019/07/23/trading-education/
You can watch the YouTube Video to feel what is the automated harmonic pattern indicator like. For your information, we provides two YouTube videos with title and links below.
YouTube “Harmonic Pattern Indicator”: https://youtu.be/CzYUwk5qeCk
YouTube “Non Repainting Non Lagging Harmonic Pattern Indicator”: https://youtu.be/uMlmMquefGQ
In addition, here is the landing page for two harmonic pattern scanner available in MetaTrader 4 and MetaTrader 5 platform in regards to above YouTube video. First one is harmonic pattern plus and the second one is the X3 Chart Pattern Scanner.
Harmonic Pattern Plus (and also Harmonic Pattern Scenario Planner) is the powerful harmonic pattern indicator at affordable cost with tons of advanced features. Harmonic Pattern Plus (and also Harmonic Pattern Scenario Planner) is the repainting but non lagging Harmonic Pattern Scanner. Below is links for Harmonic Pattern Plus.
https://www.mql5.com/en/market/product/4488
https://www.mql5.com/en/market/product/4475
https://algotrading-investment.com/portfolio-item/harmonic-pattern-plus/
X3 Chart Pattern Scanner is non repainting and non lagging Harmonic Pattern and X3 pattern Scanner. X3 Chart Pattern Scanner is the most advanced Harmonic Pattern and X3 Price Pattern Scanner. In addition, X3 Chart Pattern Scanner is built in with 52 Japanese Candlestick patterns + advanced Channel. Below is links for X3 Chart Pattern Scanner.
https://www.mql5.com/en/market/product/41993
https://www.mql5.com/en/market/product/41992
https://algotrading-investment.com/portfolio-item/profitable-pattern-scanner/

Young Ho Seo
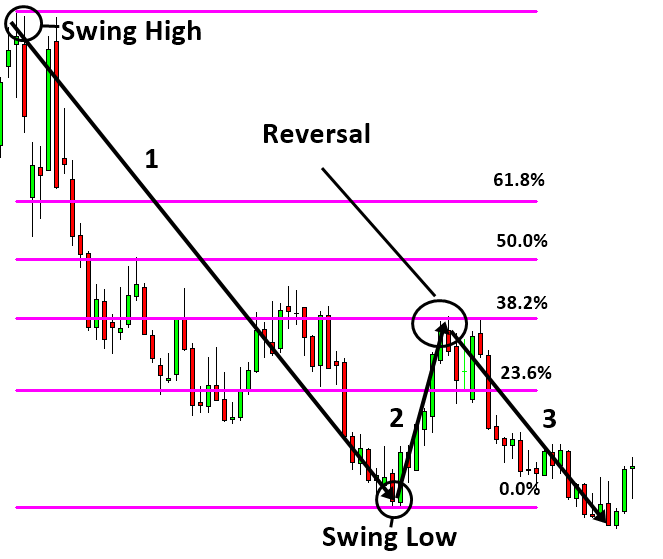
New Article –Introduction to Technical Analysis
Designing a successful strategy is an intellectually challenging process. It requires extensive research and testing. The research in trading is always followed by the immediate real world outcome. The trading strategy based on the bad system or methodology will be falsified extremely fast in the real world trading. Naturally, a trader with the scientific mind set can learn the great deal of knowledge about this world from testing various trading methodology with the financial market. Science or scientific methodology plays an important role in trading and investment.
Read entire free article from below link:
https://algotrading-investment.com/2020/06/02/introduction-to-technical-analysis/
In addition, you can also have an access to important free articles for your trading here.
https://algotrading-investment.com/2019/07/23/trading-education/
In addition, you can watch this short YouTube Video titled as “Fractal to Advanced Technical Analysis in Less than 6 minutes” to accomplish the complete understanding of your technical analysis. Below is the link the YouTube video.
YouTube link: https://youtu.be/RiTsWthvxfA
In addition, here is the several technical analysis indicator you might be interested in.
1. Elliott Wave Trend for MetaTrader 4
Elliott Wave Trend is extremely powerful Elliott wave indicator. This indicator allows you to perform Elliott wave counting as well as Elliott wave pattern detection. All these are the essential steps in predicting market with Elliott Wave theory. On top of them, it provides built in support and resistance system and turning point strength indicator to improve your trading performance. Yet, there are many additional features for you to explorer inside this technical indicator.
https://www.mql5.com/en/market/product/16479
https://algotrading-investment.com/portfolio-item/elliott-wave-trend/
2. X3 Chart Pattern Scanner for MetaTrader 4
X3 Chart Pattern Scanner is not exclusively Elliott wave tool but it contains some Elliott Wave pattern features in it. Primarily, X3 Chart Pattern Scanner is specialized tools in detecting the chart patterns including Fibonacci Price Pattern, Harmonic Pattern and Elliott Wave Patterns. It is great tool if you want to use both Harmonic Pattern and Elliott Wave patterns in one tool. The added bonus is that X3 Chart Patterns scanner is capable to detect around 52 Japanese candle stick patterns and advanced channels.
https://www.mql5.com/en/market/product/41993
https://algotrading-investment.com/portfolio-item/profitable-pattern-scanner/
In summary, both tools are the high performance trading system. However, if you want to use Elliott wave trading exclusively and you understand the Wave principle, then you should go for Elliott Wave trend. If you do not mind both Elliott Wave and Harmonic Pattern Trading, then you should use Profitable Pattern Scanner.

Young Ho Seo
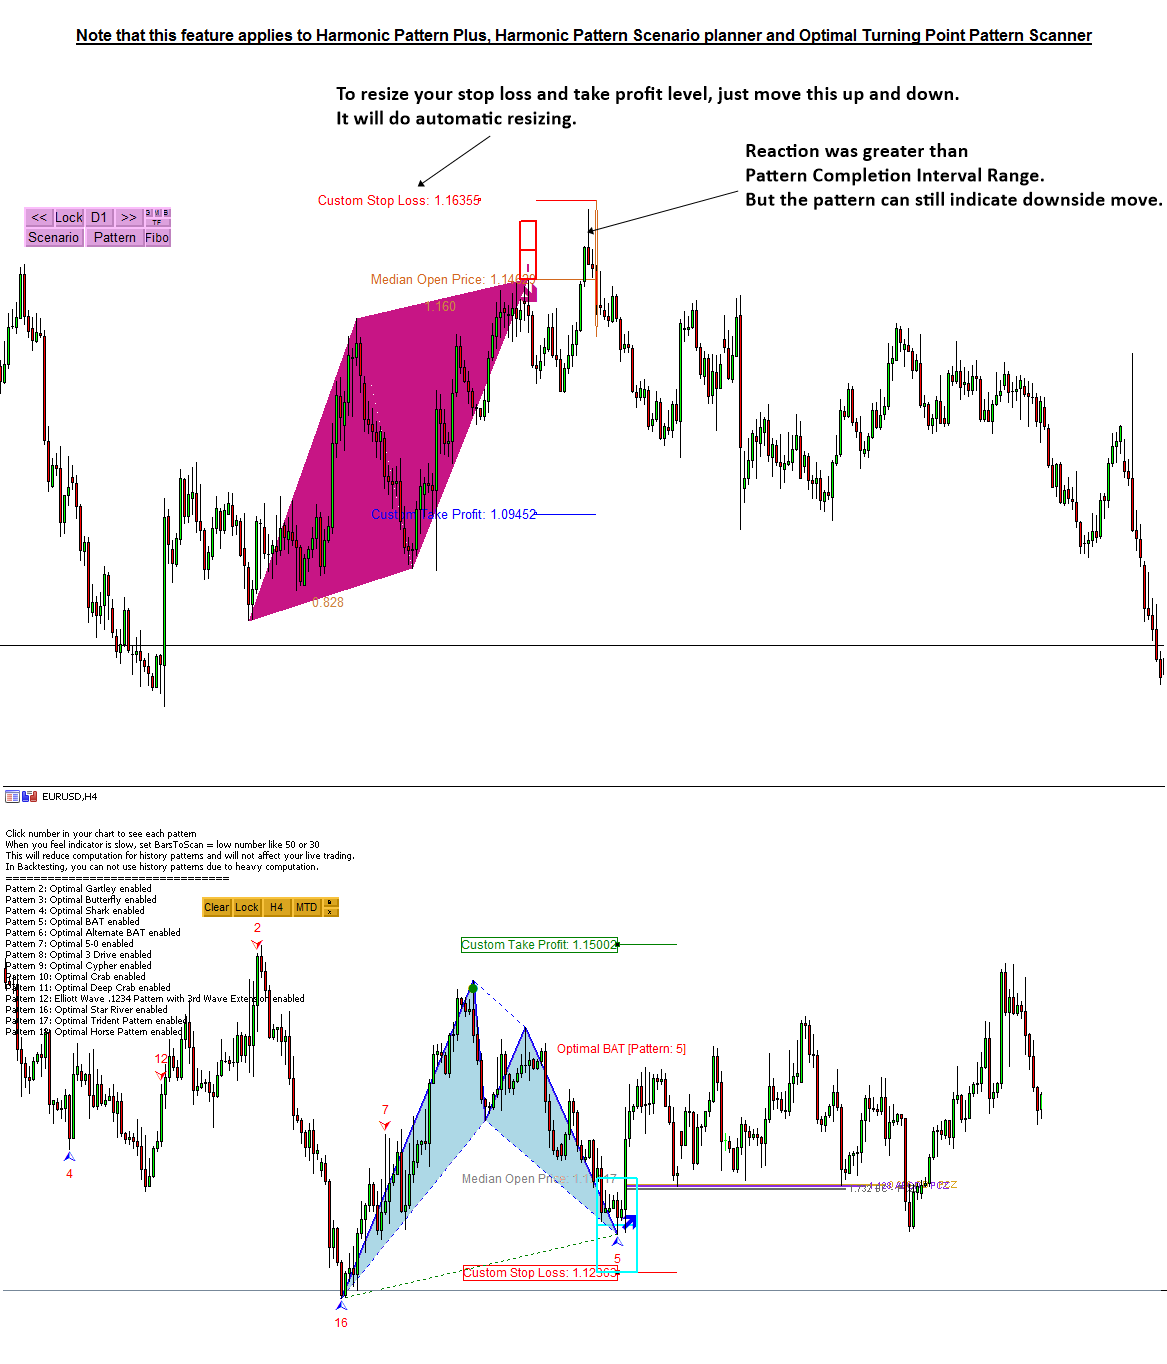
Automatic Resizing your Stop Loss and Take Profit Level with Harmonic Pattern Plus (Harmonic Pattern Scenario Planner)
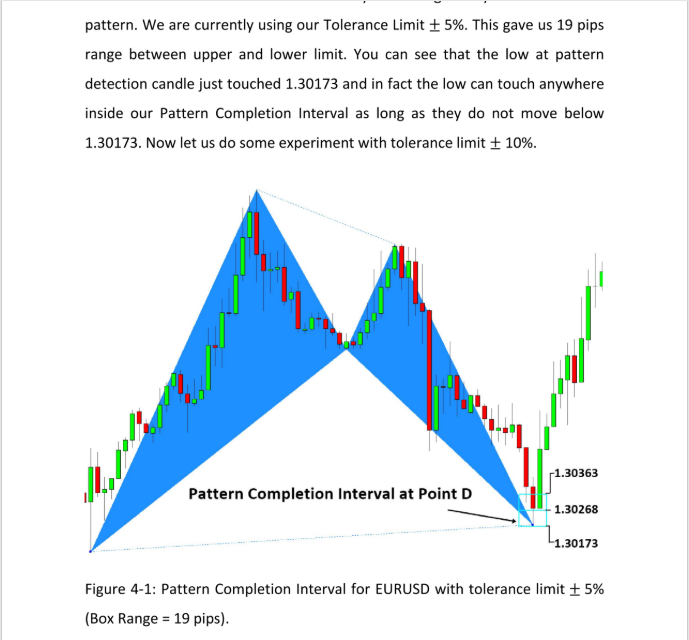
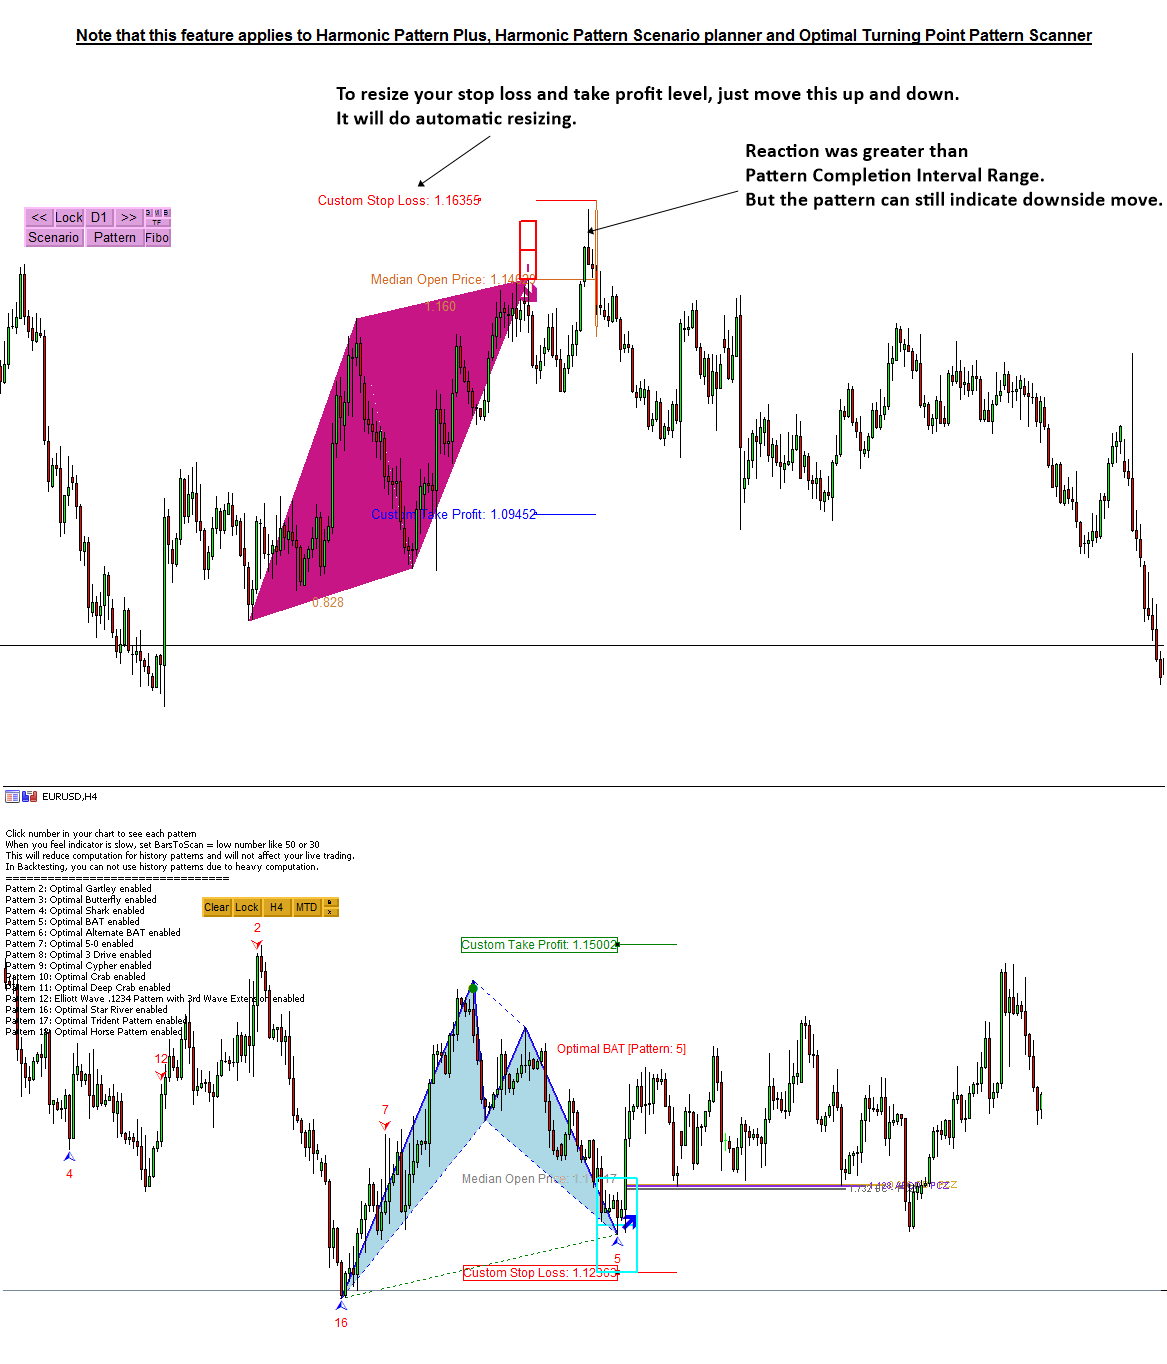
Having understood all the concept behind the Pattern Completion Interval, you might observe that sometime price can react outside the pattern completion interval. Sure, there is nothing perfect in the world. As long as you understand the pros and cons of using large stop loss size, it is still fine to control your own stop loss size.
However, we still prefer to express stop loss size in terms of pattern completion interval range for convenience. For example, if the original stop loss size was equal to 1 x pattern completion interval, you can certainly use 1.5 x pattern completion interval or 2 x pattern completion interval.
Another consideration before you are using pattern completion interval, if you can enter the market at the competitive price, then you can feel less guilty when you increase your stop loss size because you are still remaining good rewards/Risk ratio. On the other hands, if you have entered market at not so competitive price, then you might be cautious when you increase your stop loss size.
The same feature applies to X3 Chart Pattern Scanner (Non Repainting and Non Lagging Harmonic Pattern and Elliott Wave pattern scanner.)
In addition, you can watch the YouTube Video titled feel what is the automated harmonic pattern indicator like. For your information, we provides two YouTube videos with title and links below.
YouTube “Harmonic Pattern Indicator”: https://youtu.be/CzYUwk5qeCk
YouTube “Non Repainting Non Lagging Harmonic Pattern Indicator”: https://youtu.be/uMlmMquefGQ
Harmonic Pattern Plus
https://www.mql5.com/en/market/product/4488
https://www.mql5.com/en/market/product/4475
https://algotrading-investment.com/portfolio-item/harmonic-pattern-plus/
Harmonic Pattern Scenario Planner
https://www.mql5.com/en/market/product/6101
https://www.mql5.com/en/market/product/6240
https://algotrading-investment.com/portfolio-item/harmonic-pattern-scenario-planner/
X3 Chart Pattern Scanner
https://www.mql5.com/en/market/product/41993
https://www.mql5.com/en/market/product/41992
https://algotrading-investment.com/portfolio-item/profitable-pattern-scanner/

Young Ho Seo
Applying Turing Point Prediction in Forex Market
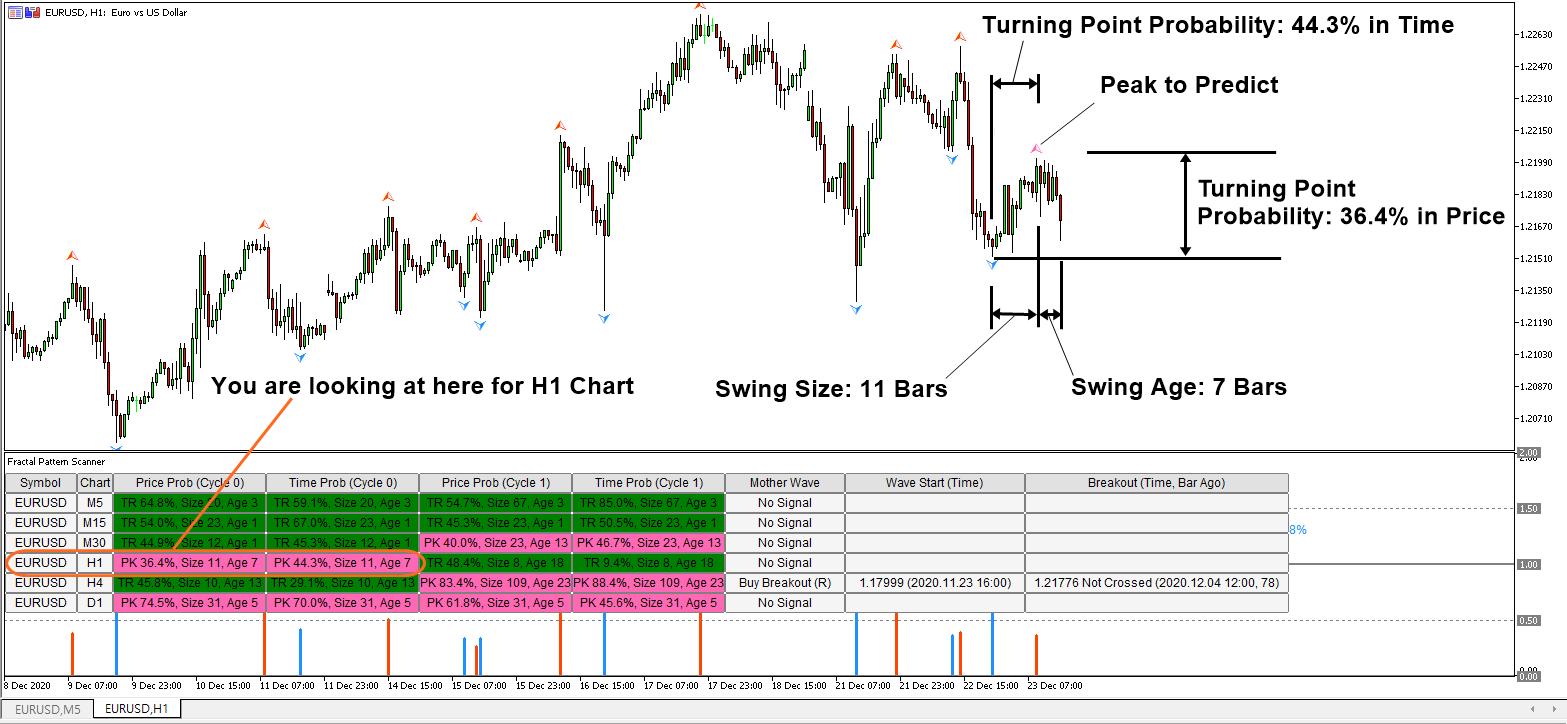
In this article, we provide an explanation on how to apply the turning point prediction in Forex Market. Here we will be using Swing Size and Swing Age variable to identify the turning point probability for each price swing.
Swing Age is the count of candle bars from latest bar to the swing right end.
Swing Size is the count of candle bars from the swing right end to swing left end
As these two variable provides you the relative coordinate of the right end and left end of the price swing, you can locate the turning point value for each price swing. Check the screenshot to clarify your understanding.
In terms of application, the turning point prediction is useful as it quantifies your risk for trading between 0.0 and 1.0 (or 100%). Quantification in your trading is always good because you have something to stick as a guidance for your trading. When you do not have the guidance, you will often find that your emotion will ruin your trading.
There are two basic concepts in regards to the probability and some advanced concepts in regards to Mother Wave and Child Wave. For your own good, everyone should understand the basic concepts if you want to improve your trading performance in long run.
In the first basic concept, if the price reaches the turning point probability above 0.7 (or 70%), in this turning point probability range, you can look for the potential reversal opportunity. In another words, it is the good point to detect the directional change in the market. It could be either correction or global turning point.
In the second basic concept, if the price reaches the turning point probability between 0.0 and 0.5 (or 50%), you can find the good breakout opportunity. In another words, it is the good point to detect the continuation in the price movement. We will omit the advanced concepts here as it was already explained elsewhere.
If you do not have an access to the Turning Point Prediction, then it is fine as we provide the Turning Point Prediction for Forex Market for free. Anyone can access the standard turning point prediction for your day trading for free of charge from the link below.
https://algotrading-investment.com/2020/10/23/price-prediction-for-day-trading/
At the same time, if you want to have the scanner for the MetaTrader 4 or MetaTrader 5, here is the links to Fractal Pattern Scanner. In Fractal Pattern Scanner, you can access the turning point probability scanner + mother wave breakout signals, reversal signals, and many more advanced features.
https://www.mql5.com/en/market/product/49170
https://www.mql5.com/en/market/product/49169
https://algotrading-investment.com/portfolio-item/fractal-pattern-scanner/

: