Young Ho Seo / Perfil
- Informações
|
10+ anos
experiência
|
62
produtos
|
1182
versão demo
|
|
4
trabalhos
|
0
sinais
|
0
assinantes
|
Harmonic Pattern Indicator - Repainting + Japanese Candlestick Pattern Scanner + Automatic Channel + Many more
https://www.mql5.com/en/market/product/4488
https://www.mql5.com/en/market/product/4475
https://algotrading-investment.com/portfolio-item/harmonic-pattern-plus/
Non Repainting and Non Lagging Harmonic Pattern Indicator – Customizable Harmonic + Japanese Candlestic Pattern Scanner + Advanced Channel + Many more
https://www.mql5.com/en/market/product/41993
https://www.mql5.com/en/market/product/41992
https://algotrading-investment.com/portfolio-item/profitable-pattern-scanner/
Supply Demand Indicator – Multiple Timeframe Scanning Added + Non Repainting + Professional Indicator
https://www.mql5.com/en/market/product/40076
https://www.mql5.com/en/market/product/40075
https://algotrading-investment.com/portfolio-item/ace-supply-demand-zone/
Momentum Indicator – Path to Volume Spread Analysis
https://www.mql5.com/en/market/product/30641
https://www.mql5.com/en/market/product/30621
https://algotrading-investment.com/portfolio-item/excessive-momentum-indicator/
Elliott Wave Indicator for the Power User
https://www.mql5.com/en/market/product/16479
https://www.mql5.com/en/market/product/16472
https://algotrading-investment.com/portfolio-item/elliott-wave-trend/
Forex Prediction - Turn Support and Resistance to the Advanced Strategy
https://www.mql5.com/en/market/product/49170
https://www.mql5.com/en/market/product/49169
https://algotrading-investment.com/portfolio-item/fractal-pattern-scanner/
MetaTrader 4 and MetaTrader 5 Product Page: https://www.mql5.com/en/users/financeengineer/seller#products
Free Forex Prediction with Fibonacci Analysis: https://algotrading-investment.com/2020/10/23/forex-prediction-with-fibonacci-analysis/
Free Harmonic Pattern Signal: https://algotrading-investment.com/2020/12/17/harmonic-pattern-signal-for-forex-market/
============================================================================================================================
Here are the trading education books. We recommend reading these books if you are a trader or investor in Forex and Stock market. In the list below, we put the easy to read book on top. Try to read the easy to read book first and try to read the harder book later to improve your trading and investment.
First Link = amazon.com, Second Link = Google Play Books, Third Link = algotrading-investment.com, Fourth Link = Google Books
Technical Analysis in Forex and Stock Market (Supply Demand Analysis and Support Resistance)
https://www.amazon.com/dp/B09L55ZK4Z
https://play.google.com/store/books/details?id=pHlMEAAAQBAJ
https://algotrading-investment.com/portfolio-item/technical-analysis-in-forex-and-stock-market/
https://books.google.co.kr/books/about?id=pHlMEAAAQBAJ
Science Of Support, Resistance, Fibonacci Analysis, Harmonic Pattern, Elliott Wave and X3 Chart Pattern (In Forex and Stock Market Trading)
https://www.amazon.com/dp/B0993WZGZD
https://play.google.com/store/books/details?id=MME3EAAAQBAJ
https://algotrading-investment.com/portfolio-item/science-of-support-resistance-fibonacci-analysis-harmonic-pattern/
https://books.google.co.kr/books/about?id=MME3EAAAQBAJ
Profitable Chart Patterns in Forex and Stock Market (Fibonacci Analysis, Harmonic Pattern, Elliott Wave, and X3 Chart Pattern)
https://www.amazon.com/dp/B0B2KZH87K
https://play.google.com/store/books/details?id=7KrQDwAAQBAJ
https://algotrading-investment.com/portfolio-item/profitable-chart-patterns-in-forex-and-stock-market/
https://books.google.com/books/about?id=7KrQDwAAQBAJ
Guide to Precision Harmonic Pattern Trading (Mastering Turning Point Strategy for Financial Trading)
https://www.amazon.com/dp/B01MRI5LY6
https://play.google.com/store/books/details?id=8SbMDwAAQBAJ
http://algotrading-investment.com/portfolio-item/guide-precision-harmonic-pattern-trading/
https://books.google.com/books/about?id=8SbMDwAAQBAJ
Scientific Guide to Price Action and Pattern Trading (Wisdom of Trend, Cycle, and Fractal Wave)
https://www.amazon.com/dp/B073T3ZMBR
https://play.google.com/store/books/details?id=5prUDwAAQBAJ
https://algotrading-investment.com/portfolio-item/scientific-guide-to-price-action-and-pattern-trading/
https://books.google.com/books/about?id=5prUDwAAQBAJ
Predicting Forex and Stock Market with Fractal Pattern: Science of Price and Time
https://www.amazon.com/dp/B086YKM8BW
https://play.google.com/store/books/details?id=VJjiDwAAQBAJ
https://algotrading-investment.com/portfolio-item/predicting-forex-and-stock-market-with-fractal-pattern/
https://books.google.com/books/about?id=VJjiDwAAQBAJ
Trading Education Book 1 in Korean (Apple, Google Play Book, Google Book, Scribd, Kobo)
https://books.apple.com/us/book/id1565534211
https://play.google.com/store/books/details?id=HTgqEAAAQBAJ
https://books.google.co.kr/books/about?id=HTgqEAAAQBAJ
https://www.scribd.com/book/505583892
https://www.kobo.com/ww/en/ebook/8J-Eg58EDzKwlpUmADdp2g
Trading Education Book 2 in Korean (Apple, Google Play Book, Google Book, Scribd, Kobo)
https://books.apple.com/us/book/id1597112108
https://play.google.com/store/books/details?id=shRQEAAAQBAJ
https://books.google.co.kr/books/about?id=shRQEAAAQBAJ
https://www.scribd.com/book/542068528
https://www.kobo.com/ww/en/ebook/X8SmJdYCtDasOfQ1LQpCtg
About Young Ho Seo
Young Ho Seo is an Engineer, Financial Trader, and Quantitative Developer, working on Trading Science and Investment Engineering since 2011. He is the creator of many technical indicators, price patterns and trading strategies used in the financial market. He is also teaching the trading practice on how to use the Supply Demand Analysis, Support, Resistance, Trend line, Fibonacci Analysis, Harmonic Pattern, Elliott Wave Theory, Chart Patterns, and Probability for Forex and Stock Market. His works include developing scientific trading principle and mathematical algorithm in the work of Benjamin Graham, Everette S. Gardner, Benoit Mandelbrot, Ralph Nelson Elliott, Harold M. Gartley, Richard Shabacker, William Delbert Gann, Richard Wyckoff and Richard Dennis. You can find his dedicated works on www.algotrading-investment.com . His life mission is to connect financial traders and scientific community for better understanding of this world and crowd behaviour in the financial market. He wrote many books and articles, which are helpful for understanding the technology and application behind technical analysis, statistics, time series forecasting, fractal science, econometrics, and artificial intelligence in the financial market.
If you are interested in our software and training, just visit our main website: www.algotrading-investment.com
Young Ho Seo
DAX Market Outlook
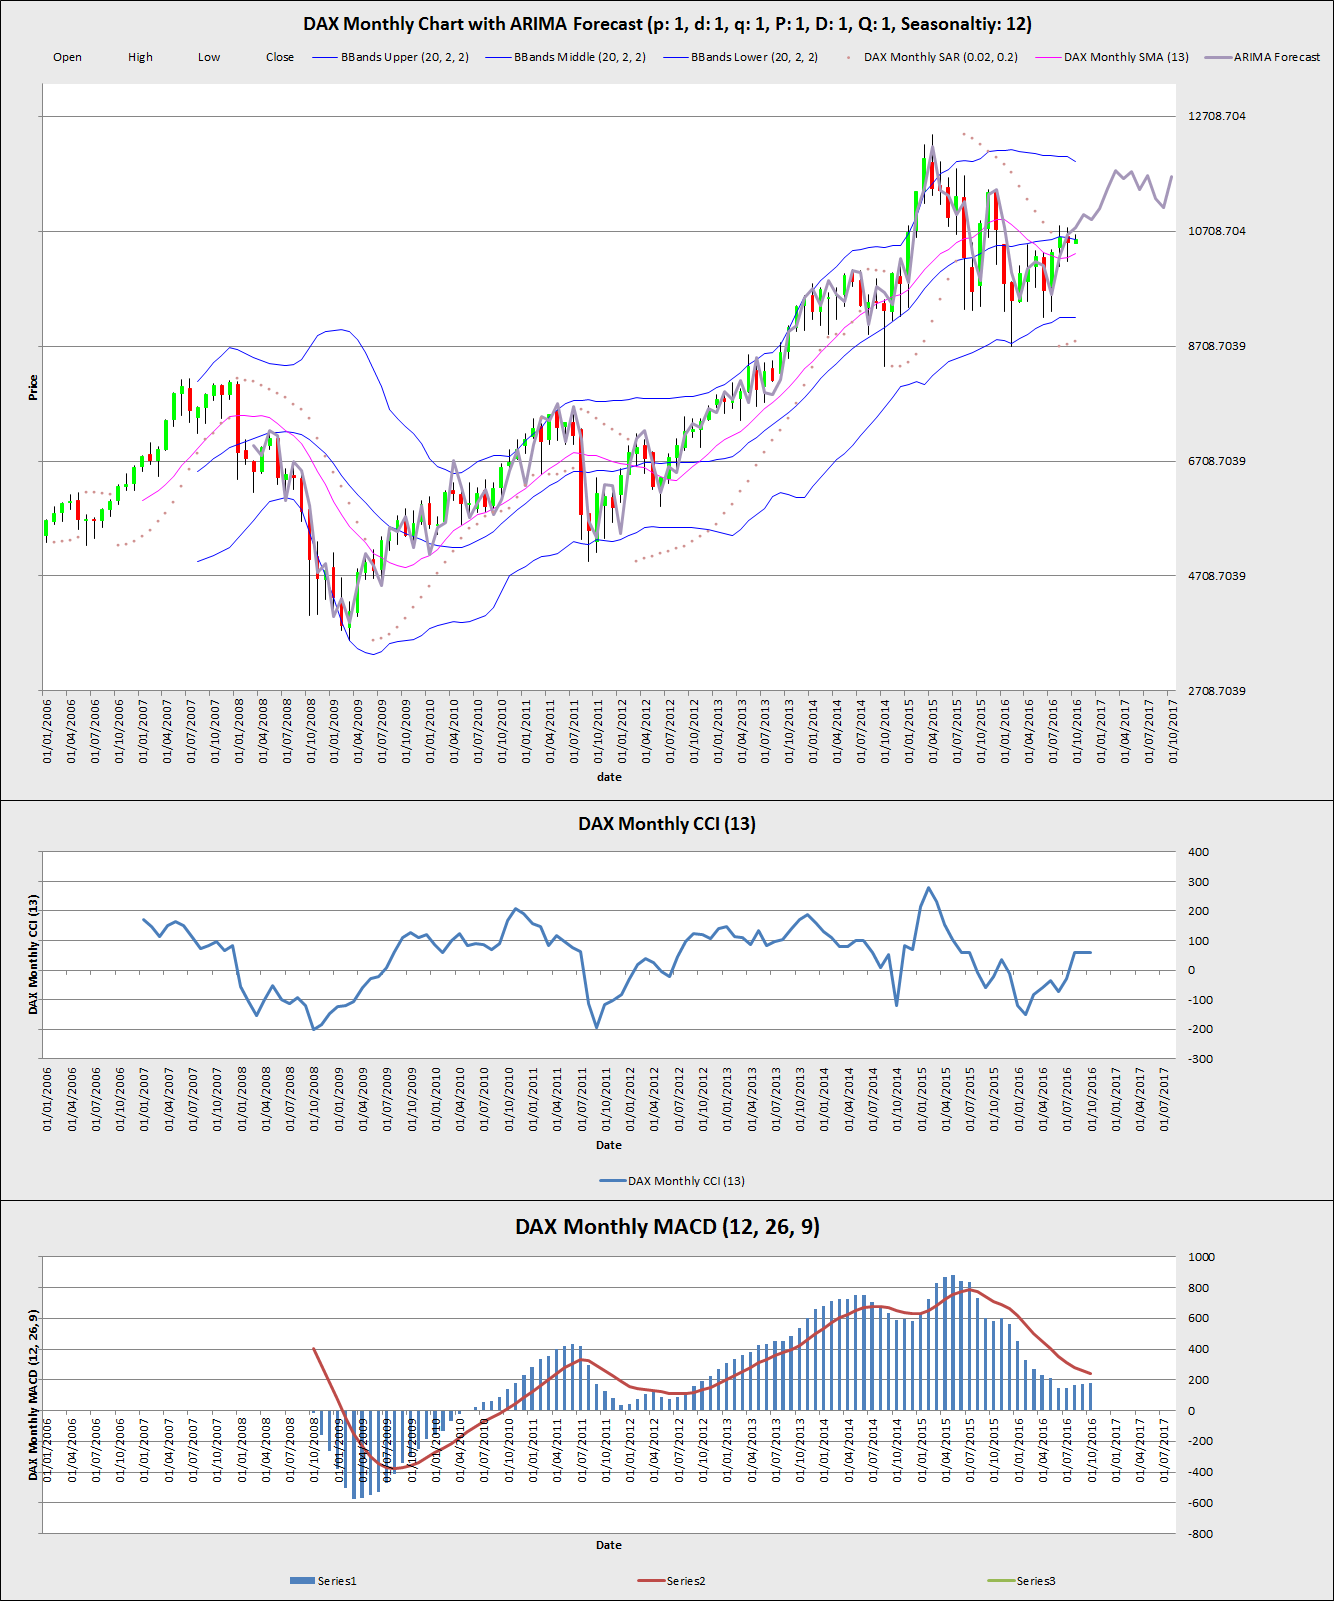
We have performed some interesting analysis combining technical analysis with ARIMA forecasting on Monthly DAX data.
We use ARIMA Forecast (p: 1, d: 1, q: 1, P: 1, D: 1, Q: 1, Seasonality: 12)
http://algotrading-investment.com/
https://algotradinginvestment.wordpress.com/2016/10/07/dax-market-outlook/
Open : 10492.96973
High : 10646.71973
Low : 10486.62988
Close : 10568.79981
BBands Upper (20, 2, 2) : 11915.45991
BBands Middle (20, 2, 2) : 10561.72202
BBands Lower (20, 2, 2) : 9207.984129
SAR (0.02, 0.2) : 8782.570038
SMA (13) : 10325.09307
CCI (13) : 59.92498024
MACD (12, 26, 9) : 181.4765802
MACD Signal (12, 26, 9) : 243.8597325

Young Ho Seo


EURUSD Market Outlook
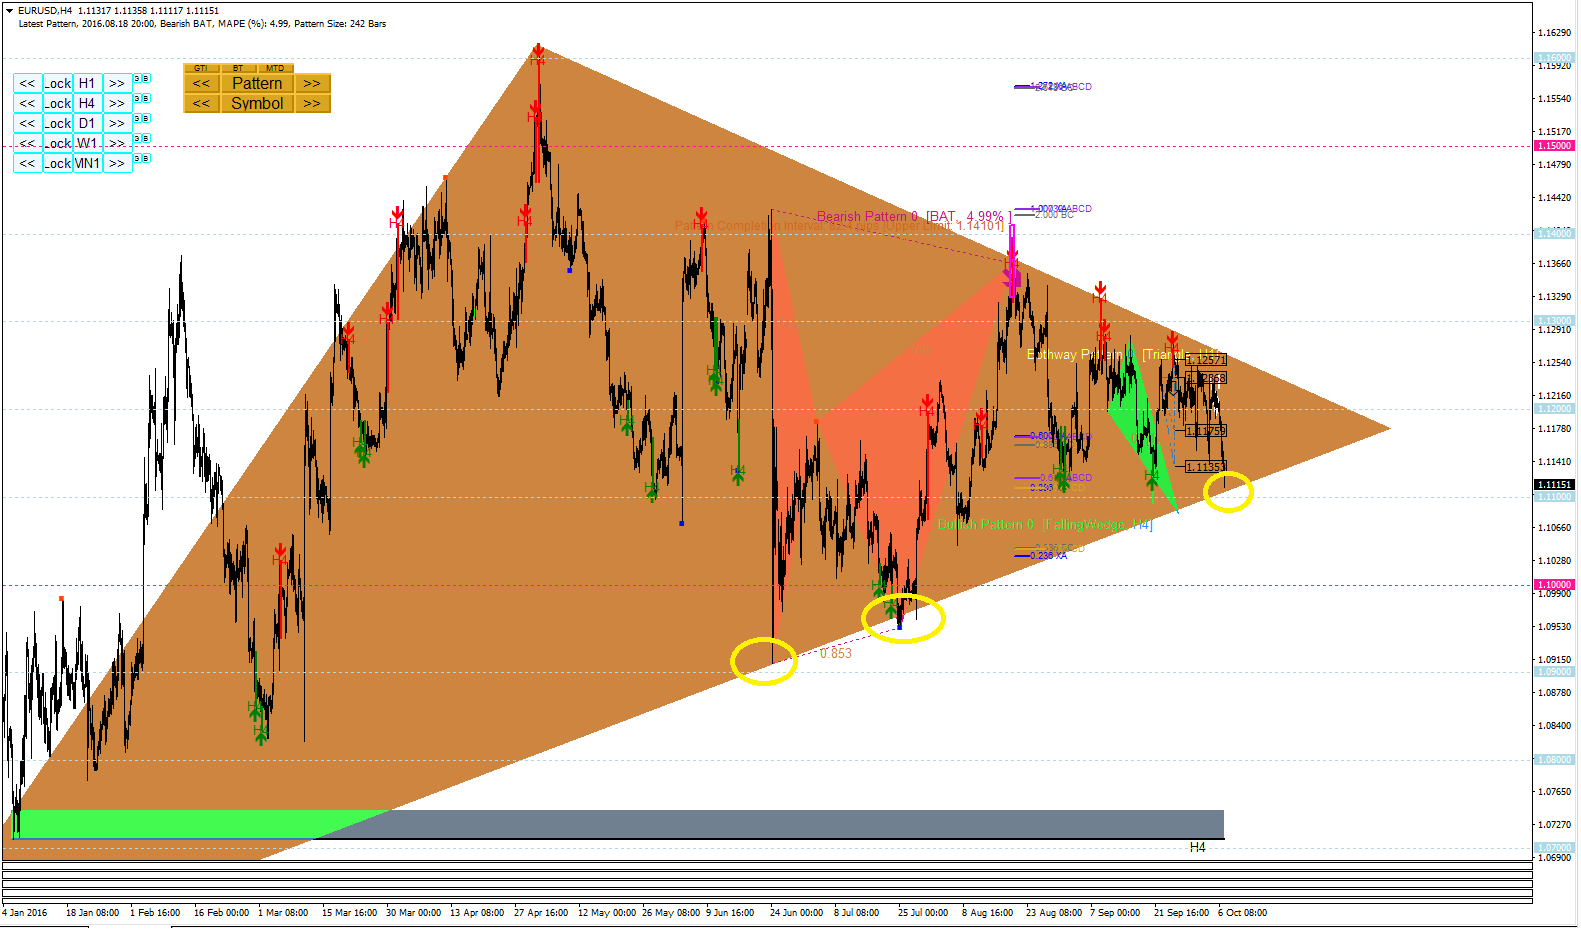
EURUSD certainly took some impact from GBPUSD spike. Our price breakout pattern scanner detected quite crucial support. Please see attached screenshot. We have marked with yellow circle for your convenience.
EURUSD is currently approaching to the intersection quite fast. Make sure that you are watching out this important support we have marked by yellow circle.
We only warned this since many traders might be exhausted from GBPUSD spike event and they might have no capacity for further logical analysis for their trading. Use this information at your own risk please.
Our software and tools are always there to help your trading.
http://algotrading-investment.com/portfolio-item/price-breakout-pattern-scanner/

Young Ho Seo
GBPUSD Market Outlook
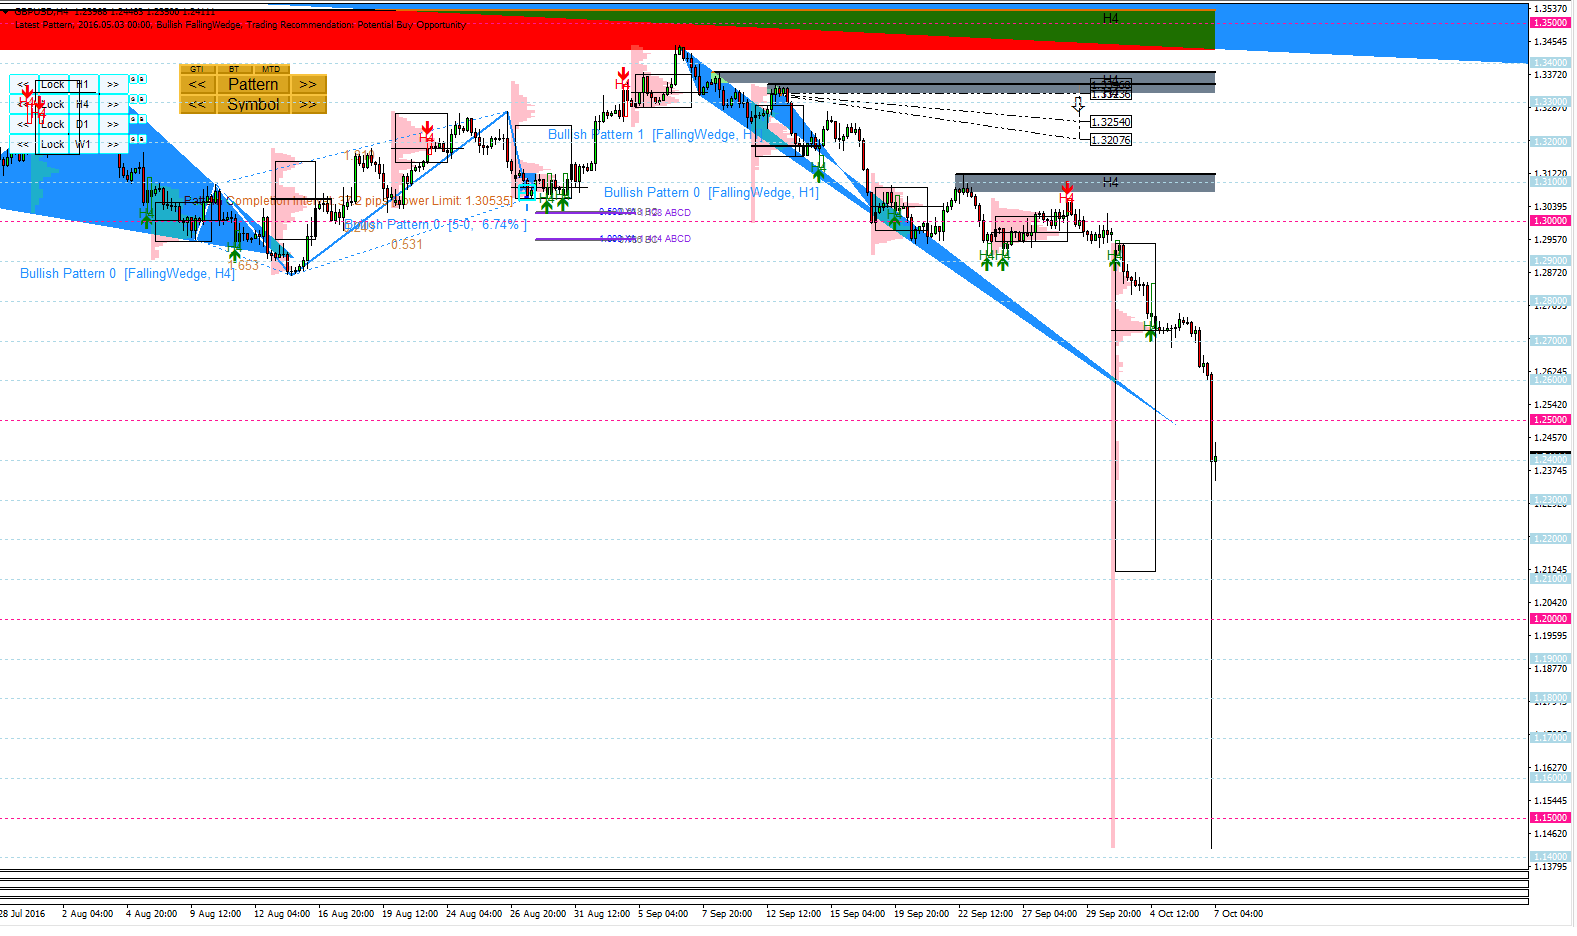
Another insane movement in GBPUSD. This seems as bad as Swiss franc shock 2015.
Investors have certainly negative view on GBPUSD in long term. This 2000 pip movement would impose on another story to many brokers and banks now.
Regardless if you make money with that 2000 pip movement or lost money with it.
This also give you very lesson once more on the importance of national fundamental.
http://algotrading-investment.com/
https://algotradinginvestment.wordpress.com/2016/10/07/gbpusd-market-outlook-21/

Young Ho Seo
Extrapolative Forecasting of DAX, S&P500 and FTSE 250
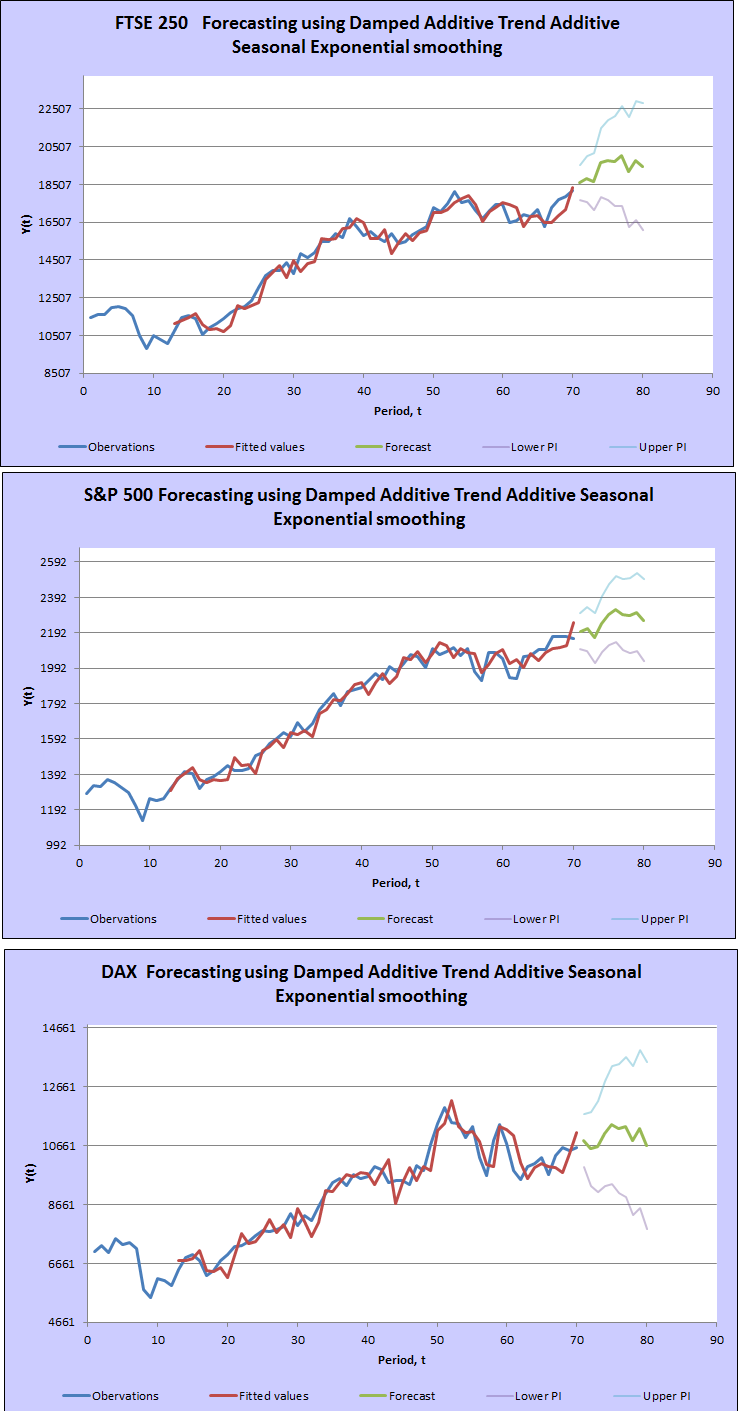
Extrapolative forecasting can be another reference for your trading to be used together with your technical and price action trading.
We have automatically generated damped exponential smoothing methods with additive seasonality for DAX, S&P500 and FTSE 250.
This forecasting should be used as reference only at your own risk.
http://algotrading-investment.com
https://algotradinginvestment.wordpress.com/2016/10/06/extraploative-forecasting-of-dax-sp500-and-ftse-250/

Young Ho Seo
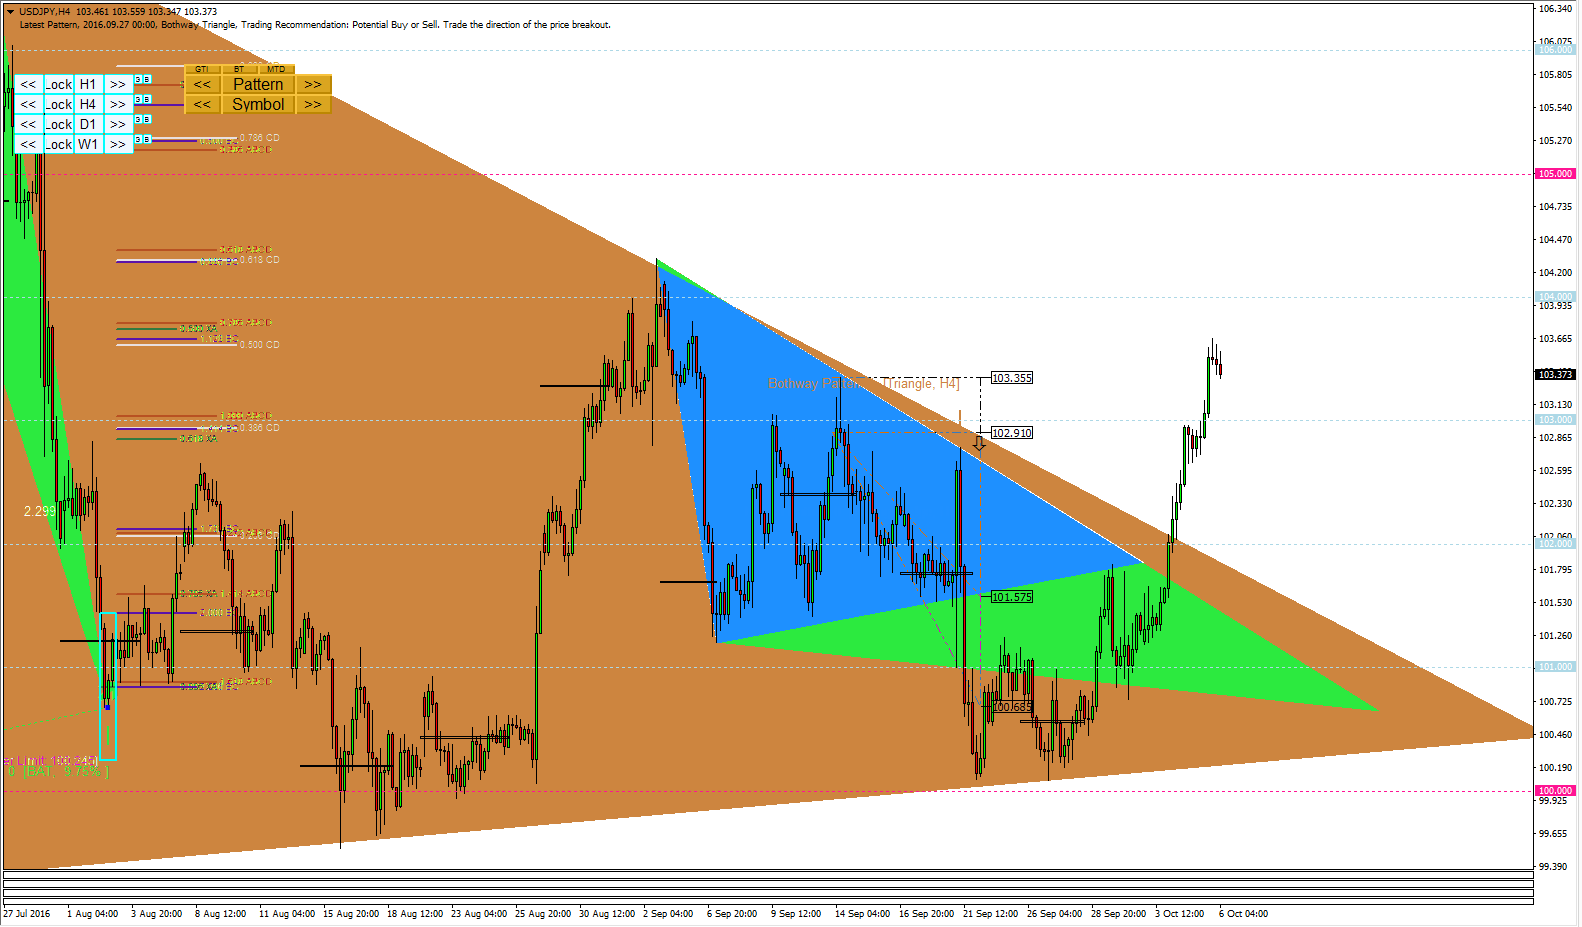
USDJPY Market Outlook
Nice breakout on USDJPY. This is the breakout from three fractal triangles.
USDJPY penetrate 103.00 and now it is sitting in between 103.00 and 104.00.
http://algotrading-investment.com/
https://algotradinginvestment.wordpress.com/2016/10/06/usdjpy-market-outlook-16/
Nice breakout on USDJPY. This is the breakout from three fractal triangles.
USDJPY penetrate 103.00 and now it is sitting in between 103.00 and 104.00.
http://algotrading-investment.com/
https://algotradinginvestment.wordpress.com/2016/10/06/usdjpy-market-outlook-16/

Young Ho Seo
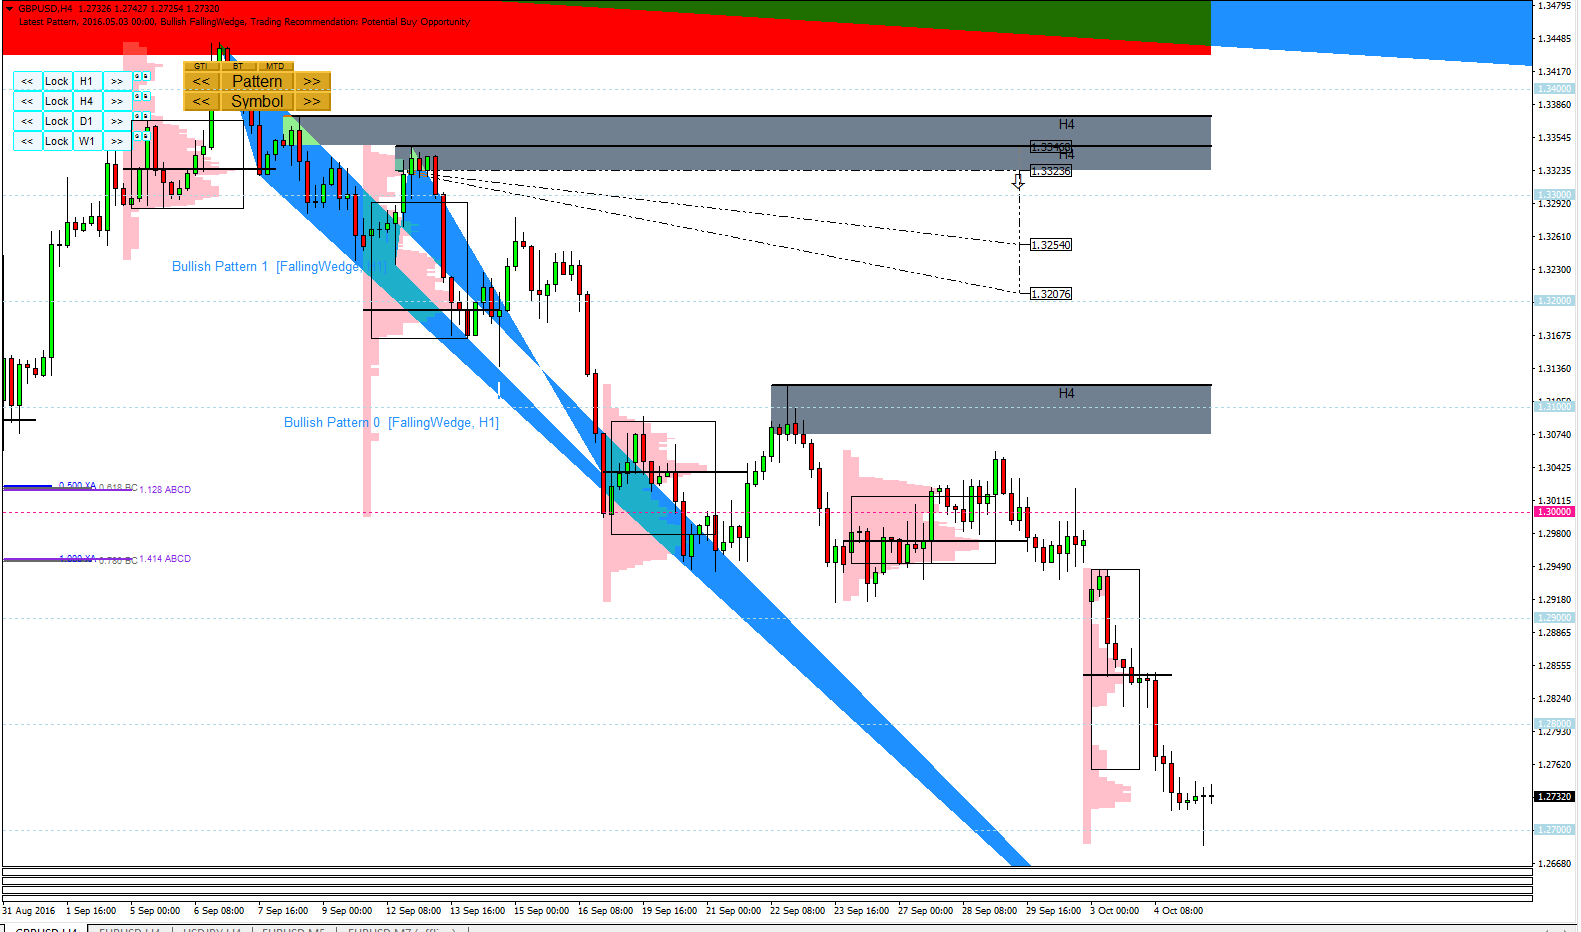
GBPUSD Market Outlook
As we have discussed in our previous post, the level 1.2800 have high impact on GBPUSD. Currently GBPUSD clearly broken down 1.2800 level. Hope everyone got some positive reaction over this movement. GBPUSD is currently moving around 1.2700.
http://algotrading-investment.com/
https://algotradinginvestment.wordpress.com/2016/10/05/gbpusd-market-outlook-20/

Young Ho Seo

US IT Stock Market Outlook
Here are the technical analysis for US 3 big IT Stock. Literarily Microsoft, Google and Apple. As you might see, you can find some common tendency here.
All the analysis was automatically produced from our own algorithmic trading and analysis tool. If you are interested in our technology, you can always contact us.
Visit our website for powerful trading system: http://algotrading-investment.com/
https://algotradinginvestment.wordpress.com/2016/10/04/us-it-stock-market-outlook/
MSFT : 03/10/2016
Open : 57.41
High : 57.55
Low : 57.06
Close : 57.42
BBands Upper (20, 2, 2) : 60.97
BBands Middle (20, 2, 2) : 54.86
BBands Lower (20, 2, 2) : 48.75
SAR (0.02, 0.2) : 54.89
SMA (13) : 56.95
CCI (13) : 38.41
MACD (12, 26, 9) : 1.68
MACD Signal (12, 26, 9) : 1.56
RSI (13) : 62.68
GOOG : 03/10/2016
Open : 774.25
High : 776.07
Low : 769.50
Close : 772.56
BBands Upper (20, 2, 2) : 814.45
BBands Middle (20, 2, 2) : 746.24
BBands Lower (20, 2, 2) : 678.02
SAR (0.02, 0.2) : 720.01
SMA (13) : 767.58
CCI (13) : 35.18
MACD (12, 26, 9) : 17.43
MACD Signal (12, 26, 9) : 15.82
RSI (13) : 58.10
:
:
:
AAPL : 03/10/2016
Open : 112.71
High : 113.05
Low : 112.28
Close : 112.52
BBands Upper (20, 2, 2) : 117.19
BBands Middle (20, 2, 2) : 103.54
BBands Lower (20, 2, 2) : 89.89
SAR (0.02, 0.2) : 104.44
SMA (13) : 107.39
CCI (13) : 92.93
MACD (12, 26, 9) : 3.06
MACD Signal (12, 26, 9) : 1.64
RSI (13) : 60.60

Young Ho Seo
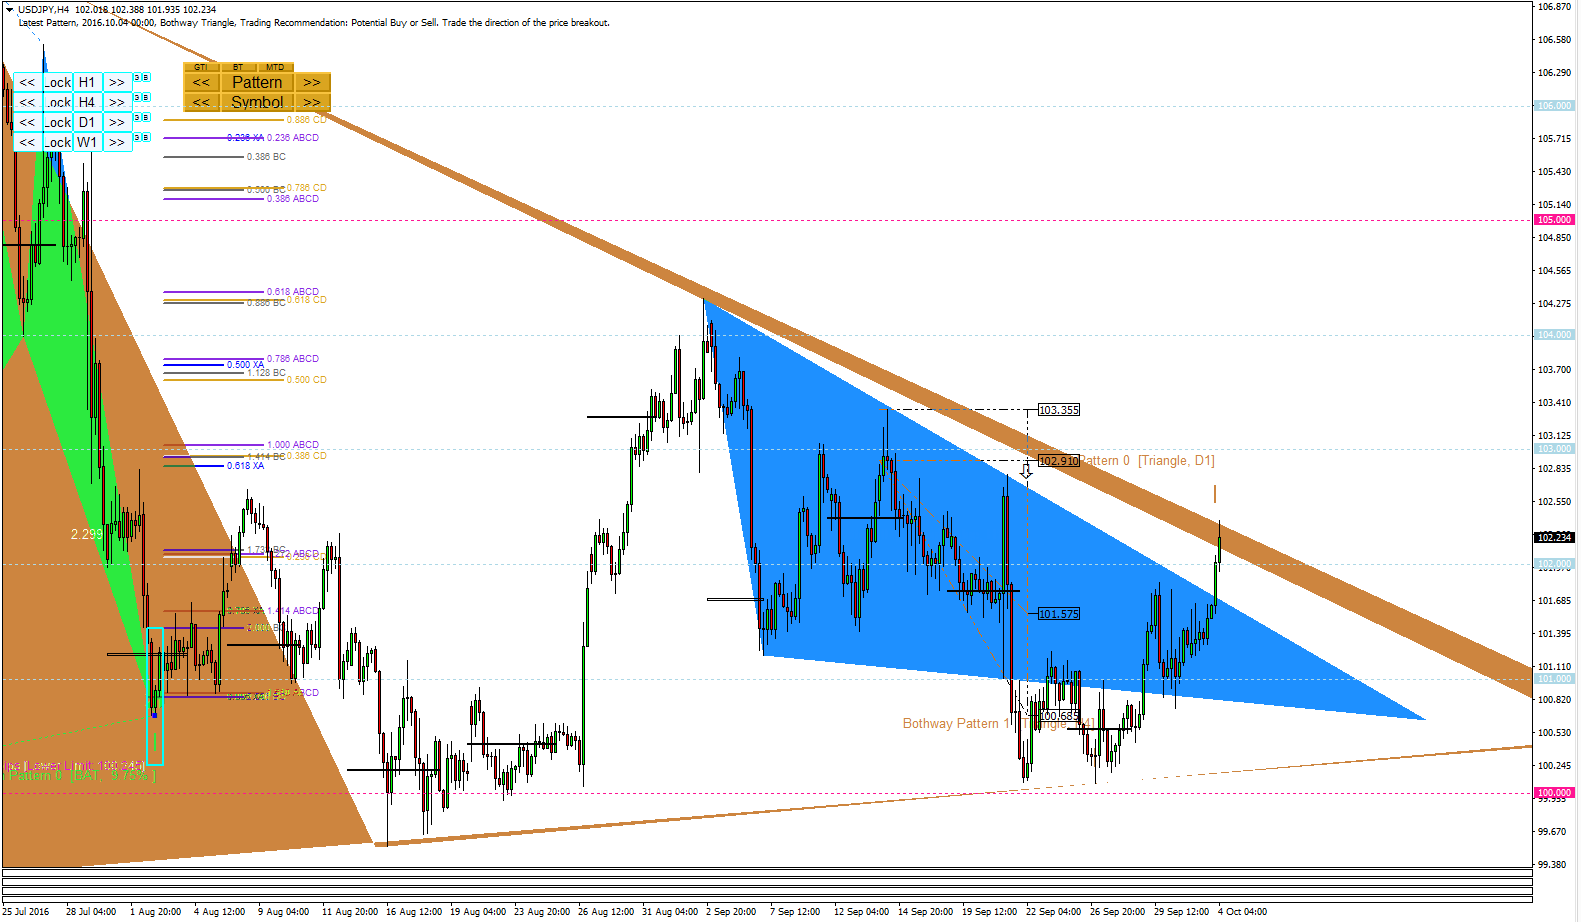
USDJPY Market Outlook
Beautiful breakout at USDJPY and beautiful bounce at upper triangle line.
Fully automatic multiple timeframe geometric analysis is available with our price breakout pattern scanner.
http://algotrading-investment.com/portfolio-item/price-breakout-pattern-scanner/
https://algotradinginvestment.wordpress.com/2016/10/04/usdjpy-market-outlook-15/

Young Ho Seo
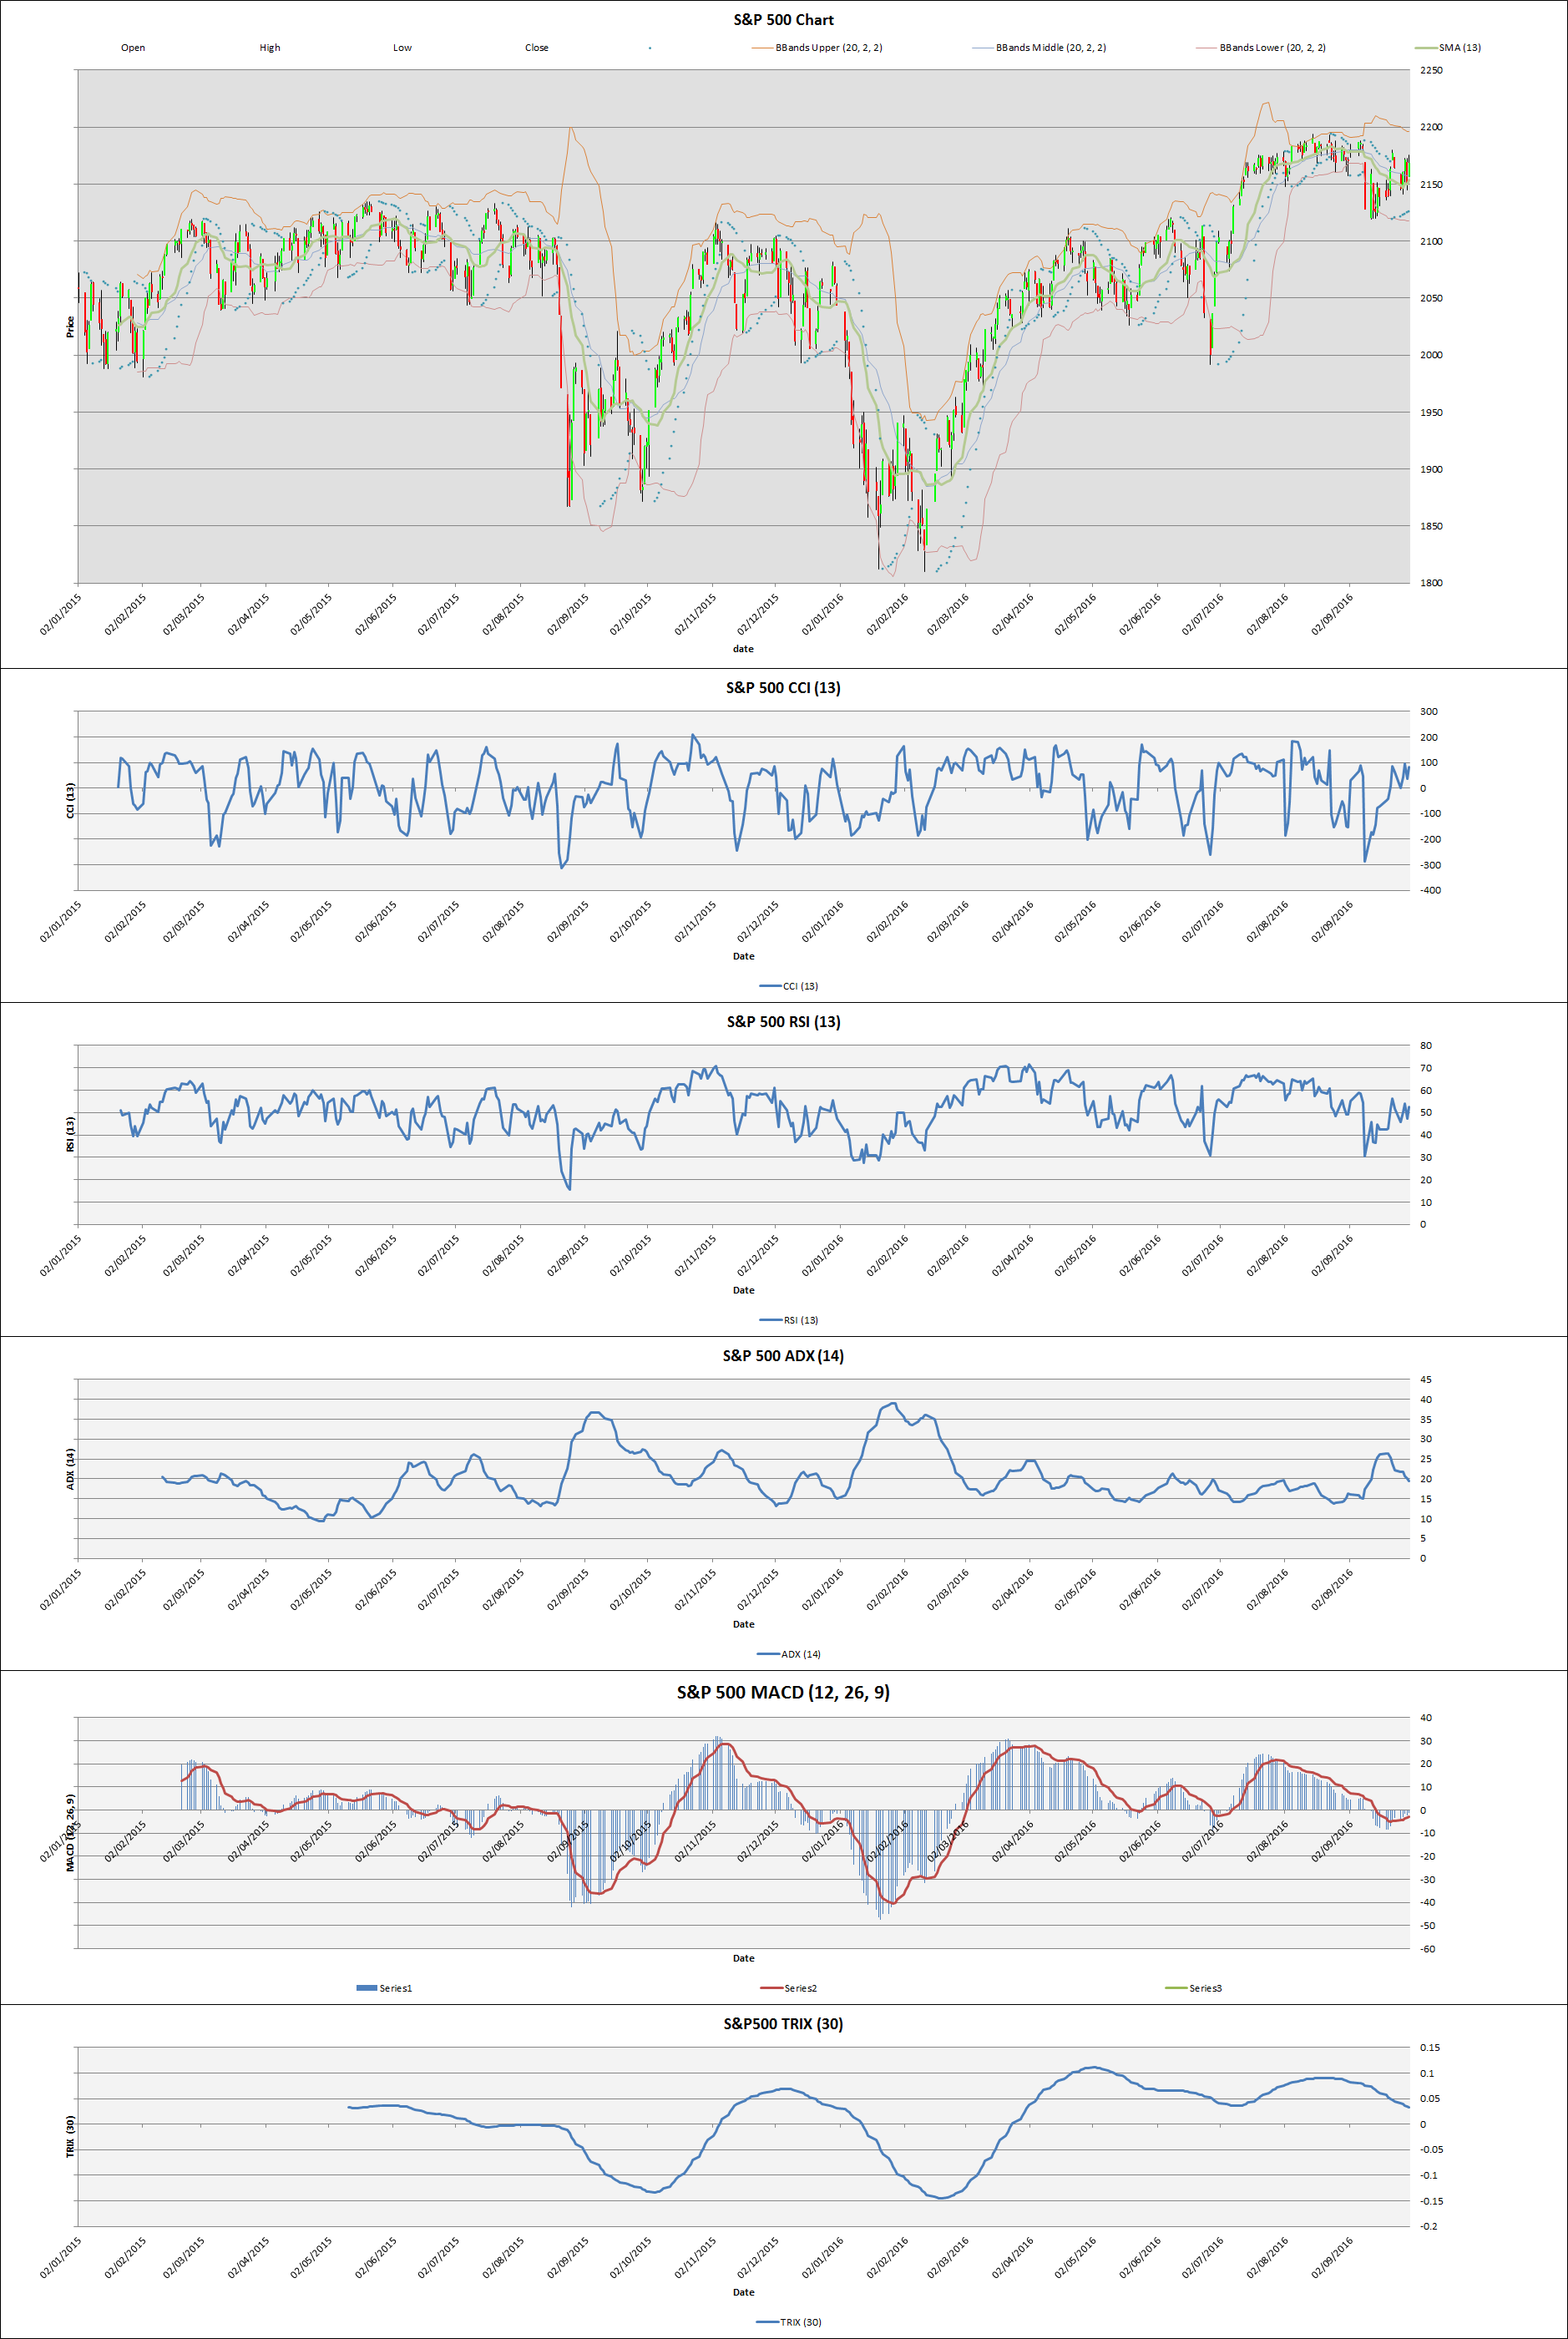
S&P 500 Technical Analysis
S&P 500 is still remaining rather up trendy even though its momentum is rather less comparing to its previous week and couple of weeks ago. It is currently maintaining its position around middle line of Bollinger bands. It is rather far away from Parabolic SAR indicator.
CCI and RSI is still showing rather positive signal but its has not yet entered at their extreme range.
ADX is also showing its losing momentum comparing to previous weeks. MACD is giving little bit confusing signal comparing to other technical indicators. You can also check the reading for all the technical indicators used for this analysis below.
http://algotrading-investment.com/
https://algotradinginvestment.wordpress.com/2016/10/03/sp-500-technical-analysis/
Open : 2156.51
High : 2175.30
Low : 2156.51
Close : 2168.27
SAR (0.02, 0.2) : 2126.07
BBands Upper (20, 2, 2) : 2196.01
BBands Middle (20, 2, 2) : 2157.03
BBands Lower (20, 2, 2) : 2118.05
CCI (13) : 83.28
RSI (13) : 52.62
ADX (14) : 19.49
MACD (12, 26, 9) : -1.13
MACD Signal (12, 26, 9) : -2.93
TRIX (30) : 0.03
SMA (13) : 2153.30

Young Ho Seo
Shanghai Stock Market Index Technical Analysis
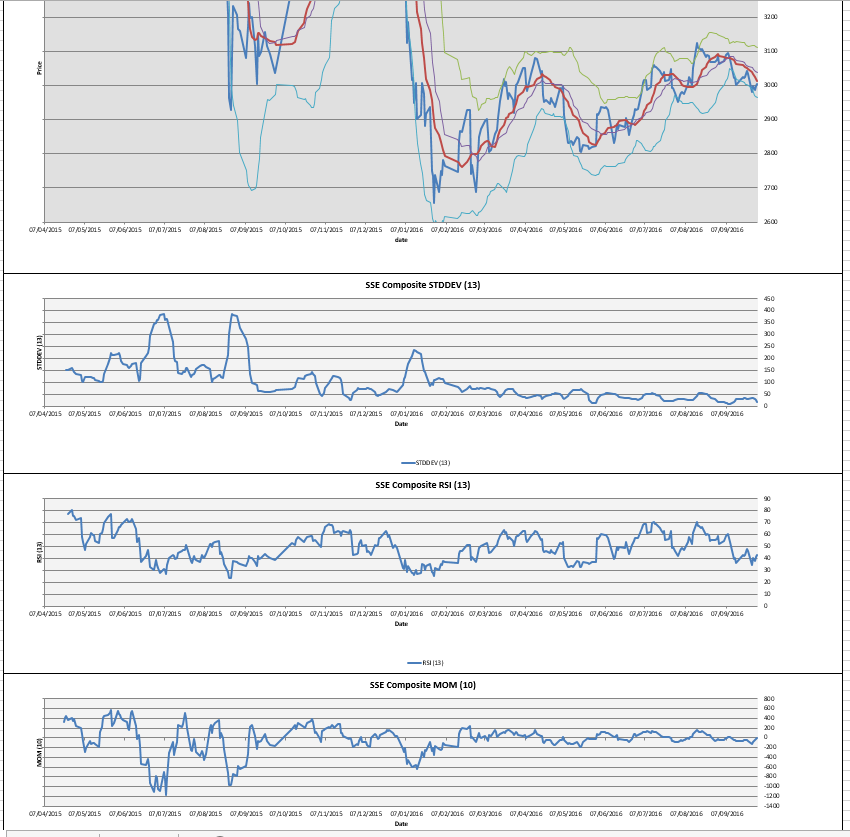
Shanghai stocks Index, SSE Composite Index have shown weakness in September comparing to Its August Market. In overall, Shanghai Stock Index are experiencing corrective market since its first peak 2008 and its second peak 2015. Currently SSE composite index is below its middle line of Bollinger bands. Standard deviation, Momentum, RSI and TRIX shows rather bearish movement in big picture.
http://algotrading-investment.com
https://algotradinginvestment.wordpress.com/2016/10/03/shanghai-stocks-index-technical-analysis/
SMA (13) : 3013.01
BBands Upper (20, 2, 2) : 3111.00
BBands Middle (20, 2, 2) : 3037.37
BBands Lower (20, 2, 2) : 2963.75
STDDEV (13) : 18.01
RSI (13) : 43.11
MOM (10) : 1.85
TRIX (30) : 0.05

Young Ho Seo
GBPUSD Market Outlook
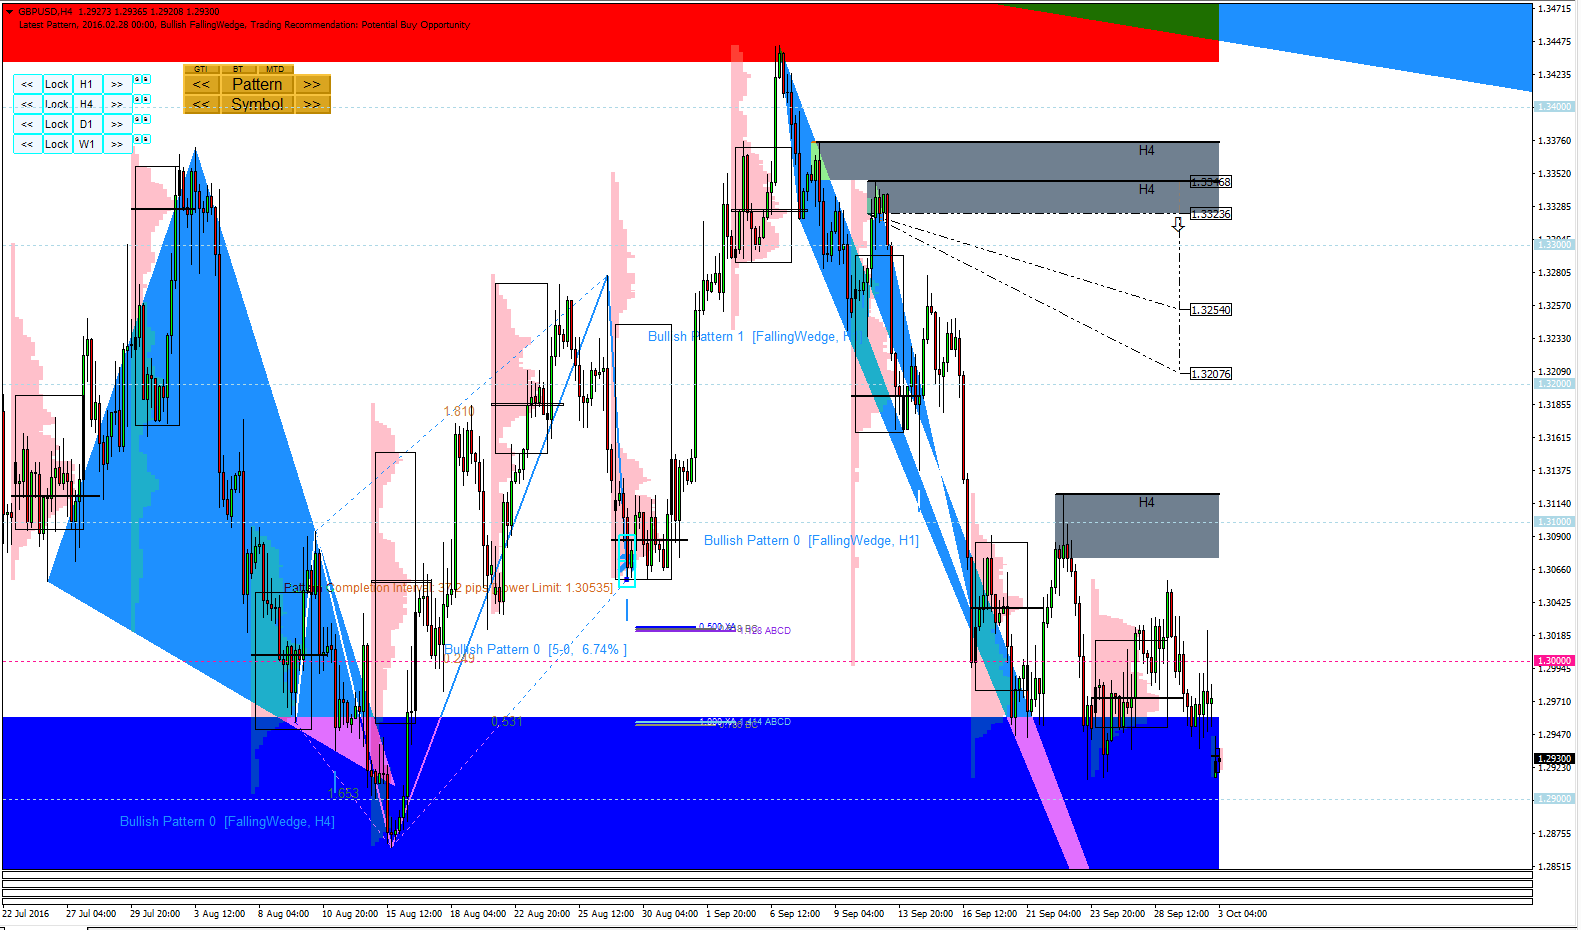
As we have mentioned before, 1.2800, 1.2900 and 1.3000 are the very important round number for GBPUSD for now to watch out. Currently GBPUSD are near 1.2900. For 1.2800 and 1.2900, there can be substantial reaction on GBPUSD regardless it will try to re-bounce from the level or try to penetrate this level. The level 1.2800 can have higher impact than 1.2900 although signal might be triggered little earlier with 1.2900.
http://algotrading-investment.com/
https://algotradinginvestment.wordpress.com/2016/10/03/gbpusd-market-outlook-19/

Young Ho Seo

NASDAQ Composite Technical Analysis
NASDAQ rose by 23.13 last Friday. NASDAQ is currently in between upper and middle Bollinger bands lines. It is around 50% recovery in comparison to Thursday drop of 42.16. CCI reading is at 71.14. ADX is still below 15. MACD histogram is slightly higher than MACD signal but they are nearly indifference.
Below is full reading of technical analysis for NASDAQ.
http://algotrading-investment.com/
https://algotradinginvestment.wordpress.com/2016/10/02/nasdaq-composite-technical-analysis/
Open : 5288.87
High : 5325.88
Low : 5277.88
Close : 5312.00
TEMA (30) : 5294.35
CCI (13) : 71.14
ADX (14) : 15.26
MACD (12, 26, 9) : 27.93
MACD Signal (12, 26, 9) : 25.39
MFI (14) : 72.73
BBands Upper (20, 2, 2) : 5363.68
BBands Middle (20, 2, 2) : 5255.50
BBands Lower (20, 2, 2) : 5147.33

Young Ho Seo
DAX Technical Analysis
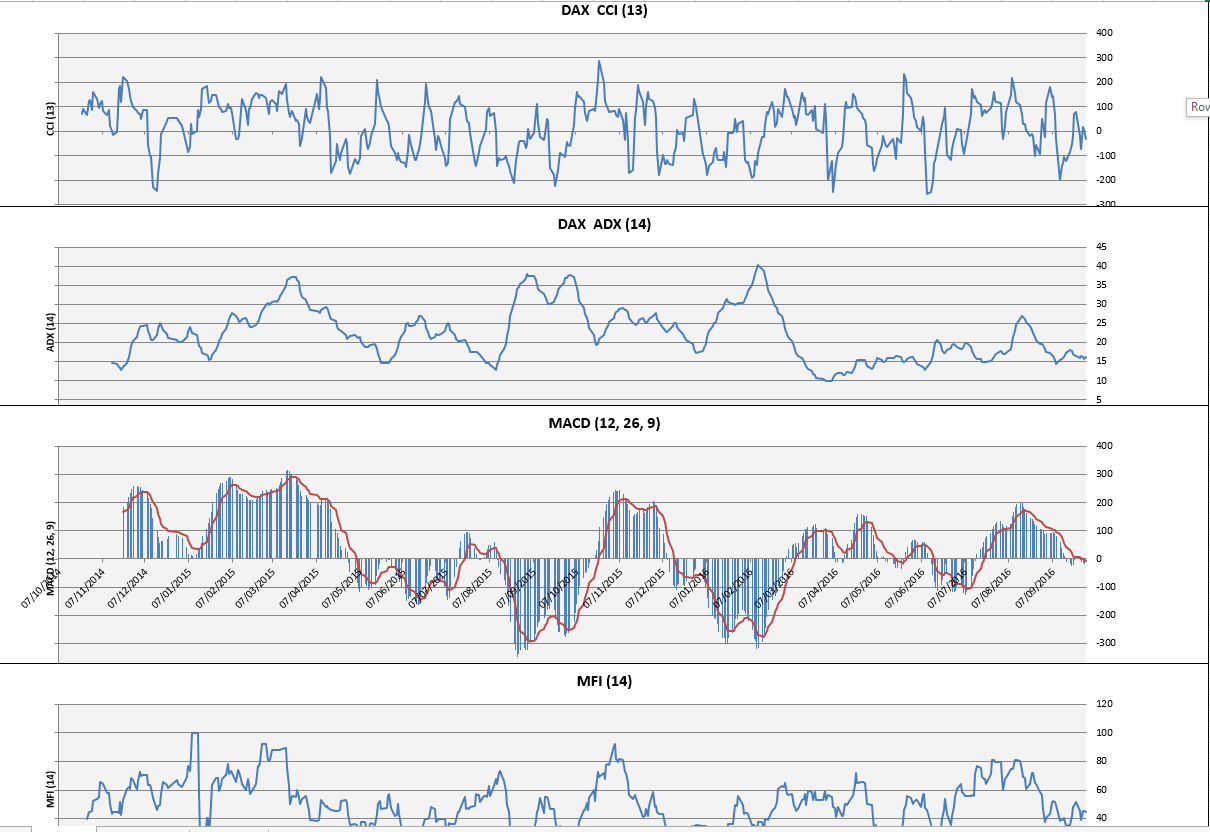
ADX is rose by 270.32 points on last Friday making big jump from its lower bollinger bands line. ADX reading is around 16 showing that DAX is less active comparing to last. CCI Reading is slighly below zero. Signal and histogram of MACD also hit near zero last Friday. Overall volality is quite low comparing the September and August.
Here is the reading of various technial analysis.
http://algotrading-investment.com/
https://algotradinginvestment.wordpress.com/2016/10/01/dax-technical-analysis/
Open 10240.69043
High 10531.25977
Low 10189.94043
Close 10511.01953
Volume 182523300
BBands Upper (20, 2, 2) 10766.87851
BBands Middle (20, 2, 2) 10494.0335
BBands Lower (20, 2, 2) 10221.18849
TEMA (30) 10446.83927
CCI (13) -32.46467533
ADX (14) 16.12799778
MACD (12, 26, 9) -11.85685682
MACD Signal (12, 26, 9) -5.623662711
MFI (14) 44.711327

Young Ho Seo

USDJPY Market Outlook
Three triangle forming fractal dimension giving extremely clear view on USDJPY helping to anticipate next steps. We hope this continues for USDJPY.
USDJPY is currently sitting around 101.00.
http://algotrading-investment.com/
https://algotradinginvestment.wordpress.com/2016/09/30/usdjpy-market-outlook-14/

Young Ho Seo
GBPUSD Market Outlook
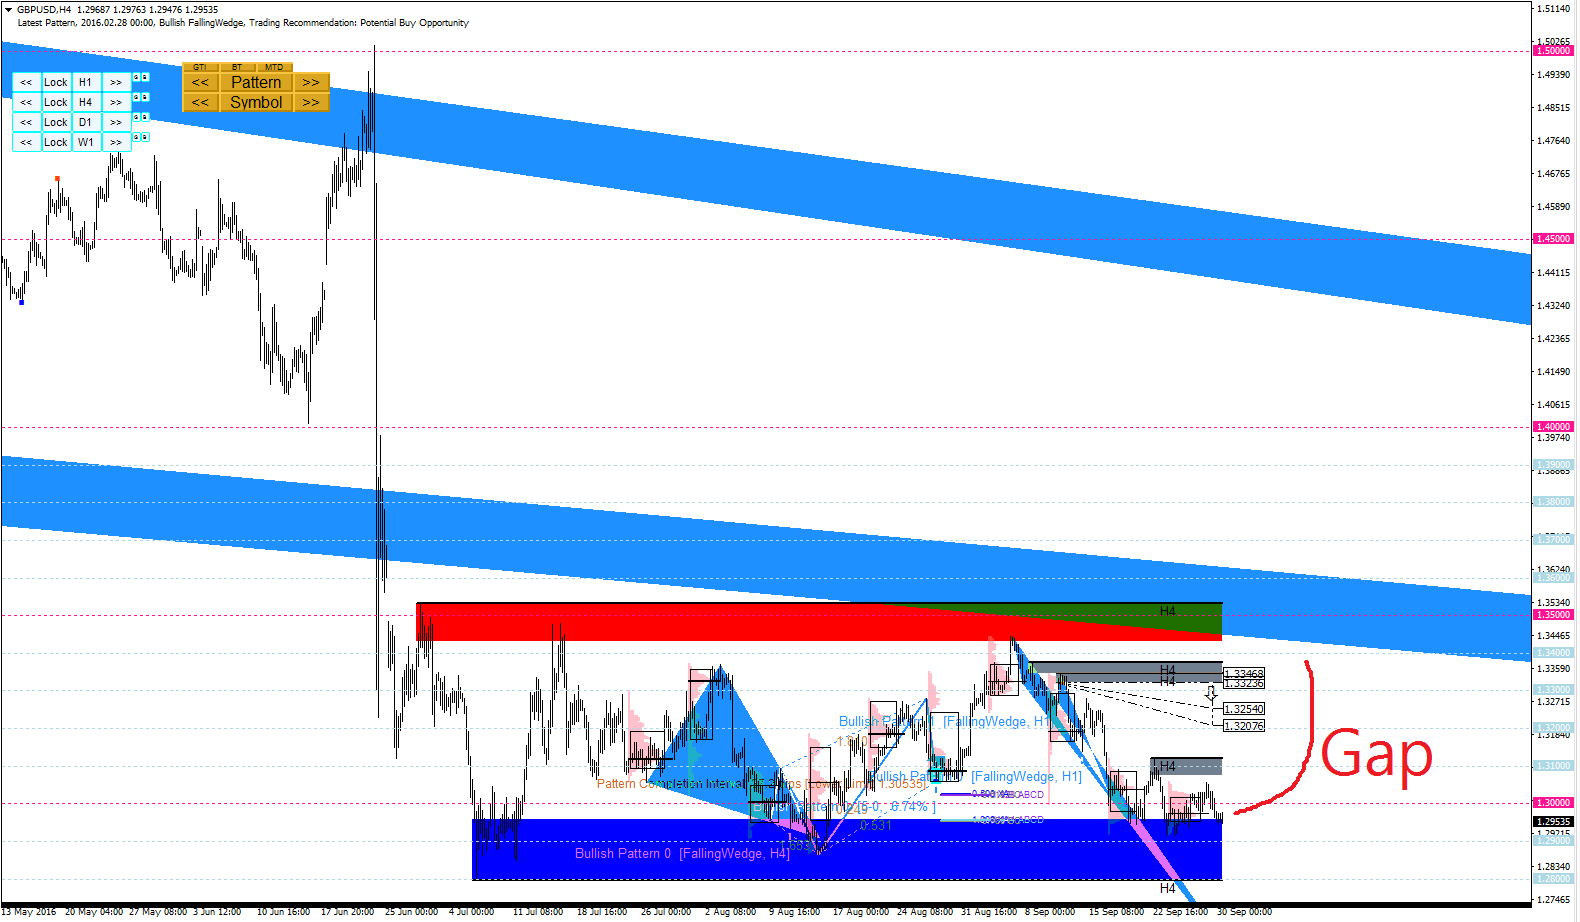
GBPUSD is showing ever so interesting movement inside Box Area formed by strong supply and demand zone (around 750 pip height).
Also it is important to note that current GBPUSD have quite big gap between bottom line of weekly triangle.
For this reason, 1.2800, 1.2900 and 1.3000 are the very important round number for GBPUSD for now to watch out.
http://algotrading-investment.com/
https://algotradinginvestment.wordpress.com/2016/09/30/gbpusd-market-outlook-18/

Young Ho Seo
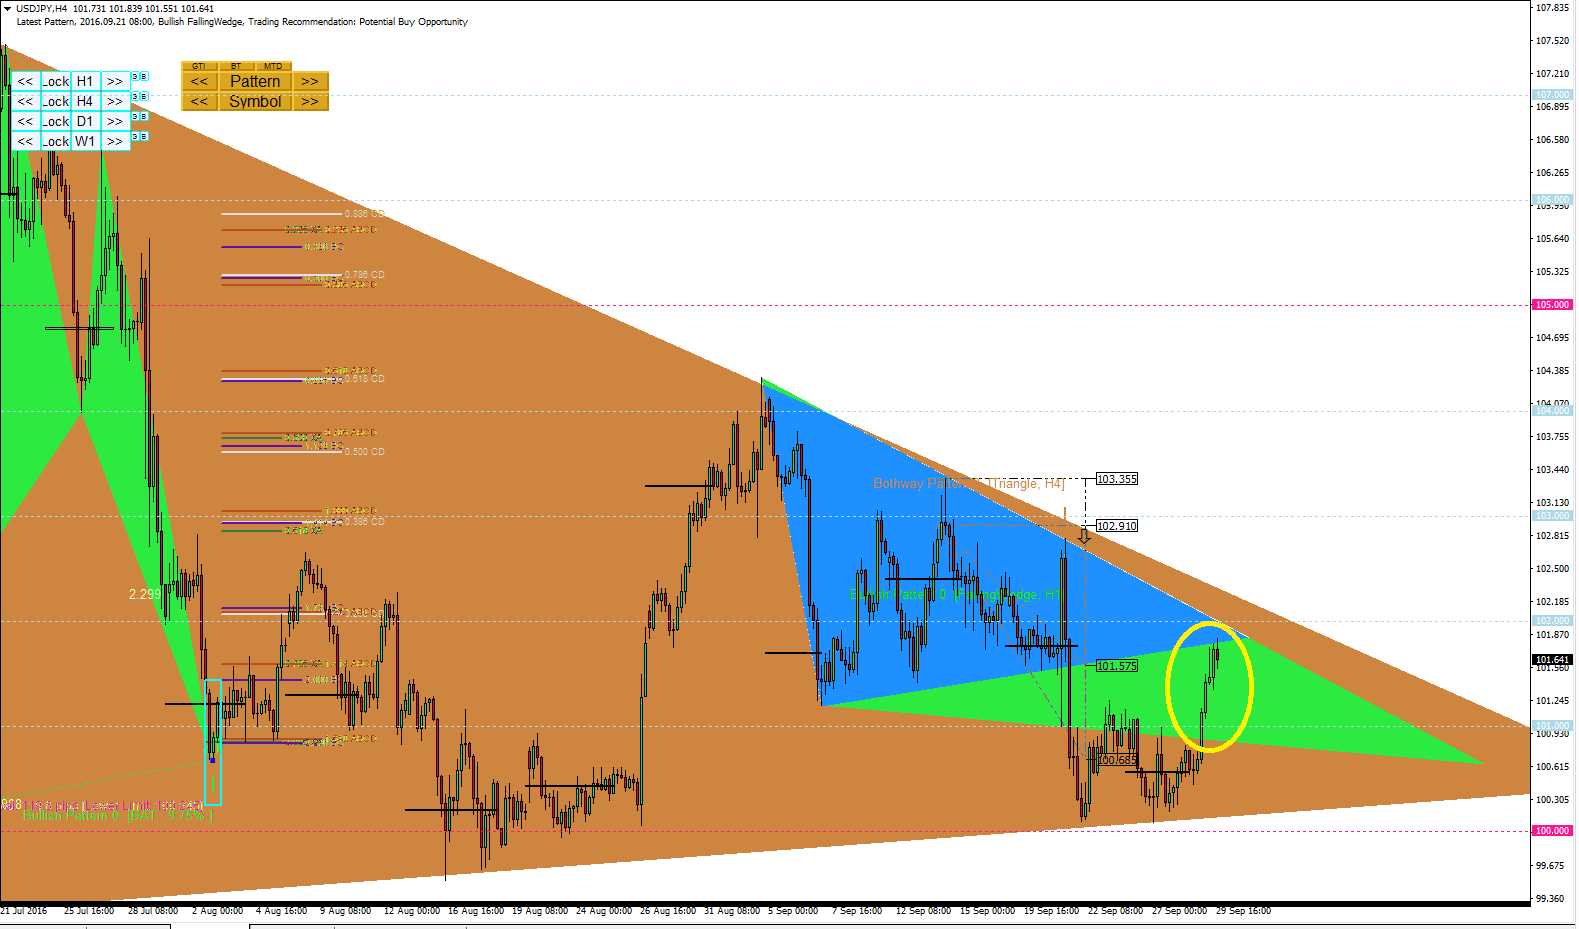
USDJPY Market Outlook
USDJPY had a good breakout towards the upper edge of H1 triangle.
USDJPY is little bit resting around its nearest round number is at 102.00.
http://algotrading-investment.com/
https://algotradinginvestment.wordpress.com/2016/09/29/usdjpy-market-outlook-13/
USDJPY had a good breakout towards the upper edge of H1 triangle.
USDJPY is little bit resting around its nearest round number is at 102.00.
http://algotrading-investment.com/
https://algotradinginvestment.wordpress.com/2016/09/29/usdjpy-market-outlook-13/

Young Ho Seo

USDJPY Market Outlook
Good breakout for USDJPY through 101.00.
Nearly 100 pips movement.
With Price Breakout Pattern Scanner you can anticipate short term, medium and long term movement of the currency pairs effectively at the same time on single chart.
http://algotrading-investment.com/portfolio-item/price-breakout-pattern-scanner/
https://algotradinginvestment.wordpress.com/2016/09/29/usdjpy-market-outlook-12/

Young Ho Seo
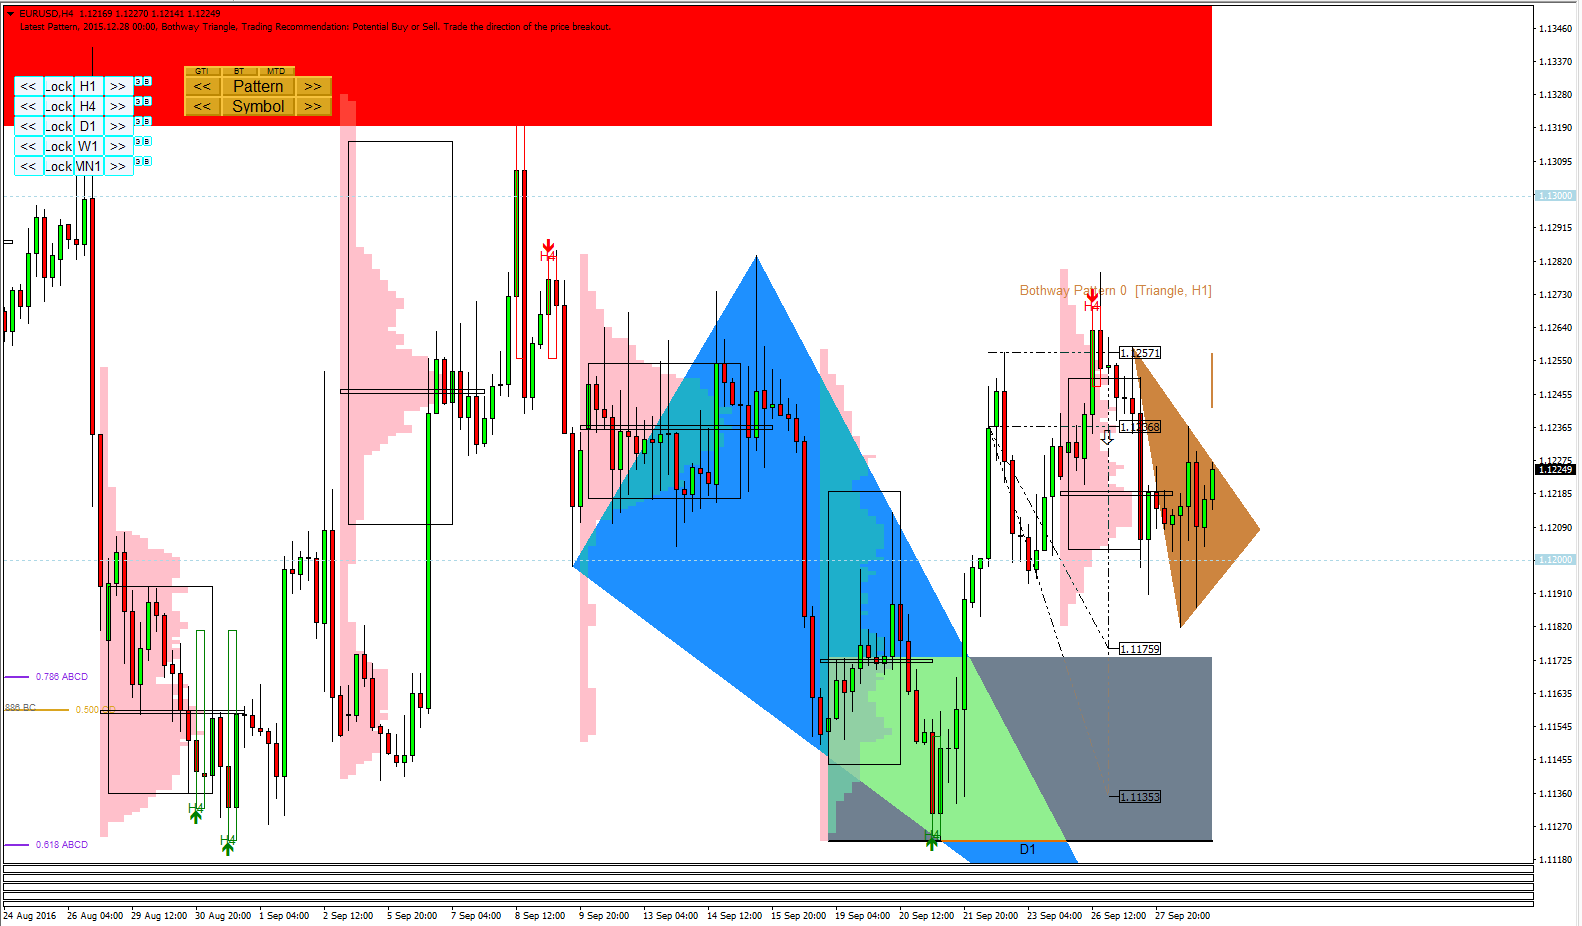
EURUSD Market Outlook
Triangle pattern formed in H1 timeframe for EURUSD.
Nearest round number to watch out is 1.1200.
http://algotrading-investment.com/
https://algotradinginvestment.wordpress.com/2016/09/29/eurusd-market-outlook-9/
Triangle pattern formed in H1 timeframe for EURUSD.
Nearest round number to watch out is 1.1200.
http://algotrading-investment.com/
https://algotradinginvestment.wordpress.com/2016/09/29/eurusd-market-outlook-9/

Young Ho Seo
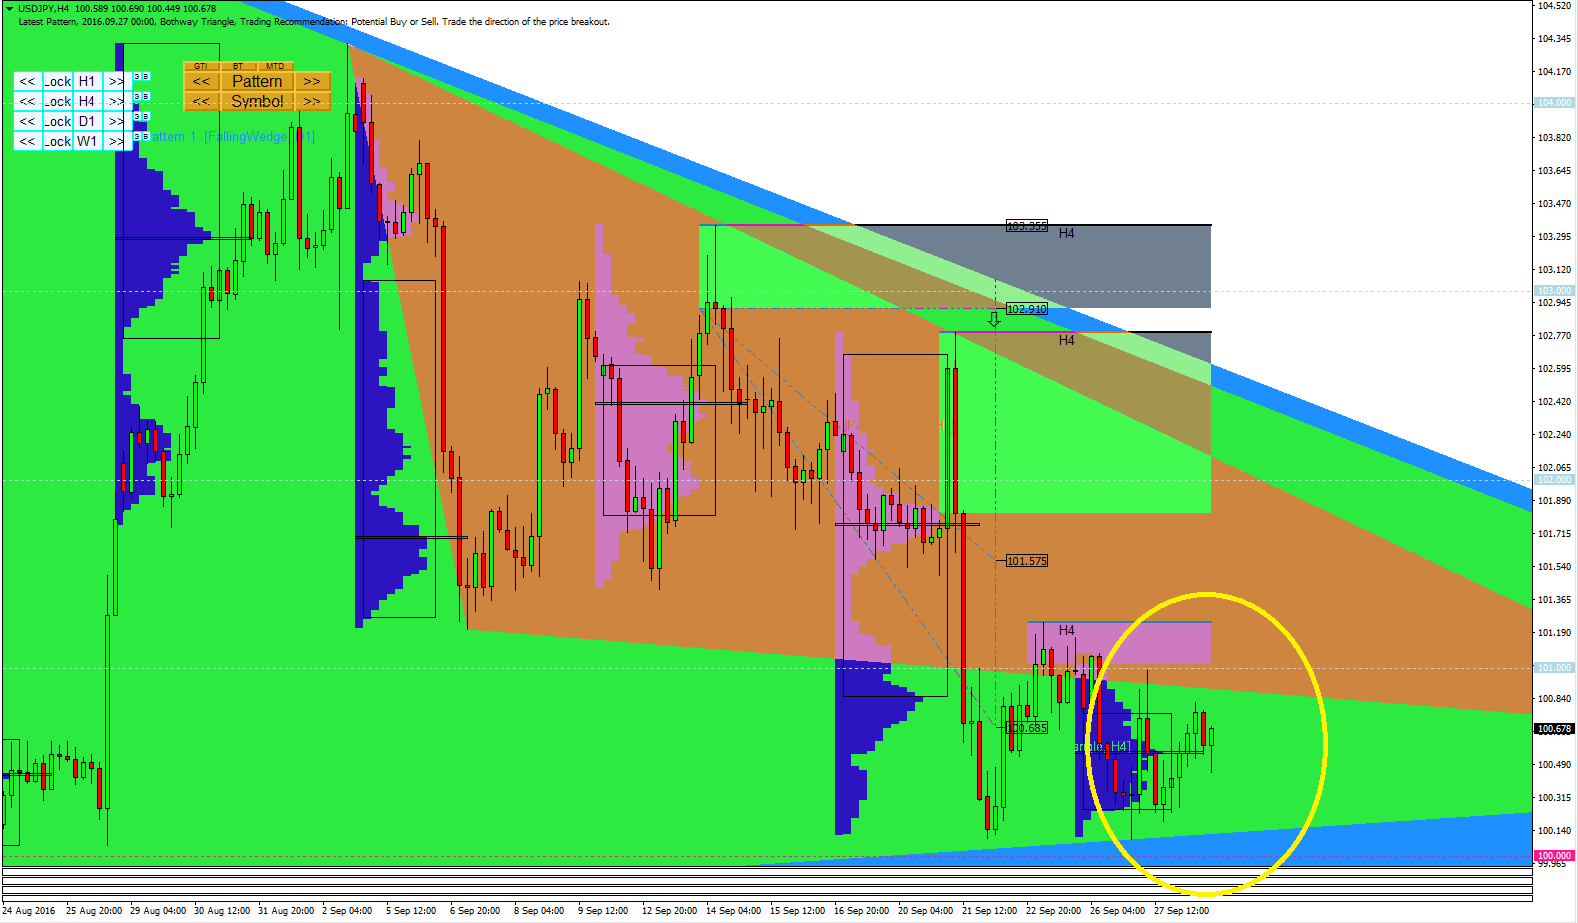
USDJPY Market Outlook
USDJPY is currently consolidating inside triangle (marked yellow).
USDJPY is soon expected to have a good breakout.
http://algotrading-investment.com/
https://algotradinginvestment.wordpress.com/2016/09/28/usdjpy-market-outlook-11/
USDJPY is currently consolidating inside triangle (marked yellow).
USDJPY is soon expected to have a good breakout.
http://algotrading-investment.com/
https://algotradinginvestment.wordpress.com/2016/09/28/usdjpy-market-outlook-11/

Young Ho Seo

GBPUSD Market Outlook
GBPUSD just formed H4 triangle just over the round 1.300.
Watch out this moment.
We have several important economic data release.
If you are interested in powerful trading software: http://algotrading-investment.com/
Our blog: https://algotradinginvestment.wordpress.com/2016/09/28/gbpusd-market-outlook-17/

: