Farzin Sadeghi Bonjar / Perfil
- Informações
|
8+ anos
experiência
|
5
produtos
|
232
versão demo
|
|
0
trabalhos
|
0
sinais
|
0
assinantes
|
you can find more info about me on my linkedin profile : https://www.linkedin.com/in/farzinsb/
you can contact us in telegram: https://t.me/Marketz_site
you can contact us in telegram: https://t.me/Marketz_site
Amigos
444
Pedidos
Enviados
Farzin Sadeghi Bonjar
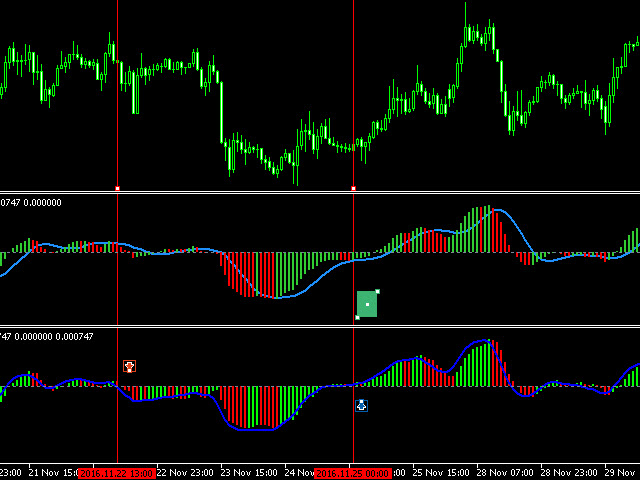
I uploaded a free indicator that I was working on it for recent days for MT5. which is a new formula for MACD and it gives faster signals. it will be available in the MQL5 market for free as soon as they verify and accept it.

Farzin Sadeghi Bonjar

usdjpy 1min opening gap . 14 pips scalp to catch...
Farzin Sadeghi Bonjar
2016.10.10
gap filled in 4 hours . +20 pips. then market reversed and continued its growing way of before the gap. https://charts.mql5.com/12/765/usdjpy-e-m1-riston-capital-ltd.png
Farzin Sadeghi Bonjar

EURCHF can be a good buy signal. H1
https://charts.mql5.com/12/759/eurchf-e-h1-riston-capital-ltd.png
https://charts.mql5.com/12/759/eurchf-e-h1-riston-capital-ltd.png
Farzin Sadeghi Bonjar
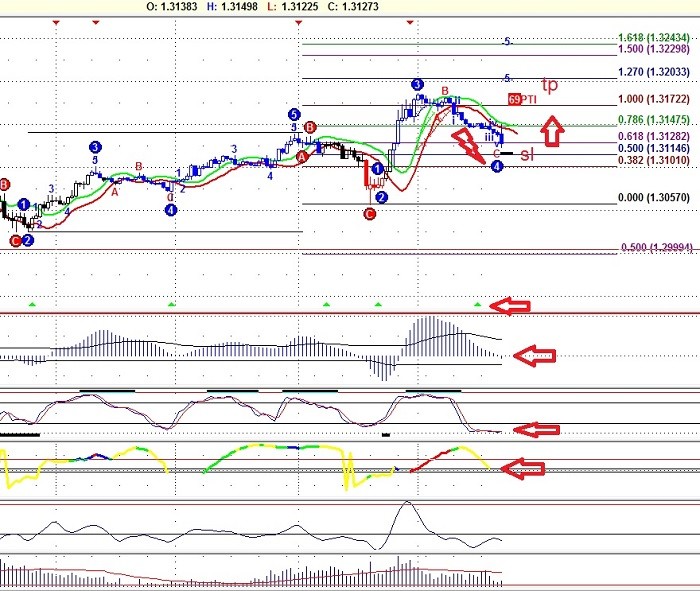
I think USDCAD may have a buy on 5th wave on monday.
buystop from 1.313 , TP : 1.32 , SL : 1.311
lets see how things will go on...
buystop from 1.313 , TP : 1.32 , SL : 1.311
lets see how things will go on...

Farzin Sadeghi Bonjar
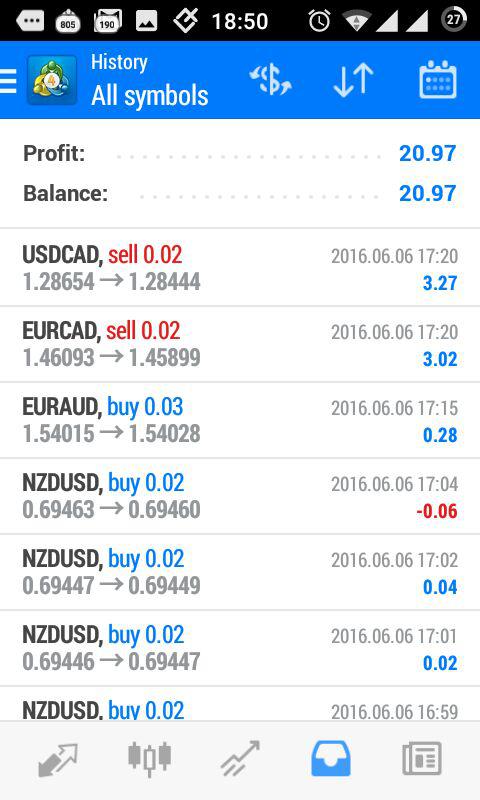
I have finished coding my 4th version of recovery EA. first version was out at 2016.01 . this one uses a new calculation formula which reduces required lot sizes and the recovery distance varies. first recovery levels , recover at smaller distance and faster recoveries. and as the market ranges and causes higher levels of recovery to become active , then recovery distance increases to reduce lot size from over-increasing. so recovery will happen at a later time in comparison with first recovery levels. also as the lot size does not increase too much , at 30 wrong trades , lot size will still be less than 1 lot , and recovery distance will be around 750 pips at most. recoveries starting from 50-100 pips to 750 pips on default settings.
this is the forward test result of activating this EA in a 300$ account and forward testing it on 7 major pairs in 2 hours. looks good so far. I am simplifying the code to put it in the mql5 market.
this is the forward test result of activating this EA in a 300$ account and forward testing it on 7 major pairs in 2 hours. looks good so far. I am simplifying the code to put it in the mql5 market.

Farzin Sadeghi Bonjar
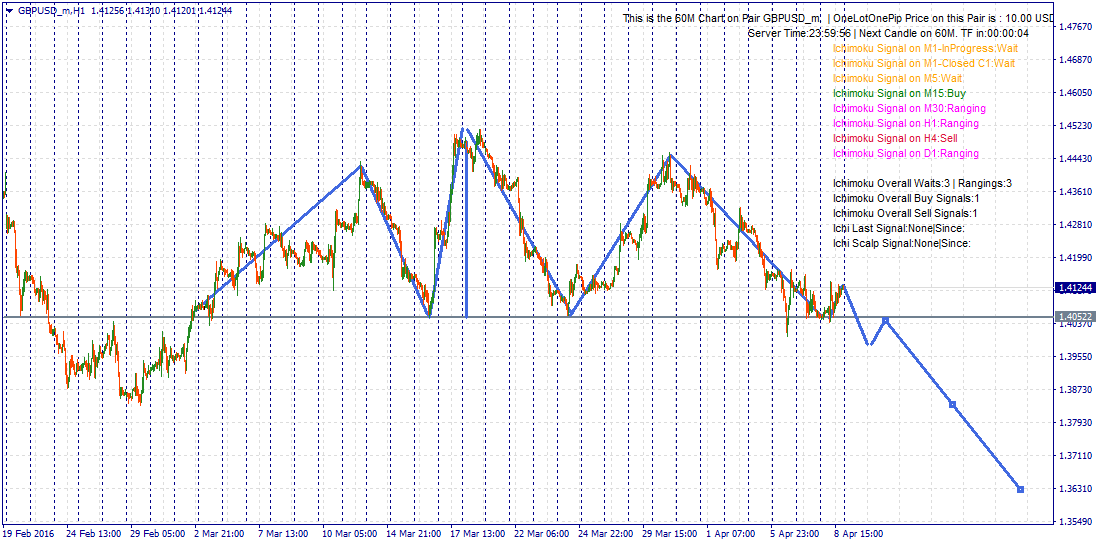

gbpusd Head and shoulder pattern. waiting for a break of 1.4050 and retest that resistance and then dive - 400 pip sell signal may happen. ( long term )
https://www.tradingview.com/i/QrEBoUZt/
https://www.tradingview.com/i/QrEBoUZt/

Farzin Sadeghi Bonjar
2016.04.13
this head and shoulder pattern seems to failed. or it will act later :|
Farzin Sadeghi Bonjar
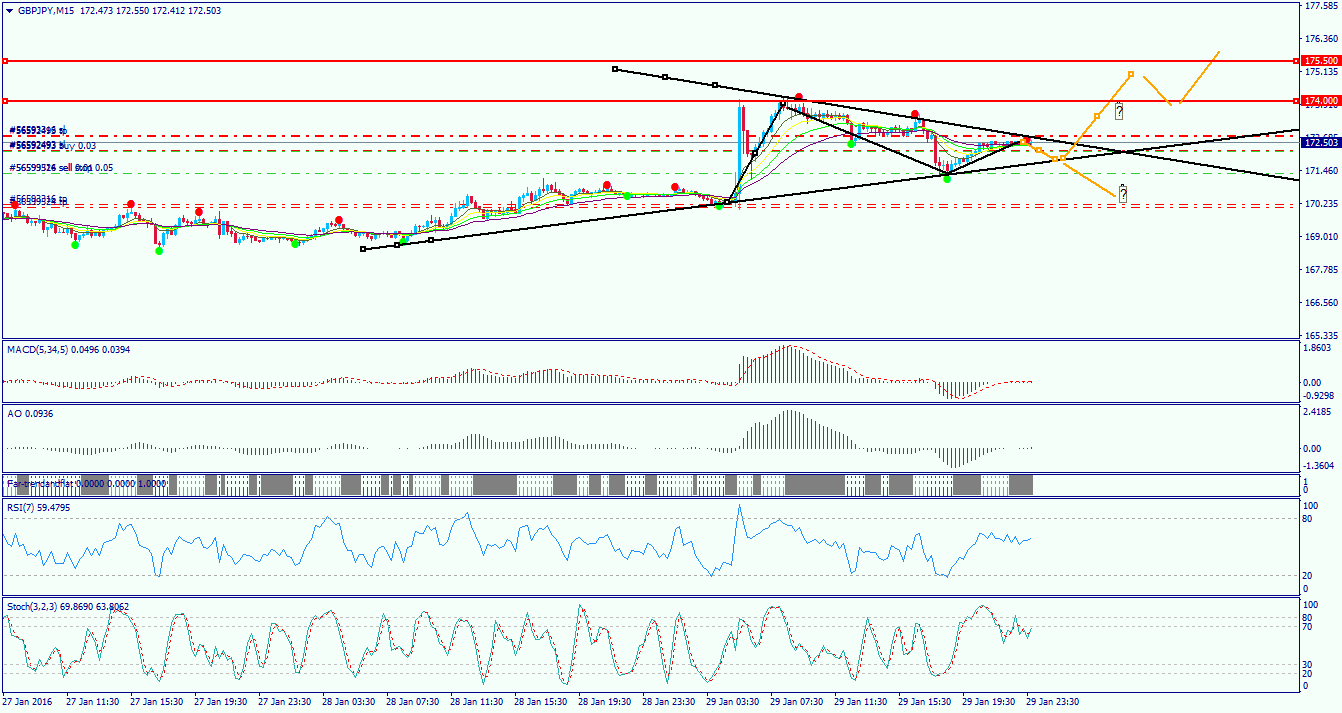
gbpjpy : buy from 172.5 to 175 ( wave 4 ) . sell stop from 175 to 162.
follow us on telegram : https://telegram.me/FXCOFOREX
follow us on telegram : https://telegram.me/FXCOFOREX

Farzin Sadeghi Bonjar
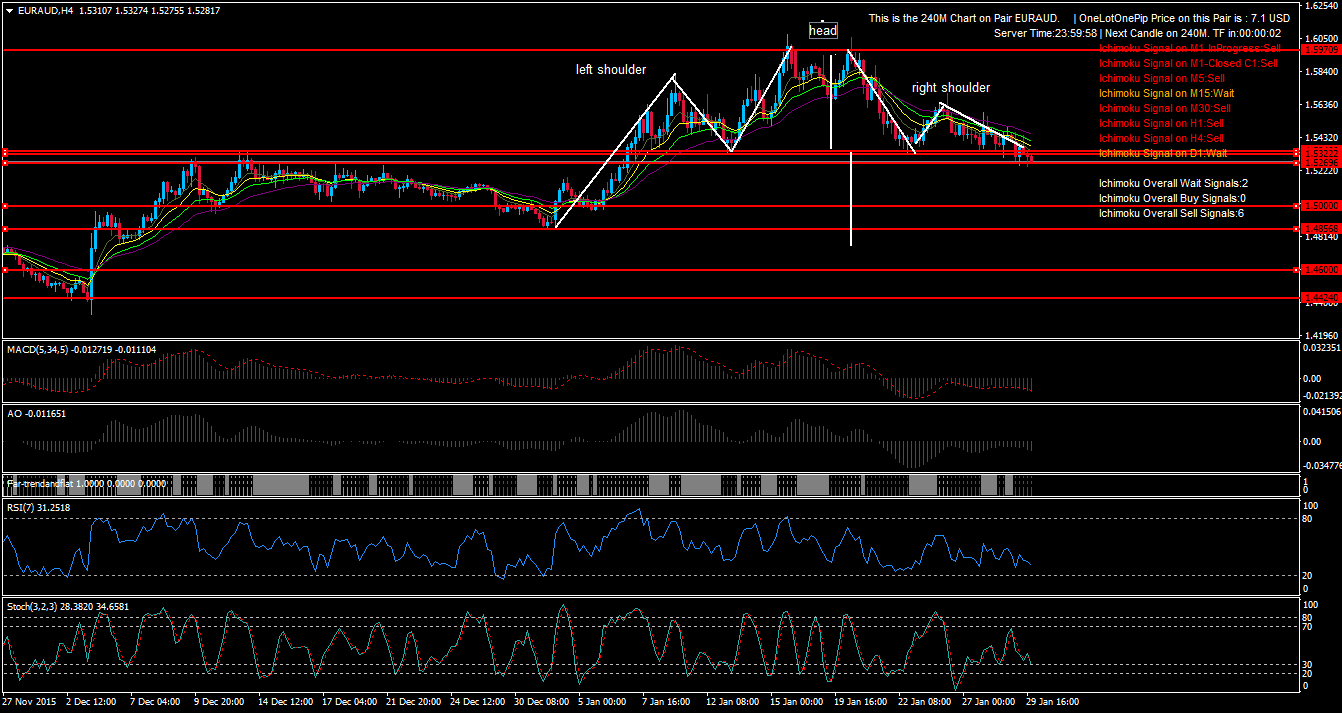
Head and shoulder and double top pattern on EurAud. a strong and long term sell signal from 1.53 to 1.50 and 1.4850...
follow us on telegram : https://telegram.me/FXCOFOREX
follow us on telegram : https://telegram.me/FXCOFOREX

Farzin Sadeghi Bonjar
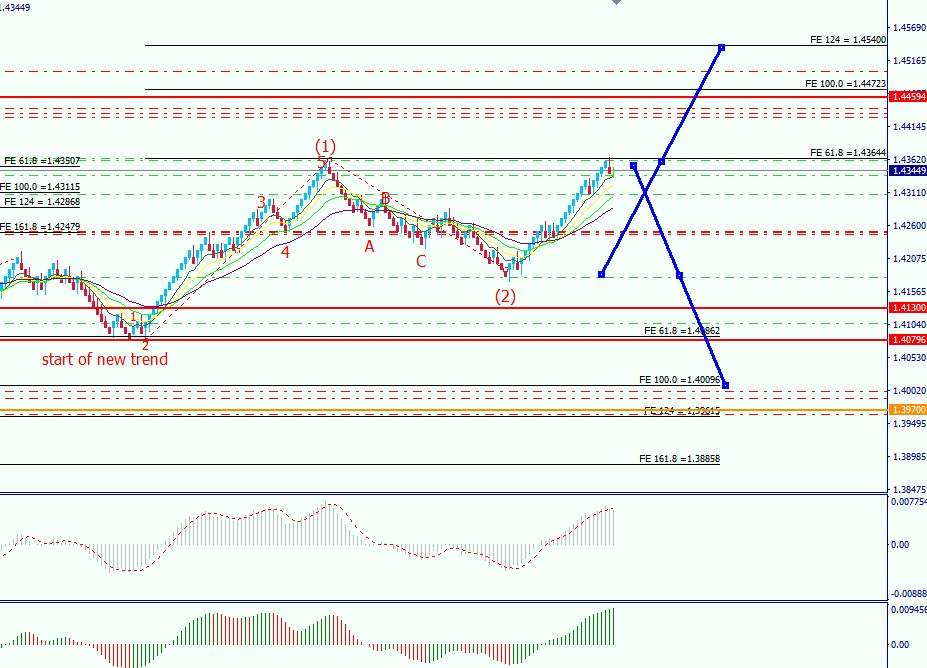
GbpUsd seems to be in the middle of a new Wave 3 which can gron to 1.45 . but it must pass the 1.436-7 resistant area first. if it cannot pass that level the chart can have double top , and go down to 1.40 as the trend in the daily wants.
follow us on telegram : https://telegram.me/FXCOFOREX
follow us on telegram : https://telegram.me/FXCOFOREX

Farzin Sadeghi Bonjar
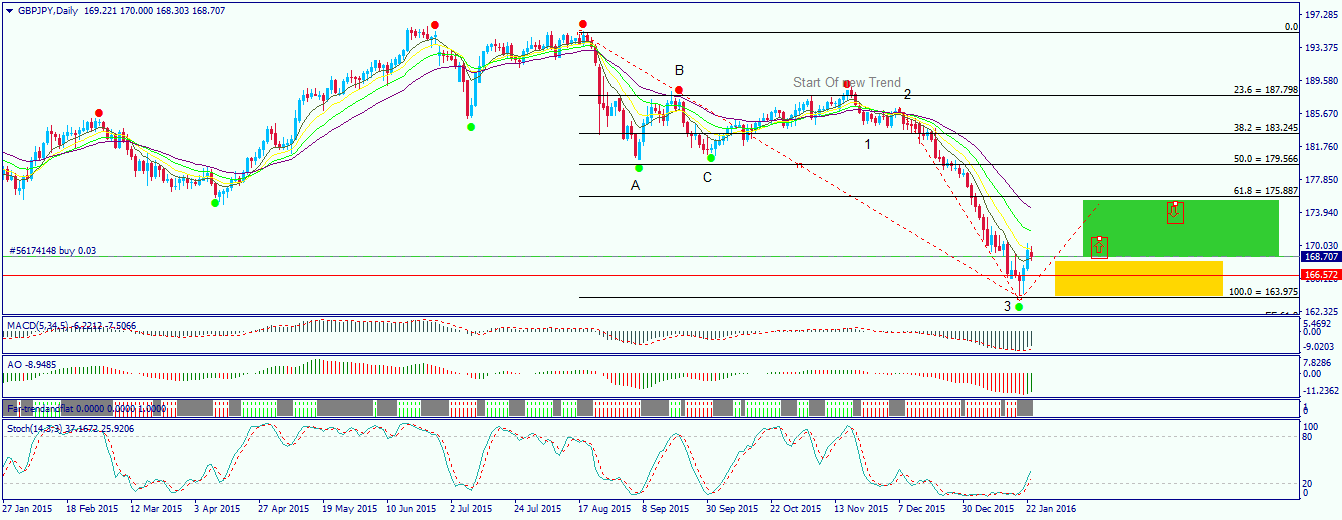
GbpJpy seems to be in the wave 4 pullback so we can buy this pair from this 168.5 to 174 and sell it later at the corrected price of start of wave 5.
follow us on telegram : https://telegram.me/FXCOFOREX
follow us on telegram : https://telegram.me/FXCOFOREX

Farzin Sadeghi Bonjar
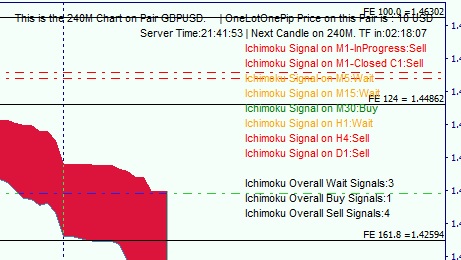
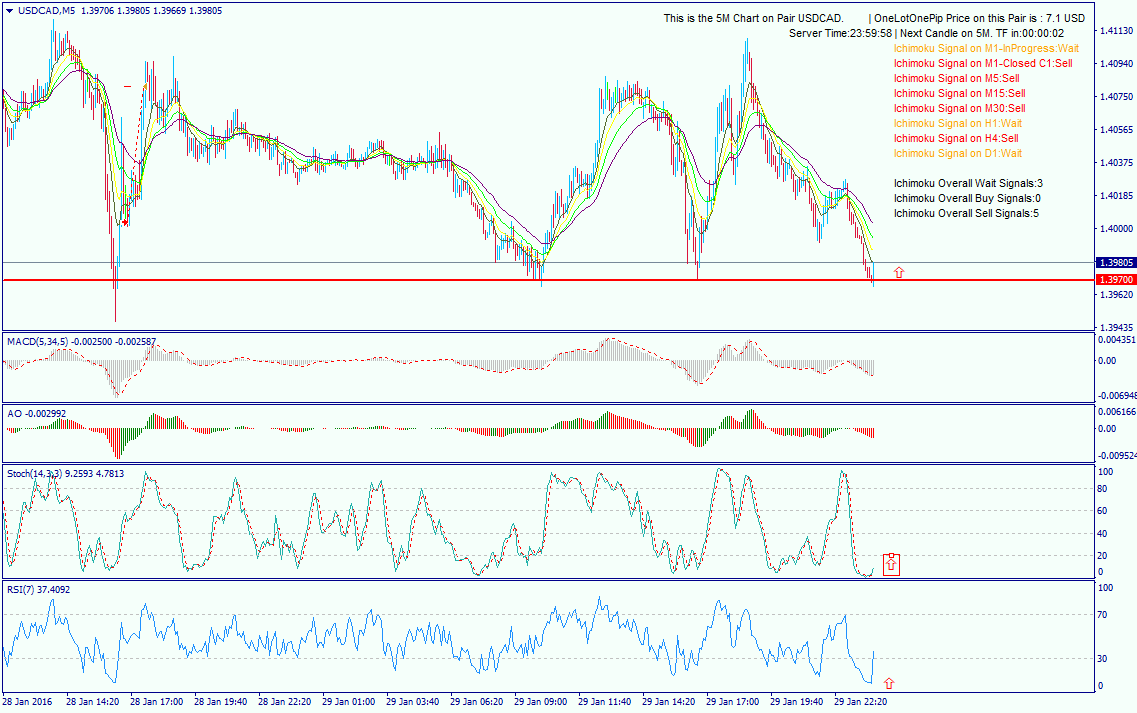
I have updated the Ichimoku MTF Analyzer to Version 1.04
some of the changes are :
1-added Display location seletion settings ,
2-colors for signals ,
3-analysis for m1 open candle ( in progress candle )
4-option to show/hide ichimoku details.
5-time to the completion of last candle and opening of next candle.
and some other changes.
some of the changes are :
1-added Display location seletion settings ,
2-colors for signals ,
3-analysis for m1 open candle ( in progress candle )
4-option to show/hide ichimoku details.
5-time to the completion of last candle and opening of next candle.
and some other changes.

Farzin Sadeghi Bonjar
Produto publicado

This is a multi-timeframe Ichimoku Kinko Hyo signal analyzer indicator. As you know, Ichimoku consists of 5 lines (Tenkan-sen, Kijun-sen, Chikou Span, Senkou Span A & B which create the Kumo Cloud). Ichimoku is a simple indicator like Moving Average, but the method they use makes it a very good tool in detecting market conditions and trend with which you can open trades in the best location and stay in the trade till the most profitable price. As this indicator has lots of lines and we
Farzin Sadeghi Bonjar
2016.02.07
Uploaded version 1.07 of this indicator with lots of new features such as ranging detection and 2 different signs on chart , for M1 scalping and Daily and lower TimeFrames Major trend signals on chart.
Farzin Sadeghi Bonjar
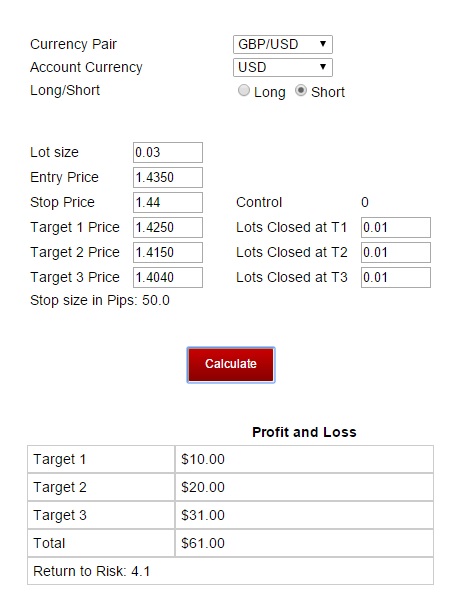
my trade plan for gbpusd pullback
follow us on telegram : https://telegram.me/FXCOFOREX
follow us on telegram : https://telegram.me/FXCOFOREX

Farzin Sadeghi Bonjar
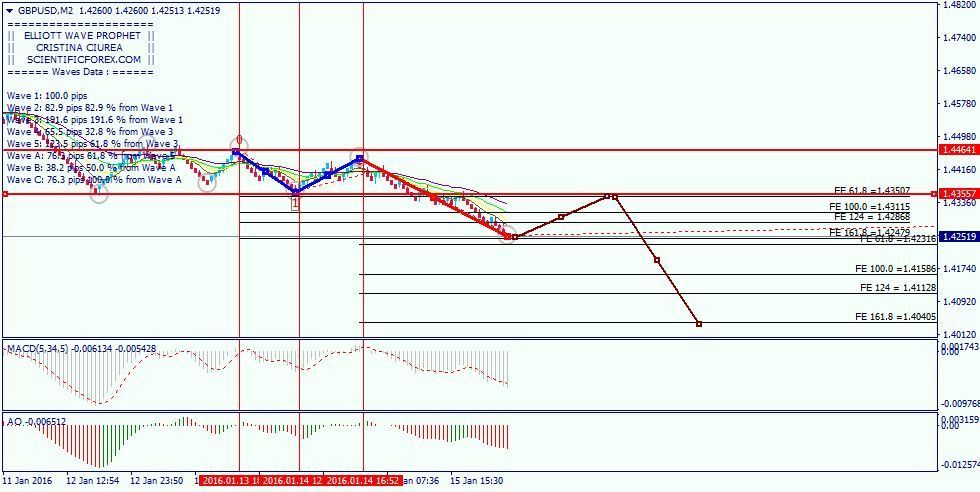
My Elliot wave counting on GbpUsd Renko ,
It seems that GbpUsd is on the last move for the wave 3 , and it will pullback from the current downtrend and recover/grow to 1.4350 before continuing the wave 5 of the downtrend... lets see what happens.
It seems that GbpUsd is on the last move for the wave 3 , and it will pullback from the current downtrend and recover/grow to 1.4350 before continuing the wave 5 of the downtrend... lets see what happens.

Farzin Sadeghi Bonjar
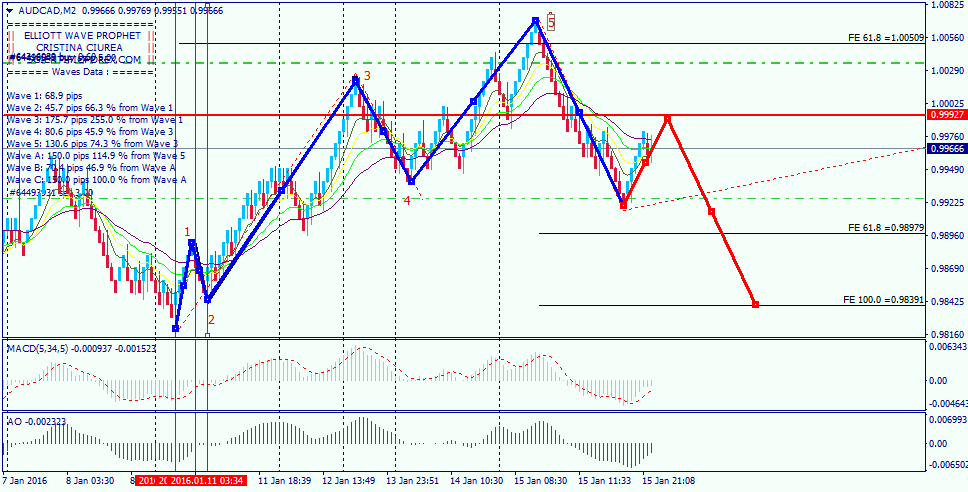

My Elliot wave counting on AudCad Renko which fits quite well with AO and Fibo Extention.
Lets wait and see what happens...
Persian :
شمارش موج الیوت دلار استرالیا به کانادا که به خوبی با ضرایب فیبوناچی اکستنشن هم همخوانی دارد . ببینیم چی میشه
follow us on telegram : https://telegram.me/FXCOFOREX
Lets wait and see what happens...
Persian :
شمارش موج الیوت دلار استرالیا به کانادا که به خوبی با ضرایب فیبوناچی اکستنشن هم همخوانی دارد . ببینیم چی میشه
follow us on telegram : https://telegram.me/FXCOFOREX

Farzin Sadeghi Bonjar
2016.01.30
this signal happened in 10 days on 01.27 price reached 0.9850
https://charts.mql5.com/10/46/audcad-m2-fbs-inc-2-weeks-ago-az-01-17-i-forcasted-the-sell.png
https://charts.mql5.com/10/46/audcad-m2-fbs-inc-2-weeks-ago-az-01-17-i-forcasted-the-sell.png
:
