Shao Chen / Perfil
- Informações
|
5+ anos
experiência
|
12
produtos
|
136
versão demo
|
|
17
trabalhos
|
1
sinais
|
0
assinantes
|
https://www.mql5.com/en/market/product/37563

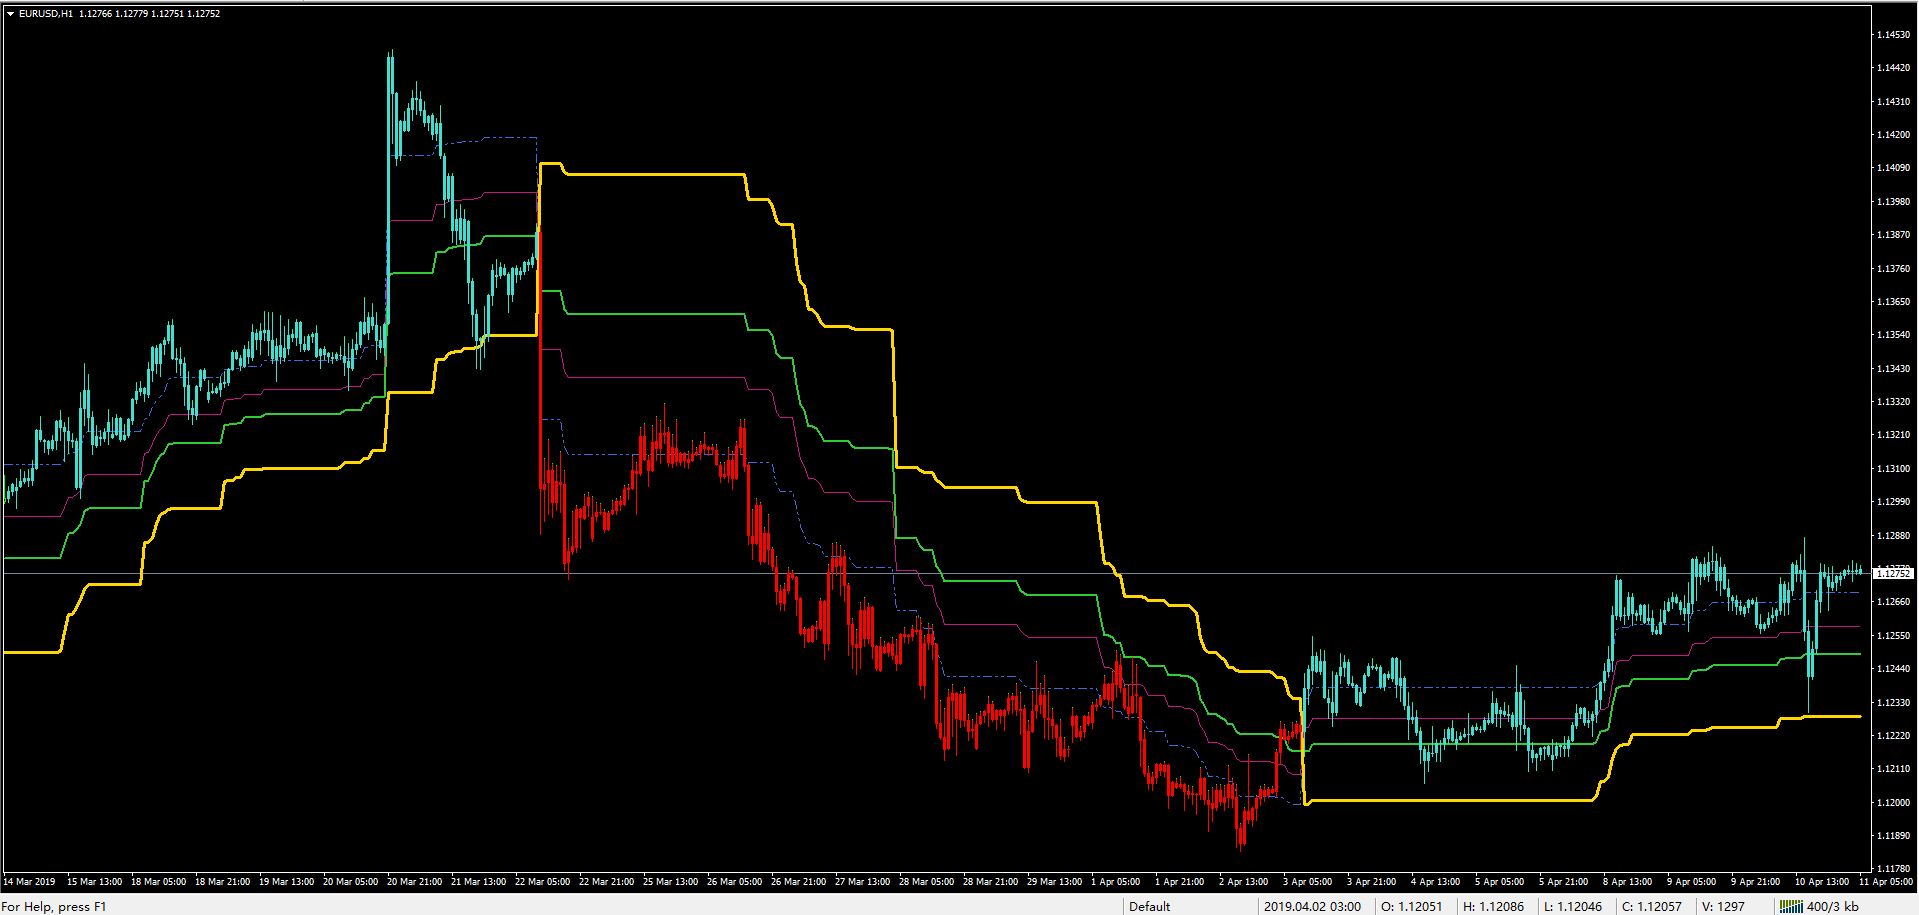
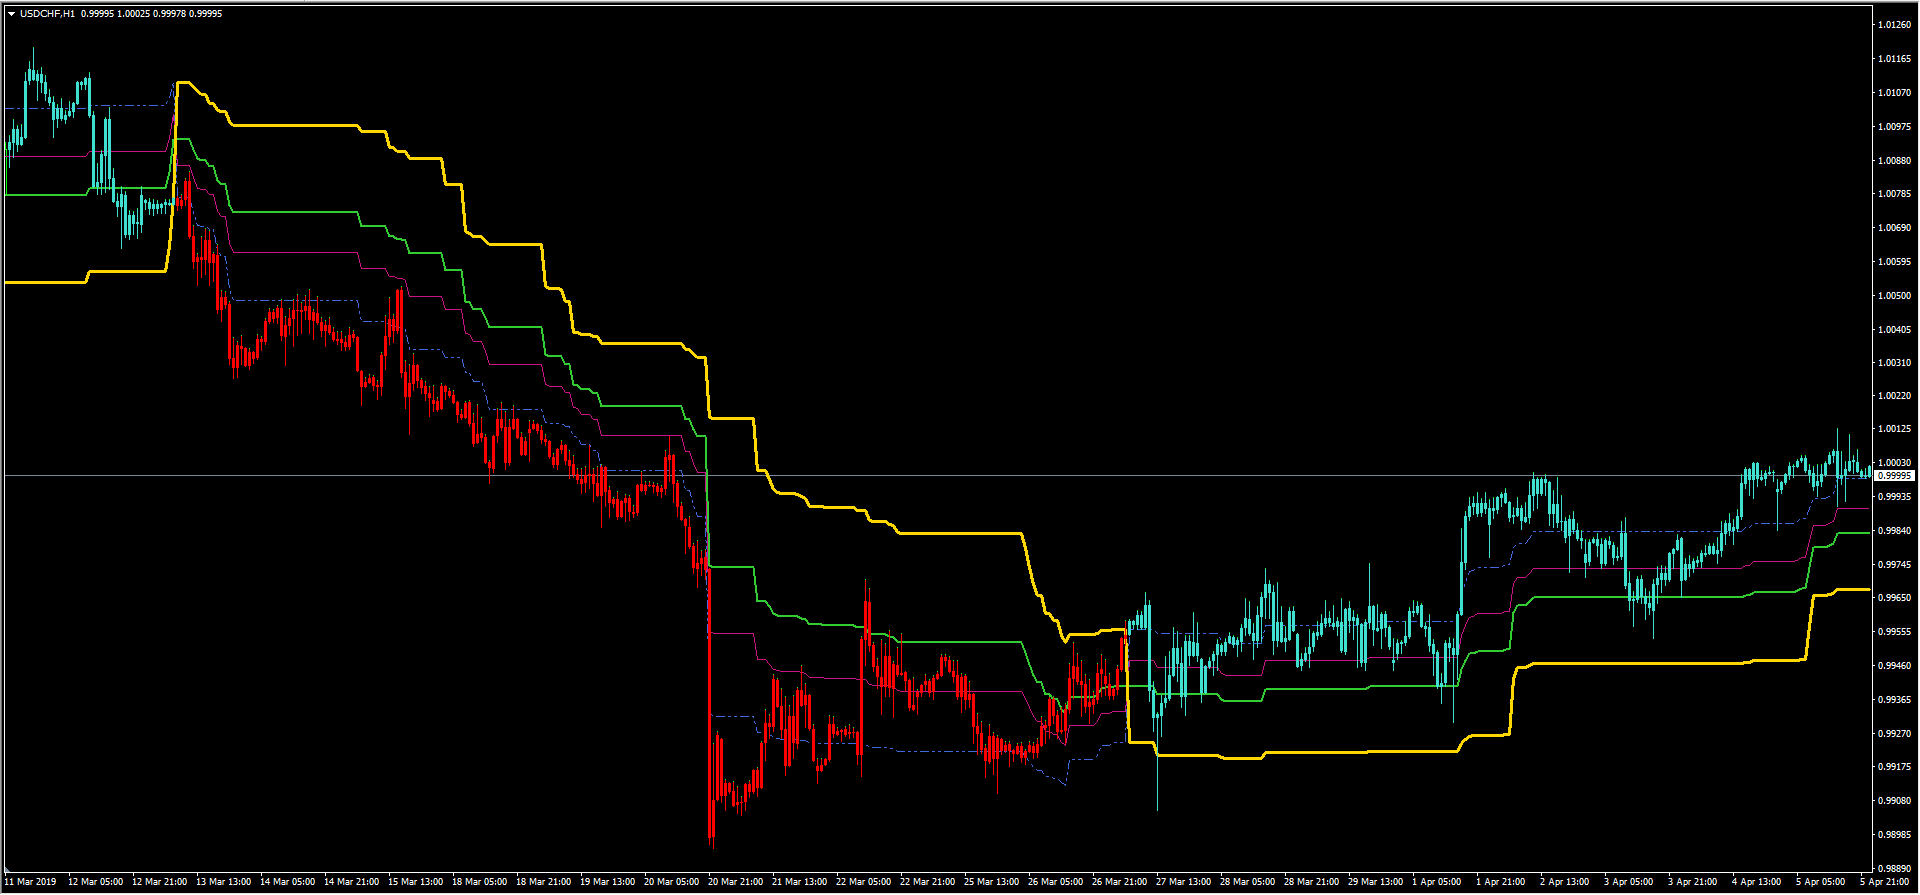
The Feibo Trender is a trend tracking indicator based on the Feibo section calculation. 1.The price is in an upward trend and candles turn blue .The price is in a downward trend and candles turn red . 2.The segmented areas of the channel are identified by lines of different colors that can as support or pressure reference locations . 3.The price broke through the yellow line, which marked the trend reversal. The indicator parameters can be customized and the settings are simple. If you have any
The Power calculates the strength of the long and short forces by the ratio of the price breakthrough to the average amplitude of the previous market. When the intensity is strong, the signal appears on the chart to estimate the direction of the next wave. There is no future function for the indicator. All signals will not move or disappear after they appear, and have a good real-world reference value. The indicator parameters allow the user to make individual adjustments. More EA and Indicators
欢迎了解这款趋势指标,可通过周期叠加判断行情何时会反转,从而在最有利的位置入场,获得先机
https://www.mql5.com/zh/market/product/36513

This is a trend-tracking indicator that determines the change in trend through changes in color. It can capture the big trend market and assist trend traders to enter and hold positions. A small rebound in the market will be filtered until the end of the trend. In the turbulent market, the horizontal line in the indicator can also be used as a support or pressure reference. More EA&Indicators click here https://www.mql5.com/en/users/chenshaofei/seller parameter Period - indicator period
This product is a multi-functional MT4 indicator and is an indispensable tool for account information statistics, strategy analysis and risk assessment. Functions: 1. Statistical account basic information of profit and loss . 2. Statistics and display the account profit and loss fund curve. 3. Display the order's track on chart ,so that we can analys the strategy and risk of the account. 4 .List account's trade pairs and order totals ,we also can see the profits of each pair. If you have any


