Aleksey Ivanov / Perfil
- Informações
|
7+ anos
experiência
|
32
produtos
|
143
versão demo
|
|
0
trabalhos
|
0
sinais
|
0
assinantes
|
👑 Físico teórico, programador, comerciante com 15 anos de experiência.
--------------------------------------------------------------------------------------
💰 Produtos apresentados:
1) 🏆 Indicadores com ótima filtragem de ruídos de mercado (para escolha de pontos de abertura e fechamento de posições).
2) 🏆 Indicadores estatísticos (para determinar a tendência global).
3) 🏆 Indicadores de pesquisa de mercado (para esclarecer a microestrutura de preços, construir canais, identificar diferenças entre reversões e retrações de tendências).
--------------------------------------------------------------------------------------
☛ Mais informações no blog https://www.mql5.com/en/blogs/post/741637
--------------------------------------------------------------------------------------
💰 Produtos apresentados:
1) 🏆 Indicadores com ótima filtragem de ruídos de mercado (para escolha de pontos de abertura e fechamento de posições).
2) 🏆 Indicadores estatísticos (para determinar a tendência global).
3) 🏆 Indicadores de pesquisa de mercado (para esclarecer a microestrutura de preços, construir canais, identificar diferenças entre reversões e retrações de tendências).
--------------------------------------------------------------------------------------
☛ Mais informações no blog https://www.mql5.com/en/blogs/post/741637
Aleksey Ivanov
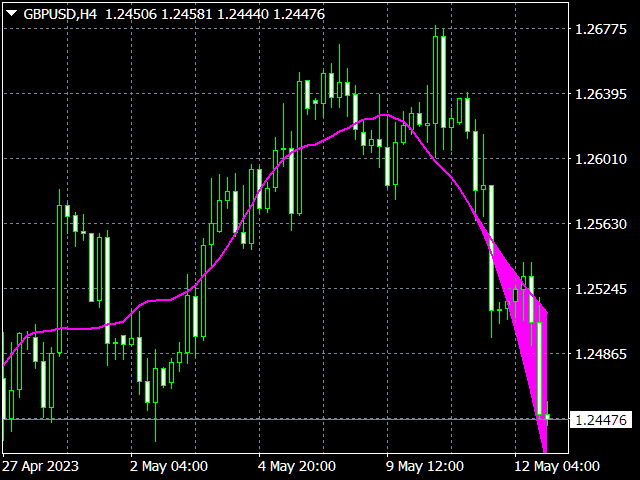
Estimation moving average without lag https://www.mql5.com/en/market/product/36945
A simple moving average (SMA) with an averaging period (2n + 1) of bars is always obtained lagging by n bars. If SMA or other types of moving averages are the basis for making trading decisions, then their strong delay does not allow to open positions in time and close positions, which leads to losses.
The Estimation moving average without lag indicator calculates an estimate of a non-lagging moving average and displays the corresponding confidence interval.
✔️The algorithms of this indicator are unique and developed by their author
Author Aleksey Ivanov https://www.mql5.com/en/users/60000382

Aleksey Ivanov
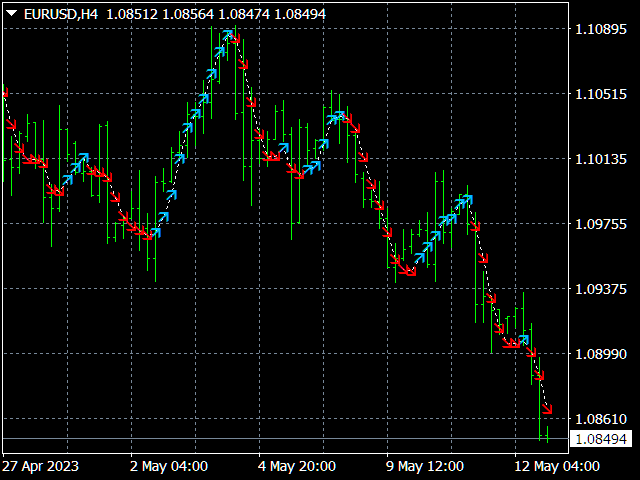
Iterative Moving Average https://www.mql5.com/en/market/product/31714
Iterative Moving Average – IMA. IMA is obtained by correcting the usual MA. The correction consists in addition to MA averaged difference between the time series (X) and its MA, i.e. IMA(X)=MA(X) + MA (Х-MA(X)). Correction is done in several iterations (and, exactly, 2 iterations in this indicator) and with a change in the averaging period.
As a result, the time-series points begin to cluster around (on all sides) of the getting IMA and with a smaller delay than around the usual MA. Therefore, IMA is a more effective tool for manual and automatic trading than all types of conventional MA (SMA, EMA, SSMA, LMA).
✔️The algorithms of this indicator are unique and developed by their author
Author Aleksey Ivanov https://www.mql5.com/en/users/60000382

Aleksey Ivanov

Signal Bands https://www.mql5.com/en/market/product/29171
Signal Bands is a sensitive and convenient indicator, which performs deep statistical processing of information. It allows to see on one chart (1) the price trend, (2) the clear price channel and (3) latent signs of trend change. The indicator can be used on charts of any periods, but it is especially useful for scalping due to its high sensitivity to the current market state.
✔️The indicator has all types of alerts.
✔️The indicator does not redraw.
✔️The algorithms of this indicator are unique and developed by their author
Author Aleksey Ivanov https://www.mql5.com/en/users/60000382

Aleksey Ivanov
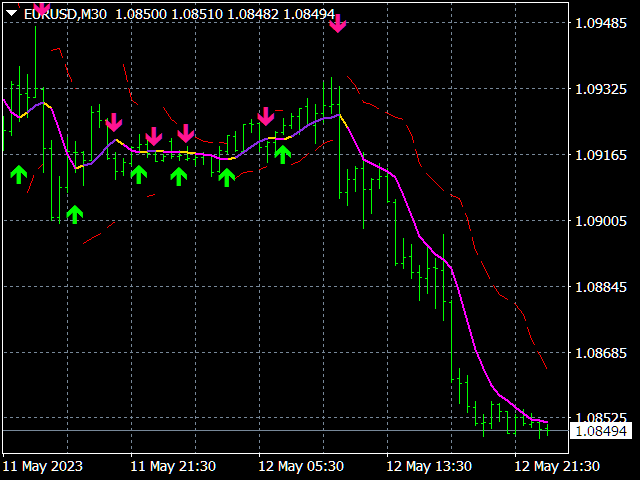
Robust filter https://www.mql5.com/en/market/product/52668
The Robust filter indicator is based on the robust filtering algorithm developed by the author using the multi-period averaged moving median.
The indicator calculates and shows:
✔️1. The direction of the trend;
✔️2. Entry and exit points of positions;
✔️3. StopLoss lines calculated from current price probability distributions and selected probability of closing an order by StopLoss before the trend reversal;
✔️4. Lot sizes based on the accepted risk level, deposit size and StopLoss position.
============================================================
✔️The indicator has all kinds of alerts.
✔️The indicator does not redraw.
✔️The indicator can be used both for trading scalper strategies and for long-term trading strategies.
Author Aleksey Ivanov https://www.mql5.com/en/users/60000382

Aleksey Ivanov
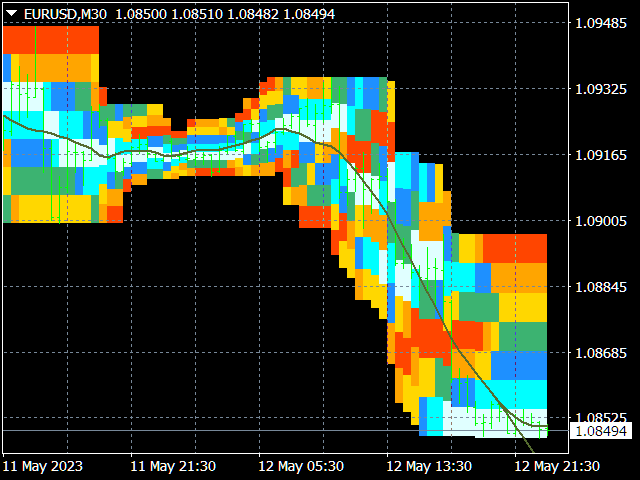
Probabilities distribution of price https://www.mql5.com/en/market/product/27070
Indicator is used for:
1. defining price probability distributions. This allows for a detailed representation of the channel and its borders and forecast the probability of a price appearing at each segment of its fluctuations;
2. defining the channel change moment.
✔️The algorithms of this indicator are unique and developed by their author
✔️ It has built-in management
Author Aleksey Ivanov https://www.mql5.com/en/users/60000382

Aleksey Ivanov

Prof MACD (MT5) https://www.mql5.com/en/market/product/65276
✔️ One of my most profitable indicators with optimal filtering.
✔️The algorithms of this indicator are unique and developed by their author
✔️The indicator has all kinds of alerts.
✔️ The indicator does not redraw.
Author Aleksey Ivanov https://www.mql5.com/en/users/60000382
✔️ One of my most profitable indicators with optimal filtering.
✔️The algorithms of this indicator are unique and developed by their author
✔️The indicator has all kinds of alerts.
✔️ The indicator does not redraw.
Author Aleksey Ivanov https://www.mql5.com/en/users/60000382

Aleksey Ivanov
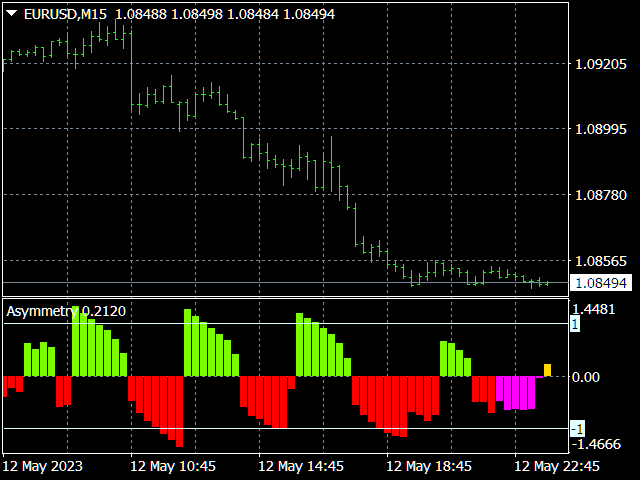
Asummetry https://www.mql5.com/en/market/product/40005
The Asummetry indicator allows you to predict the beginning of a change in the direction of trends, long before their visual appearance on the price chart.
✔️The algorithms of this indicator are unique and developed by their author
Author Aleksey Ivanov https://www.mql5.com/en/users/60000382
The Asummetry indicator allows you to predict the beginning of a change in the direction of trends, long before their visual appearance on the price chart.
✔️The algorithms of this indicator are unique and developed by their author
Author Aleksey Ivanov https://www.mql5.com/en/users/60000382

Aleksey Ivanov
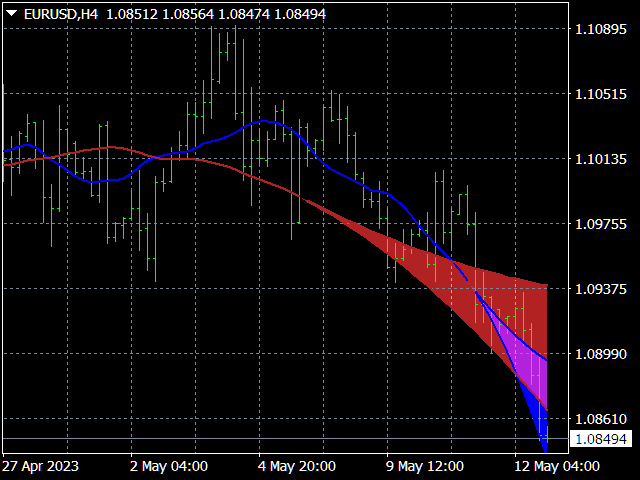
Strong Trend Flat Signal https://www.mql5.com/en/market/product/37203
The Strong Trend Flat Signal indicator is the intersection of two, developed by the author, non-lagging moving averages with averaging periods 21 and 63.
✔️The algorithms of this indicator are unique and developed by their author
Author Aleksey Ivanov https://www.mql5.com/en/users/60000382
The Strong Trend Flat Signal indicator is the intersection of two, developed by the author, non-lagging moving averages with averaging periods 21 and 63.
✔️The algorithms of this indicator are unique and developed by their author
Author Aleksey Ivanov https://www.mql5.com/en/users/60000382

Aleksey Ivanov
Friends! What we see on the price charts as a trend is often not a trend, but arises as a result of the imposition of a large number of unidirectional price jumps, i.e. is a purely random occurrence. Such pseudo-trends especially often occur on small timeframes, where the level of noise is very high against the background of a weak regular price movement. And you can win on such random false trends only by chance. Therefore, following such false trends, as a rule, leads to losses. My indicators were designed to filter out such noise, which is not an easy task. For more information about this phenomenon and how to identify it, see the blog «True and illusory currency market trends” https://www.mql5.com/en/blogs/post/740838
Aleksey Ivanov
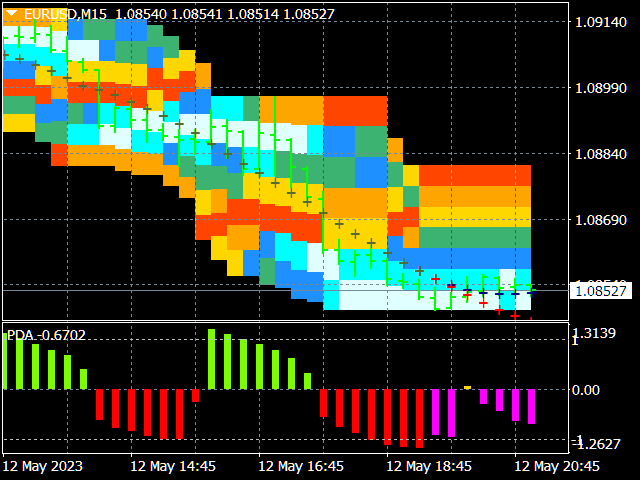
Probability distribution PRO https://www.mql5.com/en/market/product/41174
Indicator is used for:
1. defining price probability distributions. This allows for a detailed representation of the channel and its borders and forecast the probability of a price appearing at each segment of its fluctuations;
2. defining the channel change moment.
✔️The algorithms of this indicator are unique and developed by their author
Author Aleksey Ivanov https://www.mql5.com/en/users/60000382

Aleksey Ivanov

Signal Envelopes https://www.mql5.com/en/market/product/46593
The Signal Envelopes indicator uses the robust filtering method based on: (1) the moving median Buff0 = < Median> = (Max {x} + Min {x}) / 2 and (2) the averaging algorithm developed by the author Buff1 = <( ) ^ (- 3)> * ( ) ^ 4 based on the moving median. The Signal Envelopes indicator allows you to most accurately and with the minimum possible delay set the beginning of a new trend. The Signal Envelopes indicator can be used both for trading according to scalper strategies, and when using long-term trading strategies.
✔️The indicator has all kinds of alerts.
✔️ The indicator does not redraw
✔️The algorithms of this indicator are unique and developed by their author
Author Aleksey Ivanov https://www.mql5.com/en/users/60000382

Aleksey Ivanov
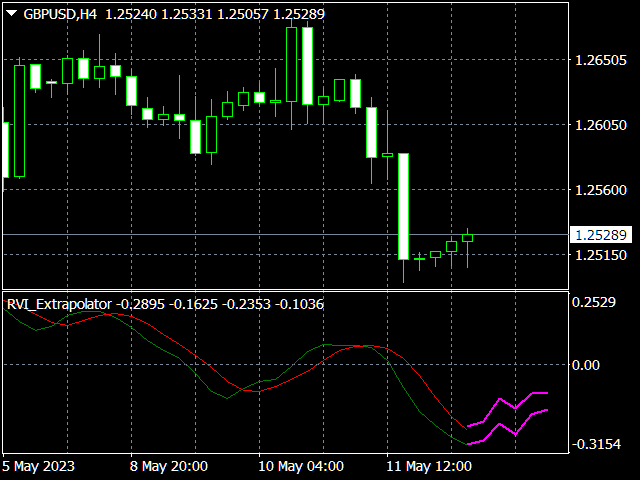
RVI Extrapolator https://www.mql5.com/en/market/product/81184
The indicator predicts the future values of the Relative Vigor Index indicator, which allows you to use this indicator much more efficiently.
The market has a very short memory; in any case, the information that formally describes it quickly becomes obsolete and loses its weight in the formation of the current price. Therefore, wavelet analysis is the most promising for predicting future market parameters. The author uses a number of wavelet functions (including the Morlet wavelet and a somewhat modified Gaussian function, which are shown in the last screenshot), the expansion by which, with a sufficient degree of reliability, allows extrapolating future values of oscillator indicators.
Author Aleksey Ivanov https://www.mql5.com/en/users/60000382

Aleksey Ivanov

Signal Channel https://www.mql5.com/en/market/product/50988
The Signal Channel indicator uses a robust filtering method based on two moving medians applicable to the High and Low prices, i.e. the lines and , where <..> is the sign of linear averaging, which are shifted by certain values in an uptrend and by opposite values in a downtrend, which allows you to get a narrow channel, approximately outlining each bar. Sharp kinks of the lines of such a channel allow the most accurate and minimal possible delay to establish the beginning of a new trend movement. The possible change in the direction of the trend is also indicated by sharp narrowing of the channel lines, which, in fact, is expressed by the fall in volatility. The indicator also has an additional filtering function, upon activation of which the signal is identified only after a decrease in volatility, which makes the indicator more reliable. In addition to the main channel, inside which the most probable price fluctuations occur, an auxiliary channel is built (in dashed lines), beyond the borders of which the price does not go anymore, which serves to set stoplosses on it.
✔️ The Signal Channel indicator can be used both for trading according to scalper strategies, and when using long-term trading strategies.
✔️ It has built-in management
✔️ The indicator has all types of alerts.
✔️ The indicator does not redraw.
✔️ One of the best indicators with optimal market noise filtering.
Author Aleksey Ivanov https://www.mql5.com/en/users/60000382

Aleksey Ivanov

Absolute Bands FREE https://www.mql5.com/en/market/product/33826
The Absolute Bands indicator is reminiscent of the Bollinger Bands indicator with its appearance and functions, but only more effective for trading due to the significantly smaller number of false signals issued to them. This effectiveness of the Absolute Bands indicator is due to its robust nature.
✔️ One of the best indicators with optimal market noise filtering.
Author Aleksey Ivanov https://www.mql5.com/en/users/60000382

Aleksey Ivanov
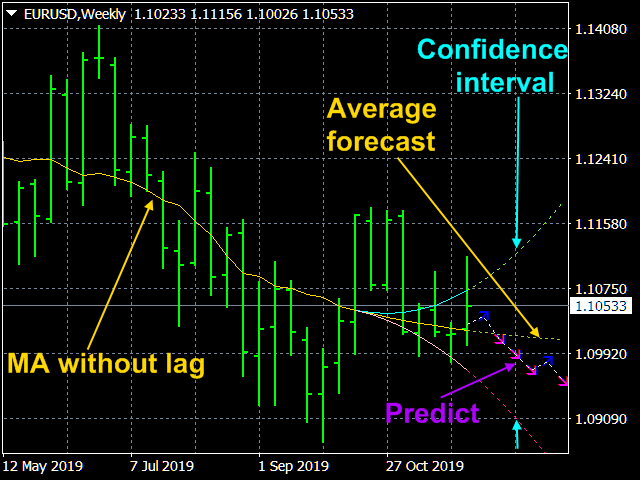
StatPredict https://www.mql5.com/en/market/product/38721
✔️The indicator predicts the price in accordance with the prevailing trend and its own small statistical price fluctuations around this trend. Using mathematical methods for predicting random processes, StatPredict indicator predicts the most probable values of the future price and calculates the confidence interval for them.
✔️StatPredict also provides the option to calculate the lot, based on the positions of the last points of the calculated channel of confidence probability, as well as the size of the deposit and the allowable risk, which are specified in the indicator settings.
✔️The algorithms of this indicator are unique and developed by their author
Author Aleksey Ivanov https://www.mql5.com/en/users/60000382

Aleksey Ivanov
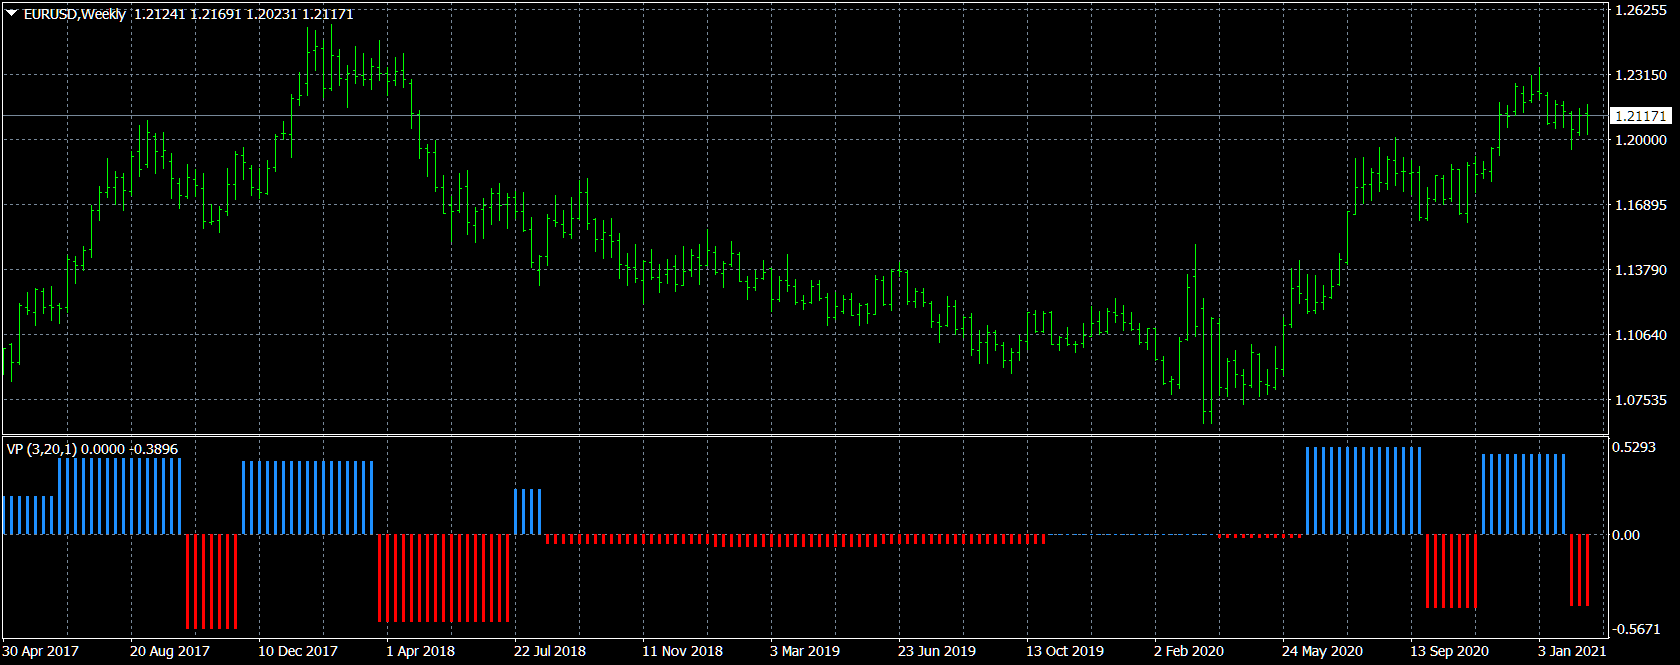
Velocity of price change https://www.mql5.com/en/market/product/62315
The Velocity of price change indicator shows the average rate of price change at those characteristic time intervals where this rate was approximately constant. The robust algorithm used in Velocity of price change to smooth out the price from its random jumps, ensures the reliability of the indicator reading, which does not react to simple price volatility and its insignificant movements.
✔️The algorithms of this indicator are unique and developed by their author
Author Aleksey Ivanov https://www.mql5.com/en/users/60000382

Aleksey Ivanov
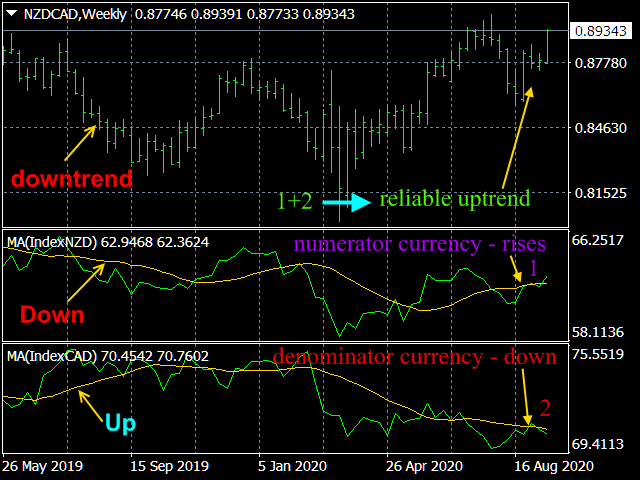
Absolute price https://www.mql5.com/en/market/product/54630
✔️ This indicator is intended for professionals assessing fundamental market trends. This indicator calculates the index of any instrument and analyzes it.
✔️ The indicator has modes for analyzing the indices themselves, namely: Moving Average; Relative Strength Index; Momentum; Commodity Channel Index; Bollinger Bands; Envelopes.
Author Aleksey Ivanov https://www.mql5.com/en/users/60000382

Aleksey Ivanov
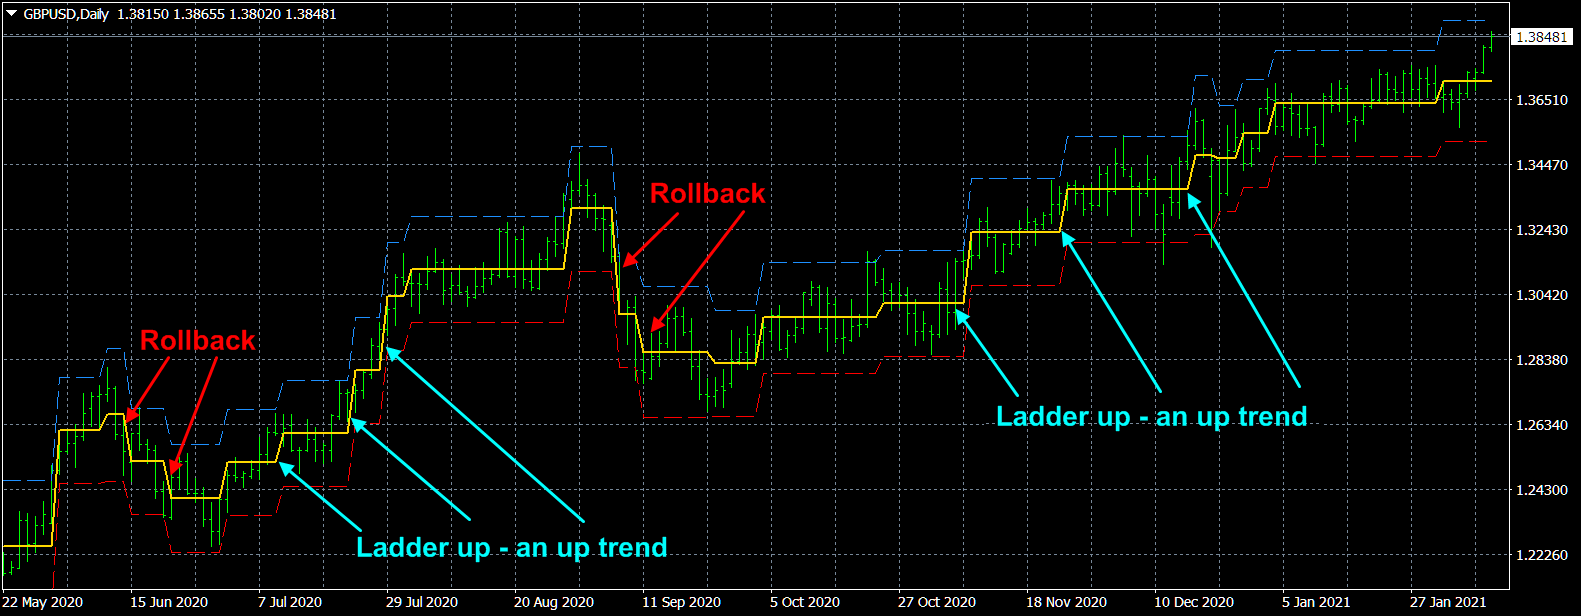
TrueChannel FREE https://www.mql5.com/en/market/product/61769
The TrueChannel indicator shows us the true price movement channels. This indicator resembles Donchian Channel in its appearance, but is built on the basis of completely different principles and gives (in comparison with Donchian Channel, which is better just to use to assess volatility) more adequate trading signals.
✔️The algorithms of this indicator are unique and developed by their author
Author Aleksey Ivanov https://www.mql5.com/en/users/60000382

Aleksey Ivanov
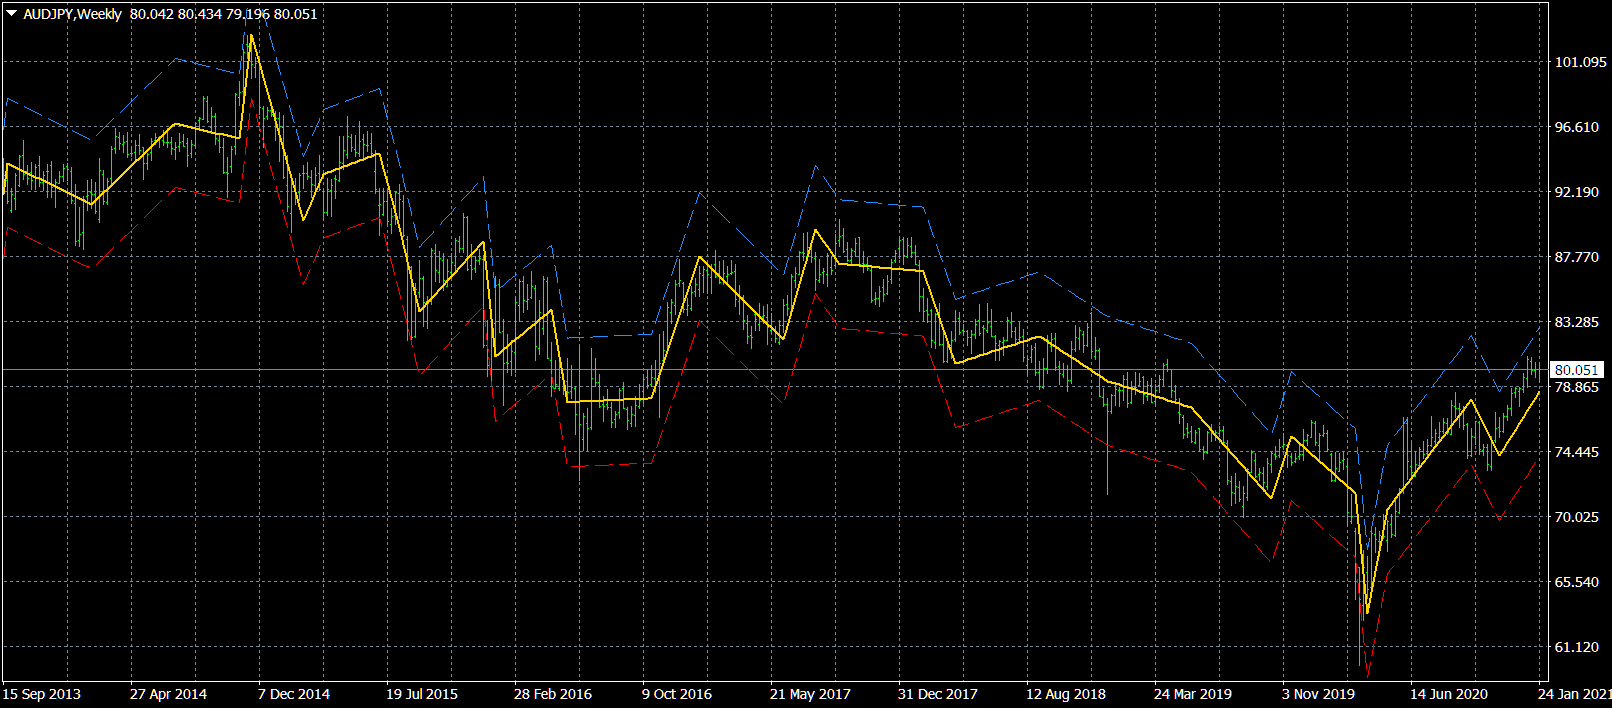
StatZigZag FREE https://www.mql5.com/en/market/product/61091
✔️The algorithms of this indicator are unique and developed by their author
✔️ The StatZigZag indicator also builds a channel of maximum price fluctuations around the broken regression line, on the lower (red) line of which you can set StopLoss for buy orders, and on the upper (blue) line - StopLoss for sell orders.
Author Aleksey Ivanov https://www.mql5.com/en/users/60000382

Aleksey Ivanov
Friends, I am a theoretical physicist and a trader, mathematically rigorously studying market processes, aspects of which I have already begun to present in my articles. https://www.mql5.com/en/articles/10955
https://www.mql5.com/en/articles/11158
Based on a rigorous theory, I have developed indicators with optimal market noise filtering for trading. https://www.mql5.com/en/blogs/post/741637
However, it should be emphasized that a trader (investor) should choose the direction of his positions on the basis of fundamental analysis, and correctly applied indicators of optimal filtering of market noise should be only its auxiliary tool. These indicators are used to determine:
(1) market entry points are determined,
(2) the positions of stop-loss and profit and their order (time and number of points) of movement are determined,
(3) determine the size of the opened lots (calculated through money management built into the work of many indicators presented here).
I emphasize that for today's highly volatile market, these (1-3) statistically calculated parameters of the game are also (like fundamental analysis) key, in the sense that without them it will be generally impossible to get a stable profit.
Subscribe to my channel and you will be aware of my latest developments in the field of trading
https://www.mql5.com/en/channels/statlab
: