Real SMC same with Lux method for MT5
- Indicadores
- Minh Truong Pham
- Versão: 2.2
- Atualizado: 10 abril 2024
- Ativações: 5
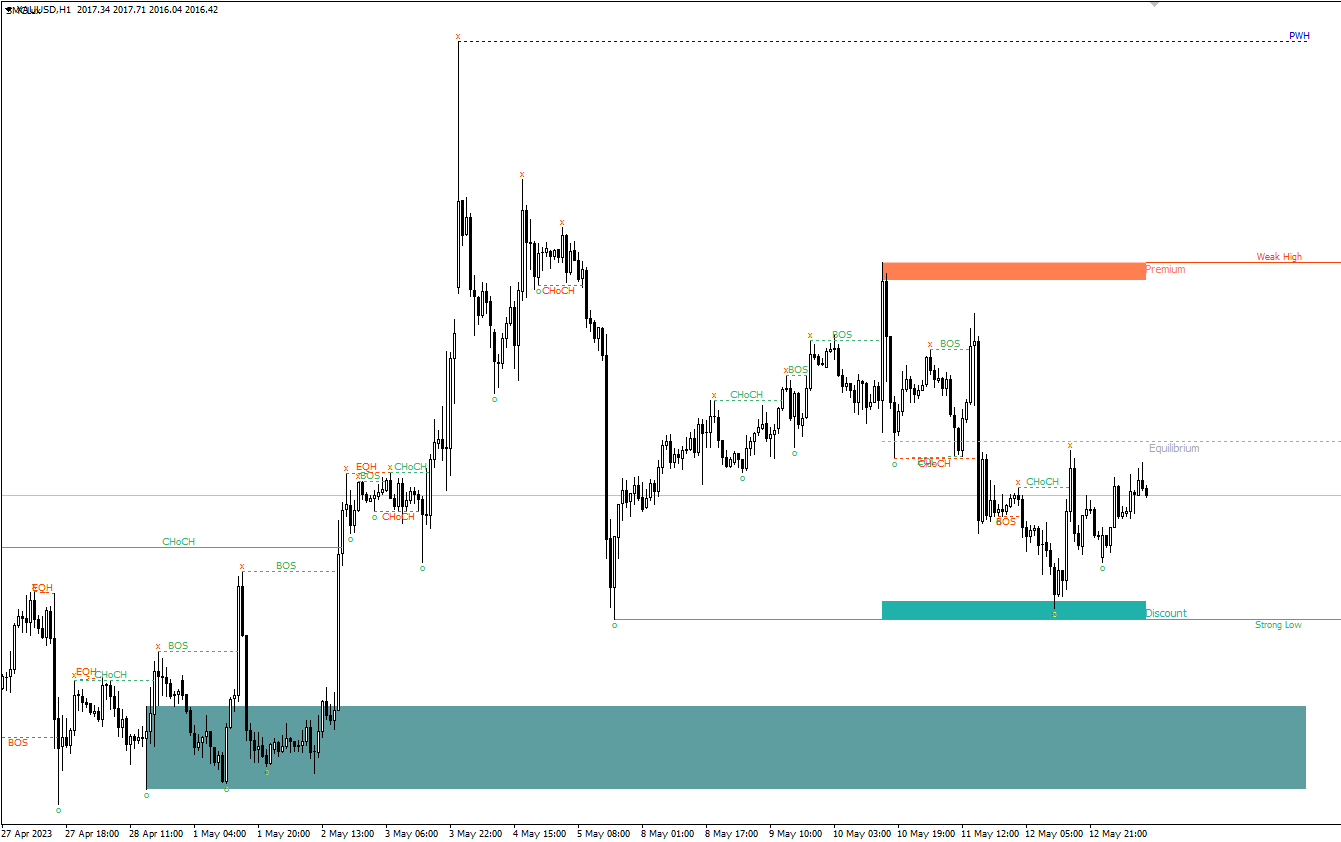
This all-in-one indicator displays real-time market structure (internal & swing BOS / CHoCH), order blocks, premium & discount zones, equal highs & lows, and much more...allowing traders to automatically mark up their charts with widely used price action methodologies. Following the release of our Fair Value Gap script, we received numerous requests from our community to release more features in the same category.
"Smart Money Concepts" (SMC) is a fairly new yet widely used term amongst price action traders looking to more accurately navigate liquidity & find more optimal points of interest in the market. Trying to determine where institutional market participants have orders placed (buy or sell side liquidity) can be a very reasonable approach to finding more practical entries & exits based on price action.
//------------------------------------//
Version 1.x has missing functions
+ PDArray tracking (created, mitigated, filled)
+ Information about Premium, Discount PDArray
+ Setting for notifications and different notification methods
So I updated version 2.x adding these functions:
1. Add option to extend recent top to last bar
2. Extend valid OB to curent; Style and display name of OB (in settings); Seperate Premium/Discount OB by swing length
3. Extend valid FVG to curent; Style and display name of FVG (in settings); Seperate Premium/Discount FVG by swing length
4. Extend PMhl, PWhl, PDhl to curent;
5. Add alert settings
//------------------------------------//
The indicator includes alerts for the presence of swing structures and many other relevant conditions.
Features
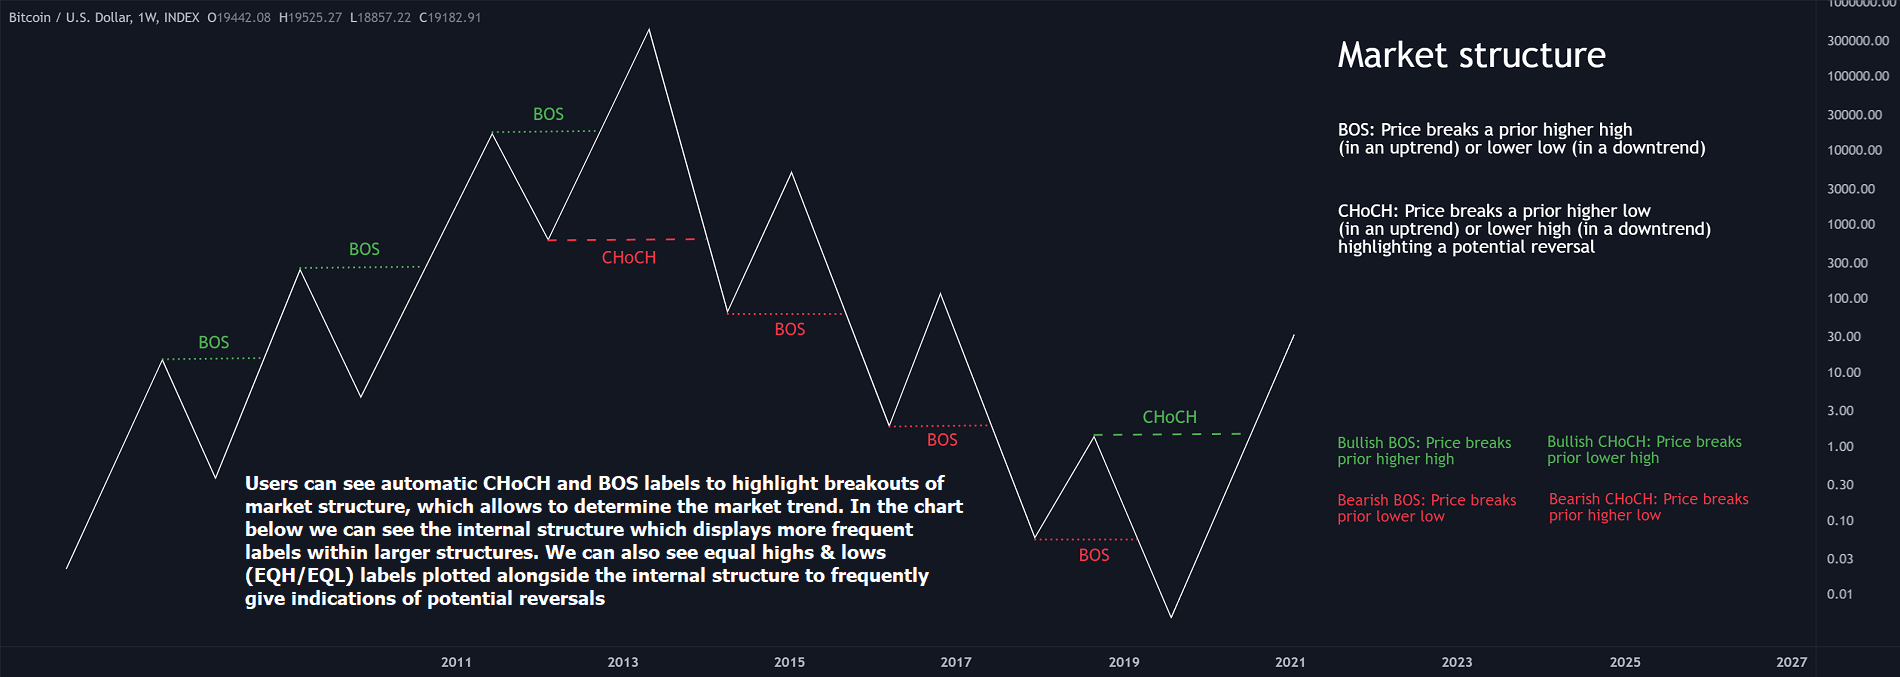
- Full internal & swing market structure labeling in real-time
- Break of Structure (BOS)
- Change of Character (CHoCH)
- Order Blocks (bullish & bearish)
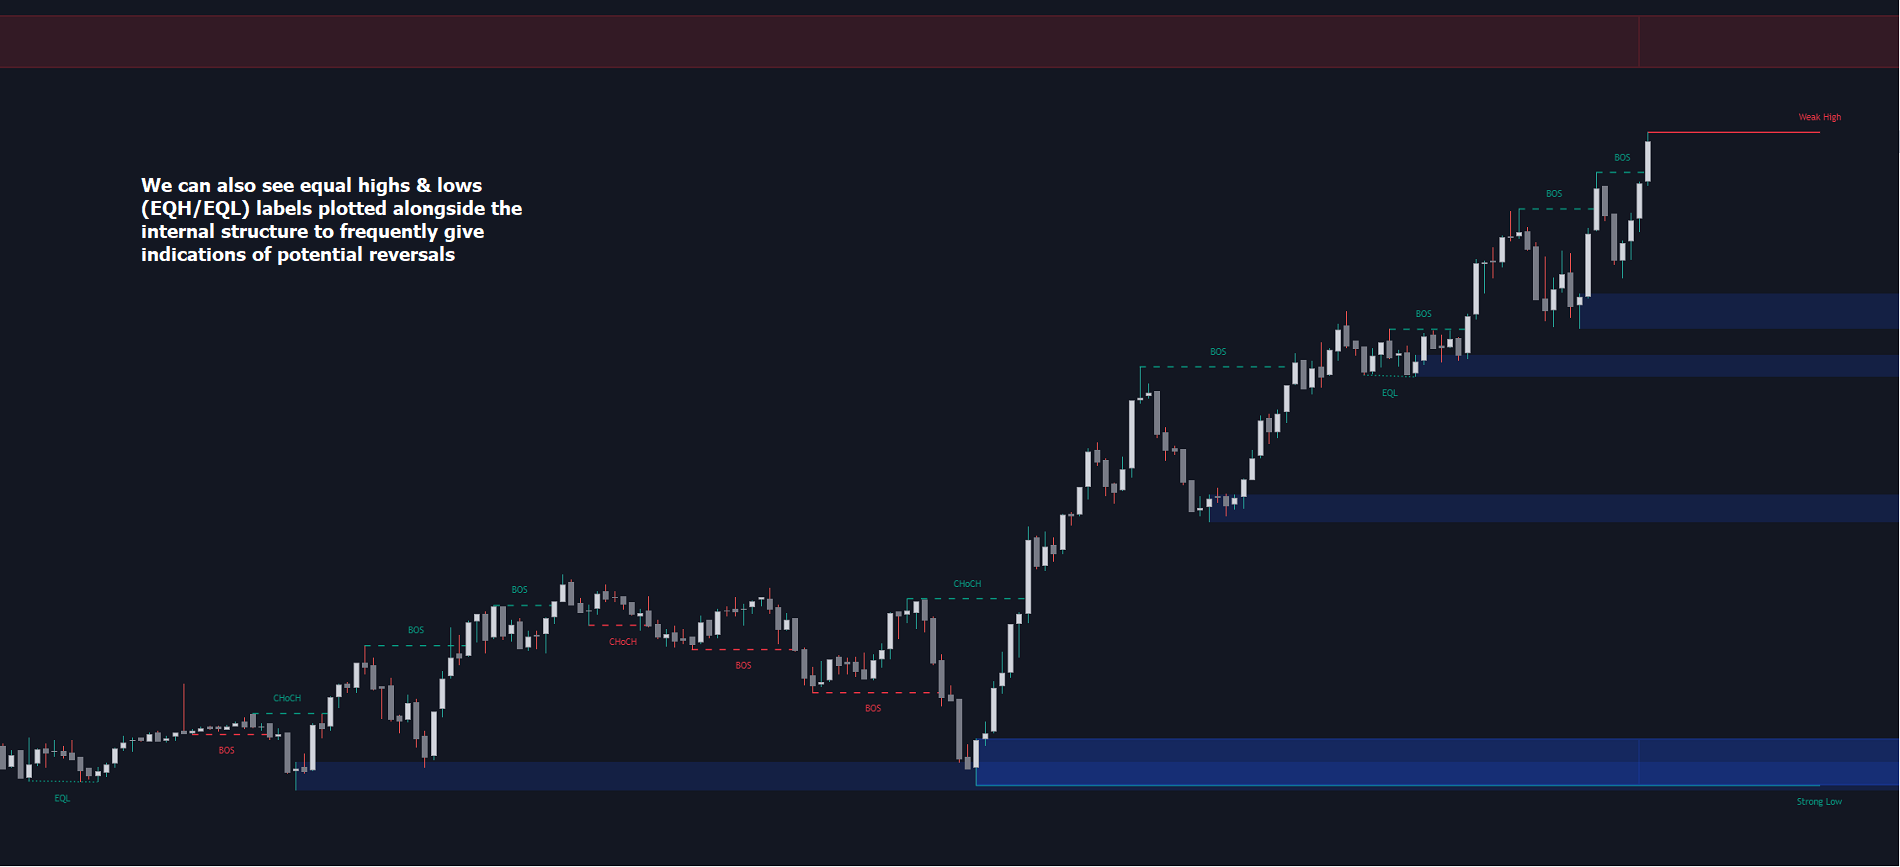
- Equal Highs & Lows
- Fair Value Gap Detection
- Previous Highs & Lows
- Premium & Discount Zones as a range
- Options to style the indicator to more easily display these concepts
- Mode: Allows the user to select Historical (default) or Present, which displays only recent data on the chart.
- Style: Allows the user to select different styling for the entire indicator between Colored (default) and Monochrome.
- Internal Structure: Displays the internal structure labels & dashed lines to represent them. (BOS & CHoCH).
- Confluence Filter: Filter non-significant internal structure breakouts.
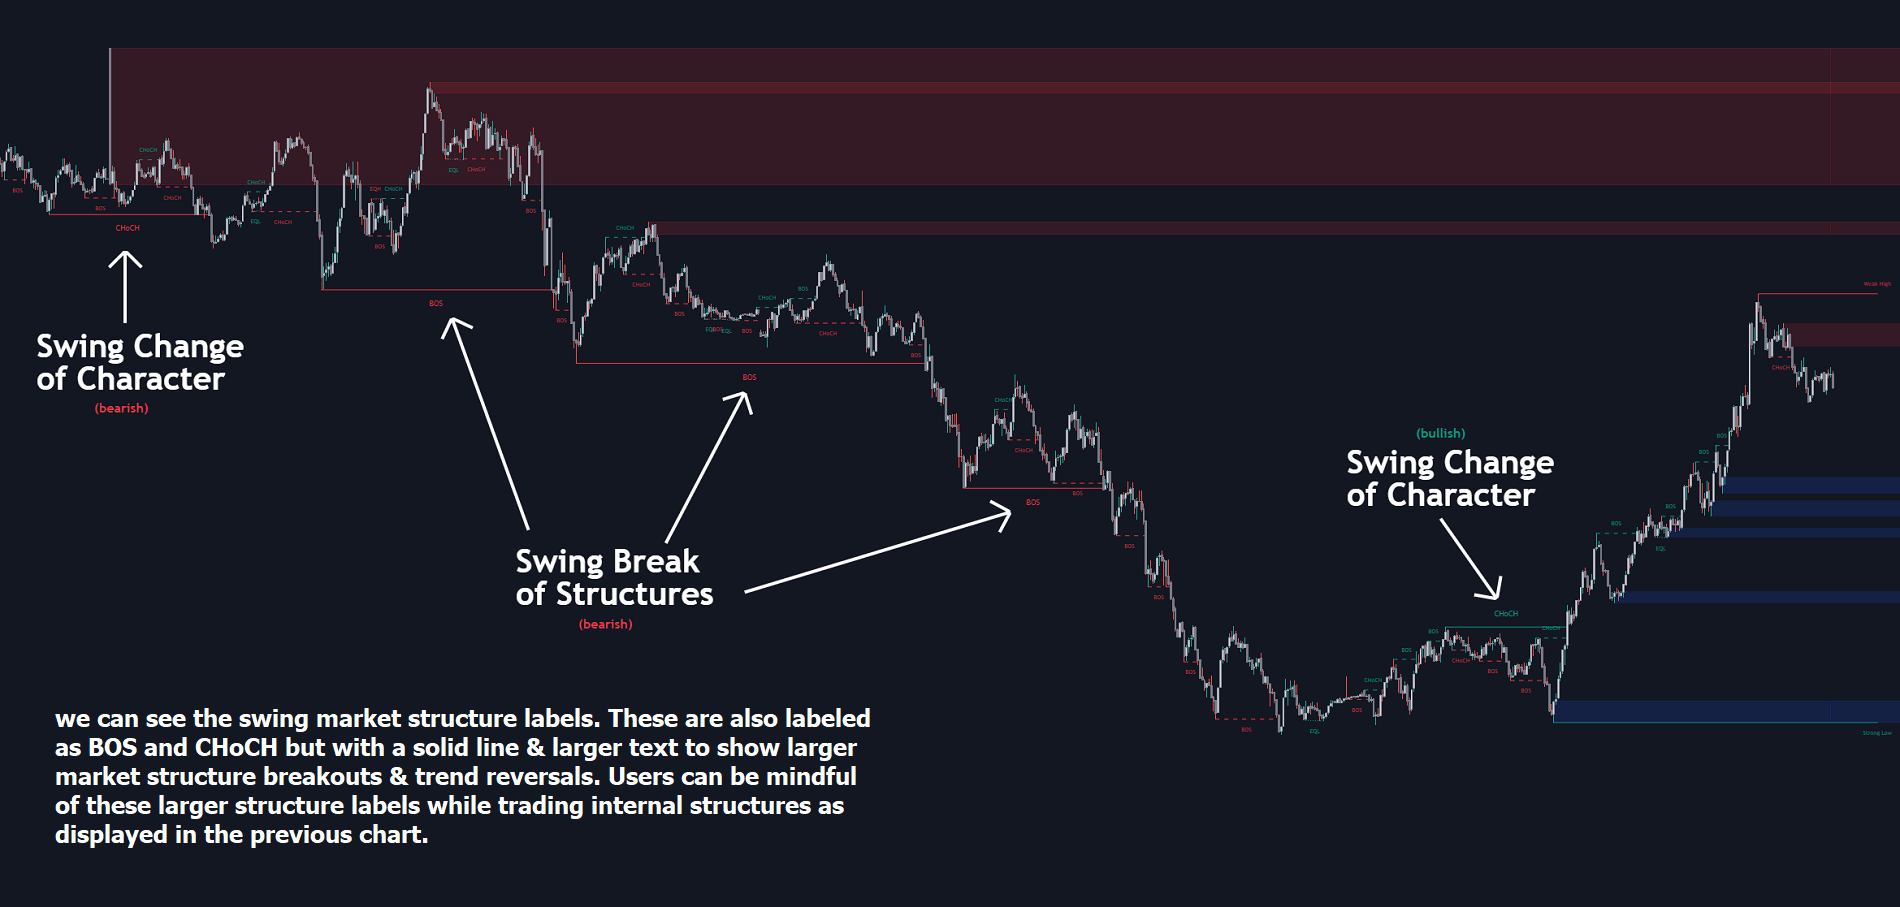
- Swing Structure: Displays the swing structure labels & solid lines on the chart (larger BOS & CHoCH labels).
- Swing Points: Displays swing points labels on chart such as HH, HL, LH, LL.
- Internal Order Blocks: Enables Internal Order Blocks & allows the user to select how many most recent Internal Order Blocks appear on the chart.
- Swing Order Blocks: Enables Swing Order Blocks & allows the user to select how many most recent Swing Order Blocks appear on the chart.
- Equal Highs & Lows: Displays EQH/EQL labels on chart for detecting equal highs & lows.
- Bars Confirmation: Allows the user to select how many bars are needed to confirm an EQH/EQL symbol on chart.
- Fair Value Gaps: Displays boxes to highlight imbalance areas on the chart.
- Auto Threshold: Filter out non-significant fair value gaps.
- Timeframe: Allows the user to select the timeframe for the Fair Value Gap detection.
- Extend FVG: Allows the user to choose how many bars to extend the Fair Value Gap boxes on the chart.
- Highs & Lows MTF: Allows the user to display previous highs & lows from daily, weekly, & monthly timeframes as significant levels.
- Premium/Discount Zones: Allows the user to display Premium, Discount, and Equilibrium zones on the chart
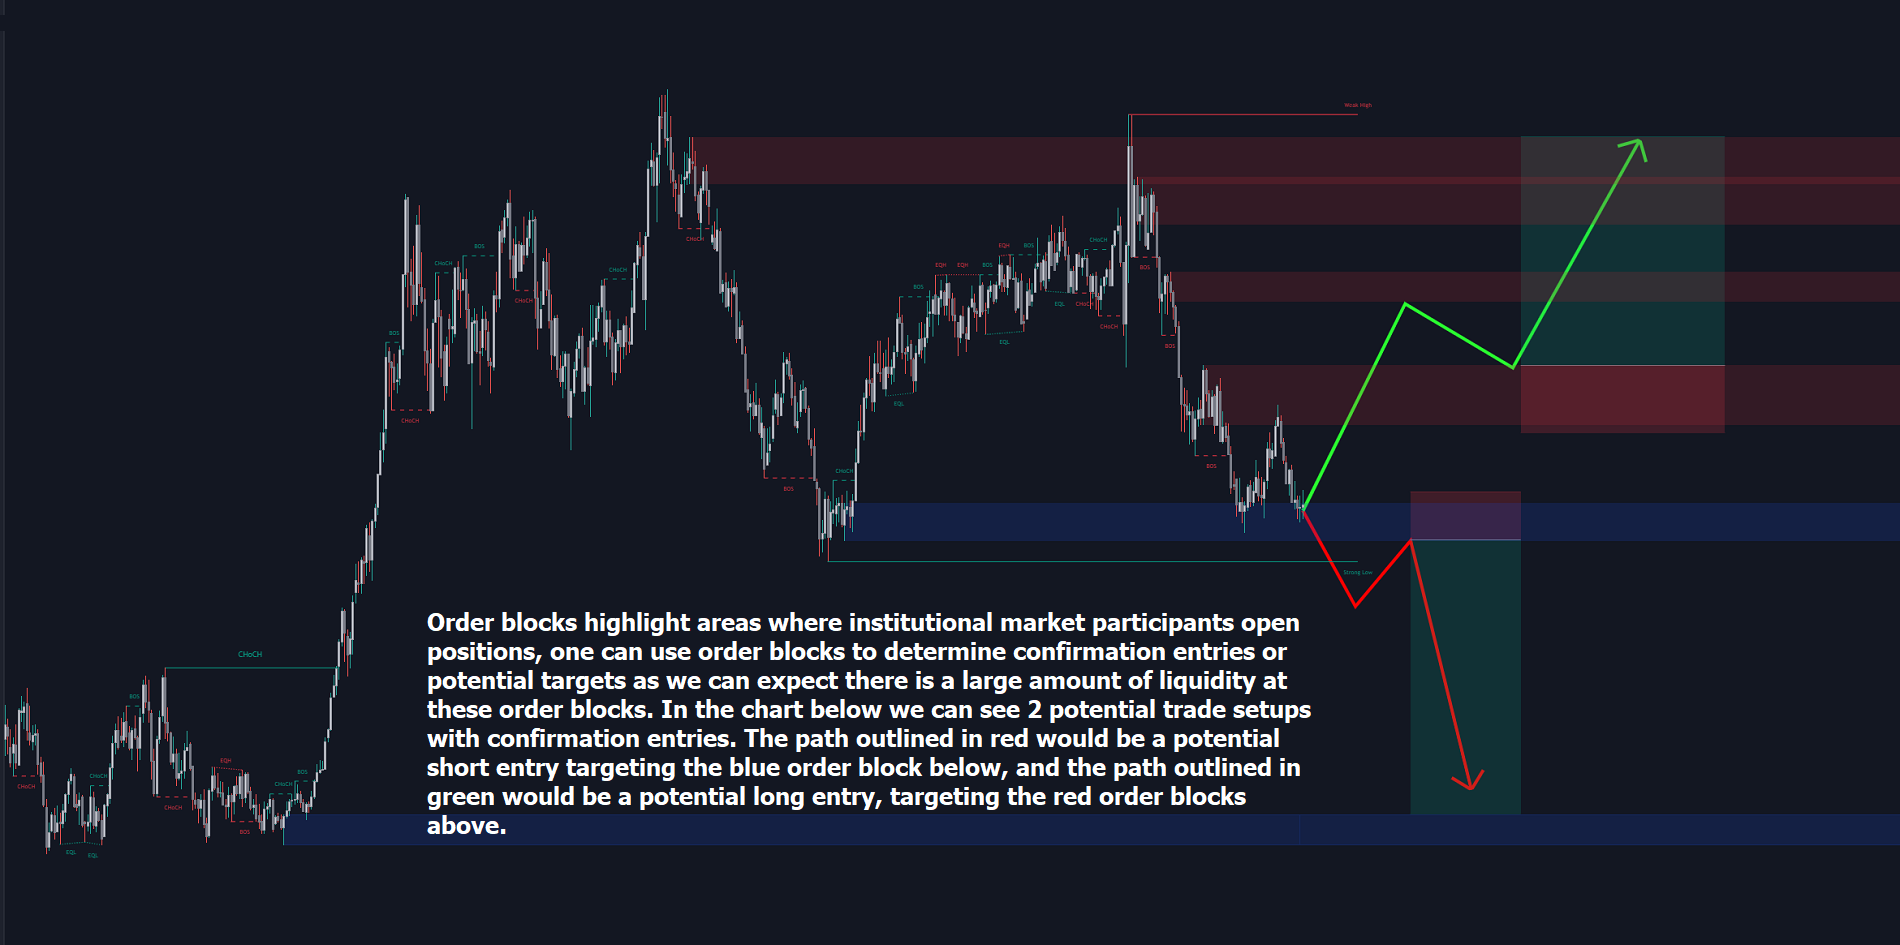
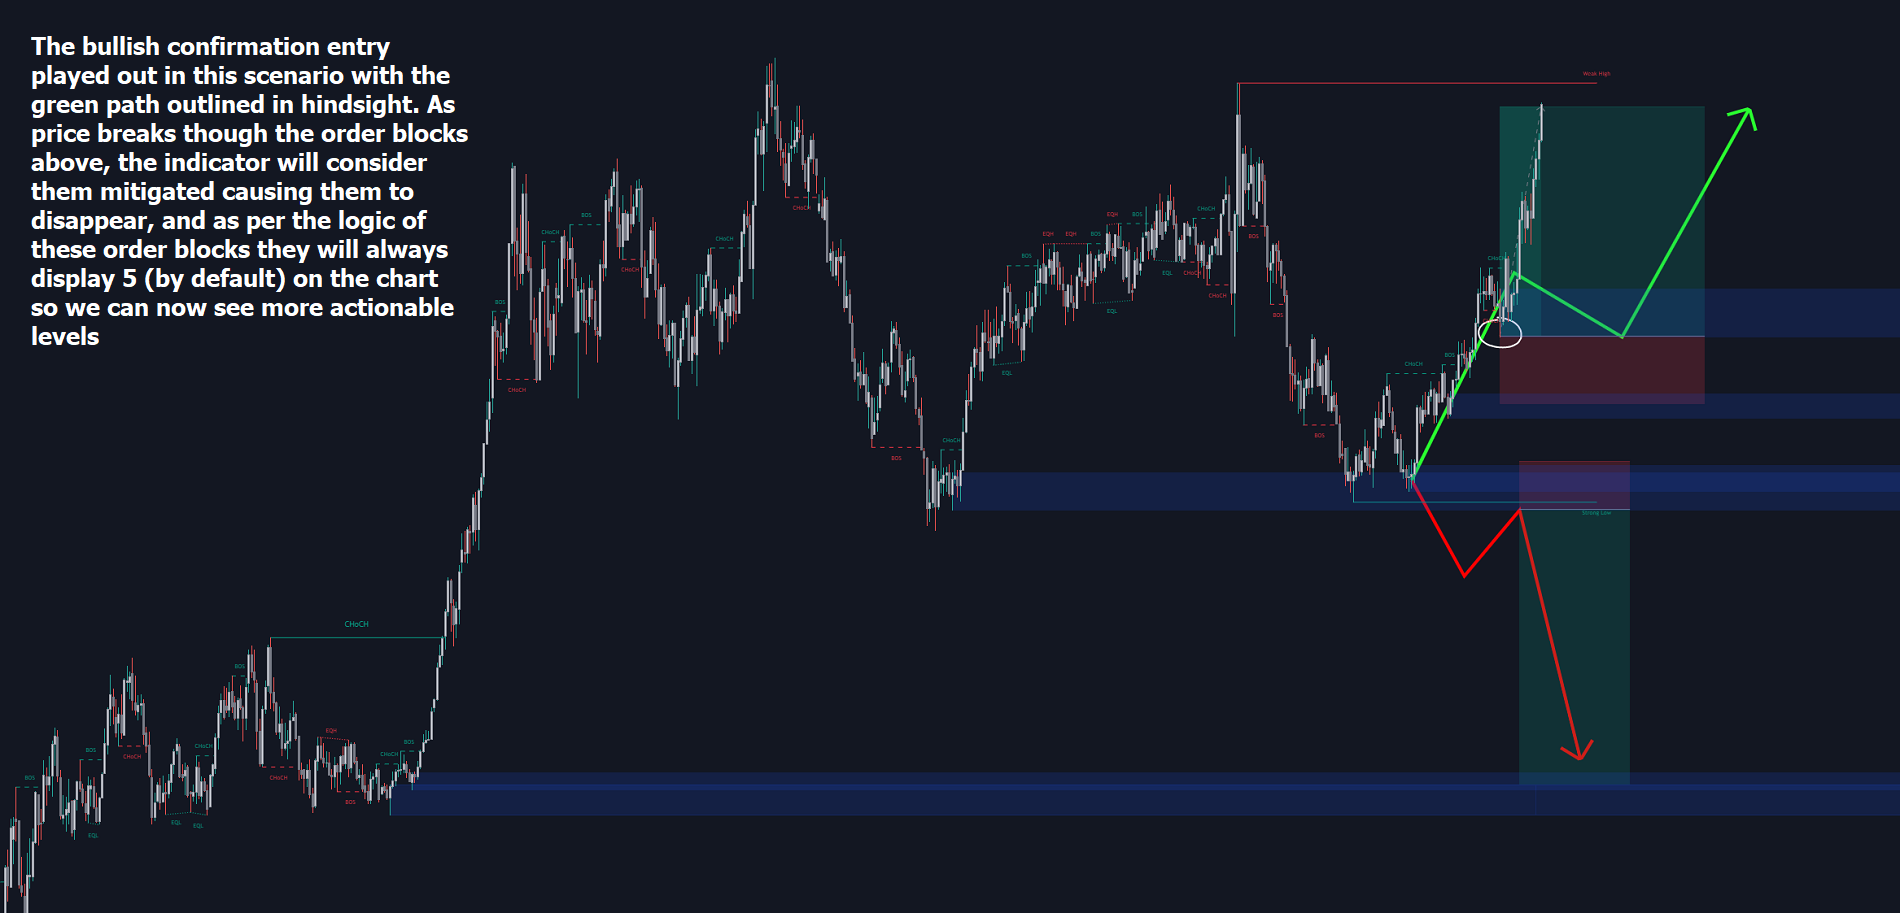
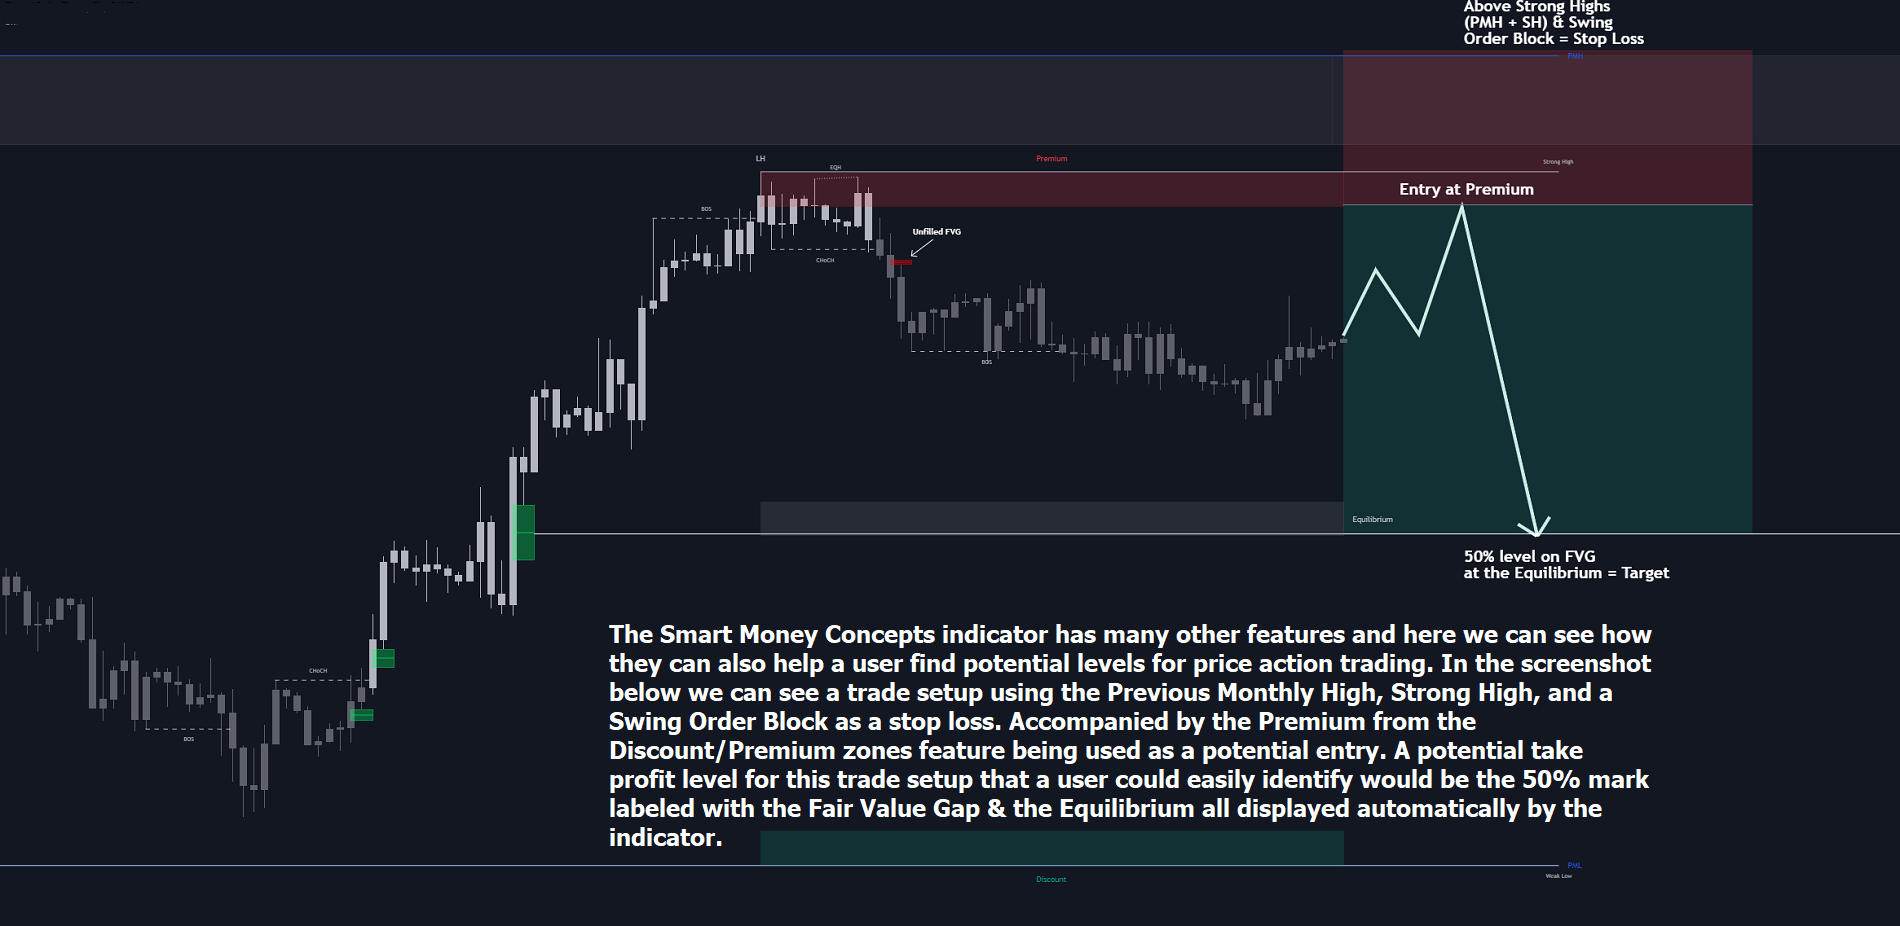
Usage (See images)
ConclusionThis indicator highlights all relevant components of Smart Money Concepts which can be a very useful interpretation of market structure, liquidity, & more simply put, price action. The term was coined & popularized primarily within the forex community & by ICT while making its way to become a part of many traders' analysis. These concepts, with or without this indicator do not guarantee a trader to be trading within the presence of institutional or "bank-level" liquidity, there is no supporting data regarding the validity of these teachings.


It helps me trade better, I like it.