RSX Candles AM
- Indicadores
- Andriy Matviyevs'kyy
- Versão: 27.0
- Atualizado: 6 setembro 2024
- Ativações: 5
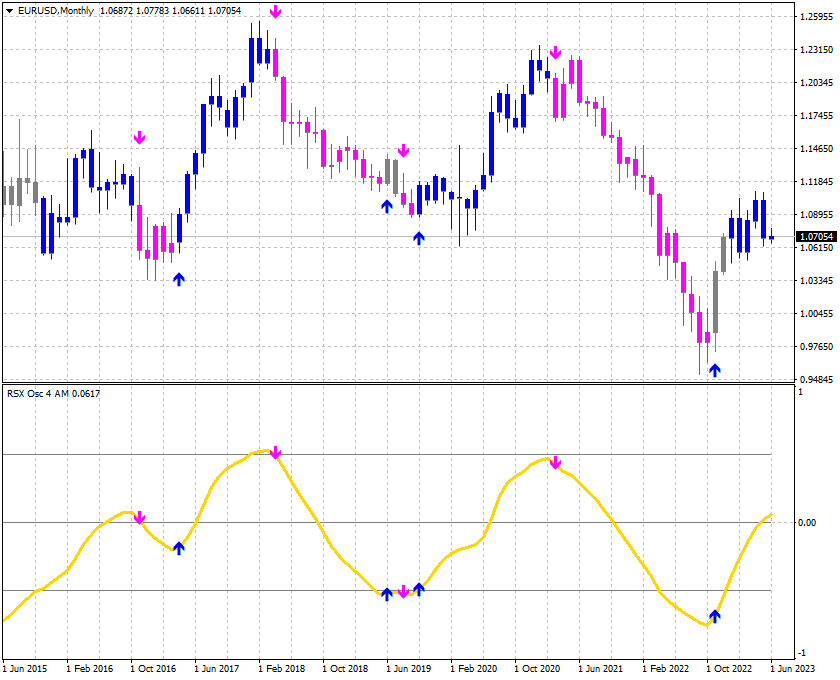
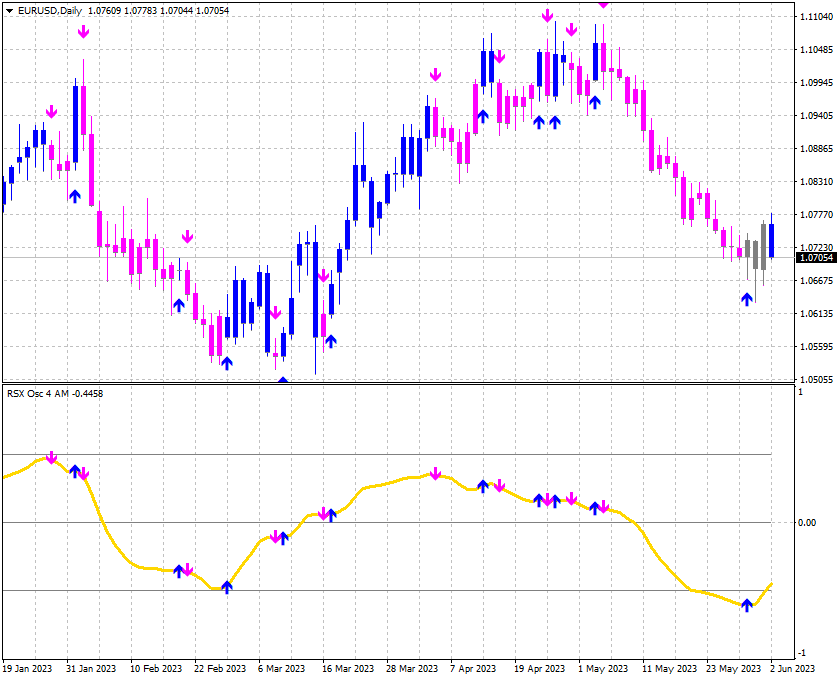
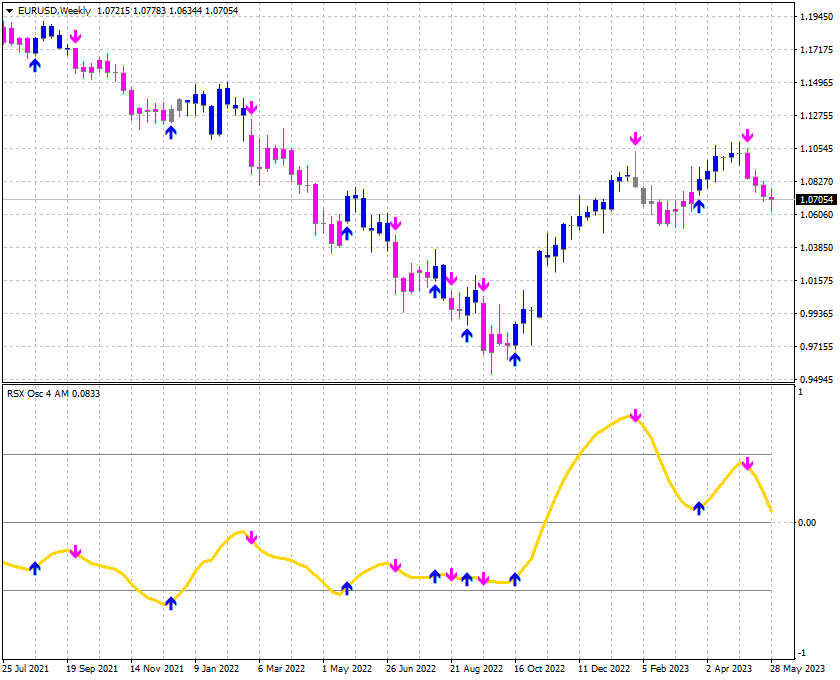
The indicator displays the signals of the RSX oscillator on the price chart.
(To display these signals in a separate window, along with the oscillator, another indicator is used - RSX Osc 4 AM).
It is optimal to use the indicator signals as signals to open a trade when the price overcomes the maximum or minimum of the bar at which the signal was given.
An opposite signal cancels the previous signal.
Settings:
- Data period for indicator calculation - data period for indicator calculation;
- Data period to display the indicator - data period to display the indicator;
- Price used to calculate the indicator - price used to calculate the indicator;
- Oversold level (-1=> 0 <=1) - oversold level;
- Overbought level (-1=> 0 <=1) - overbought level.