RelicusRoad MACD v2
- Indicadores
- Relicus LLC
- Versão: 2.0
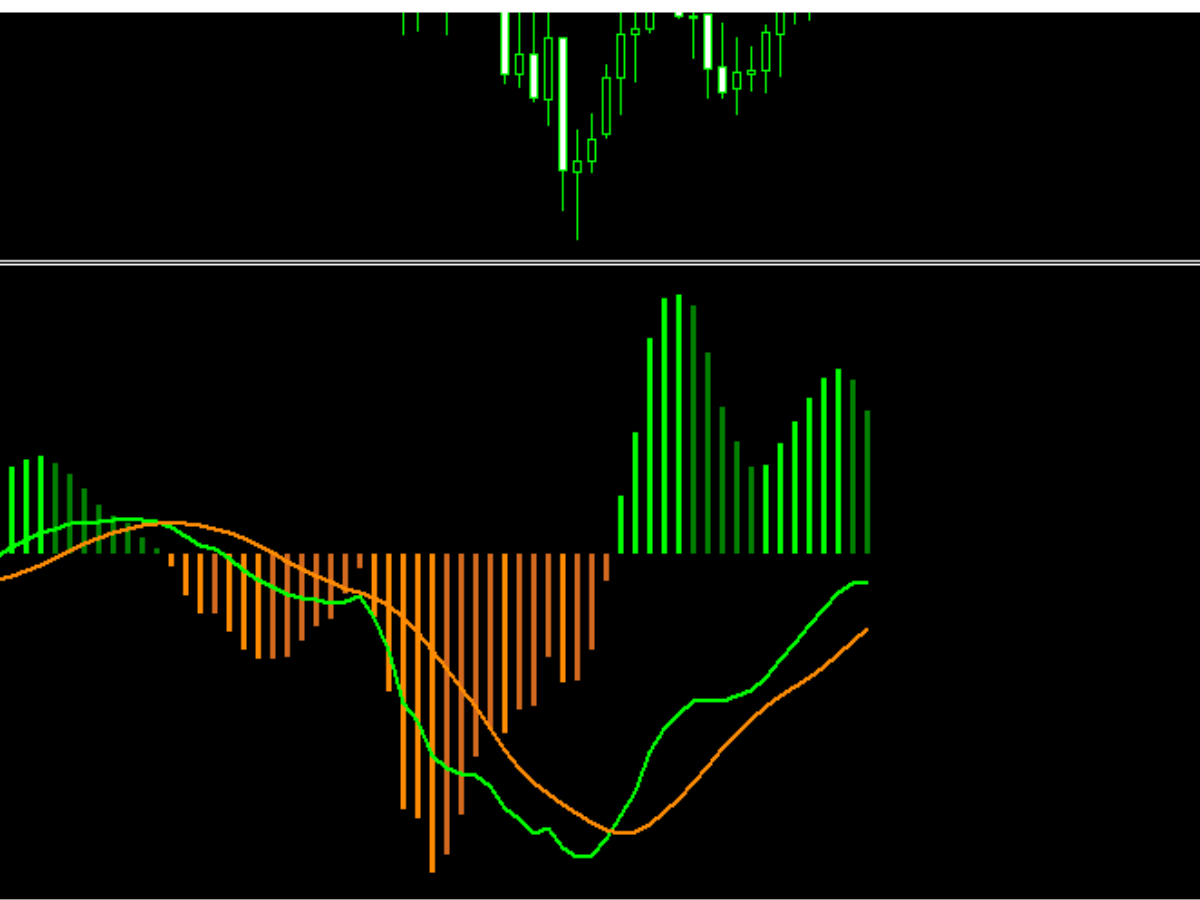
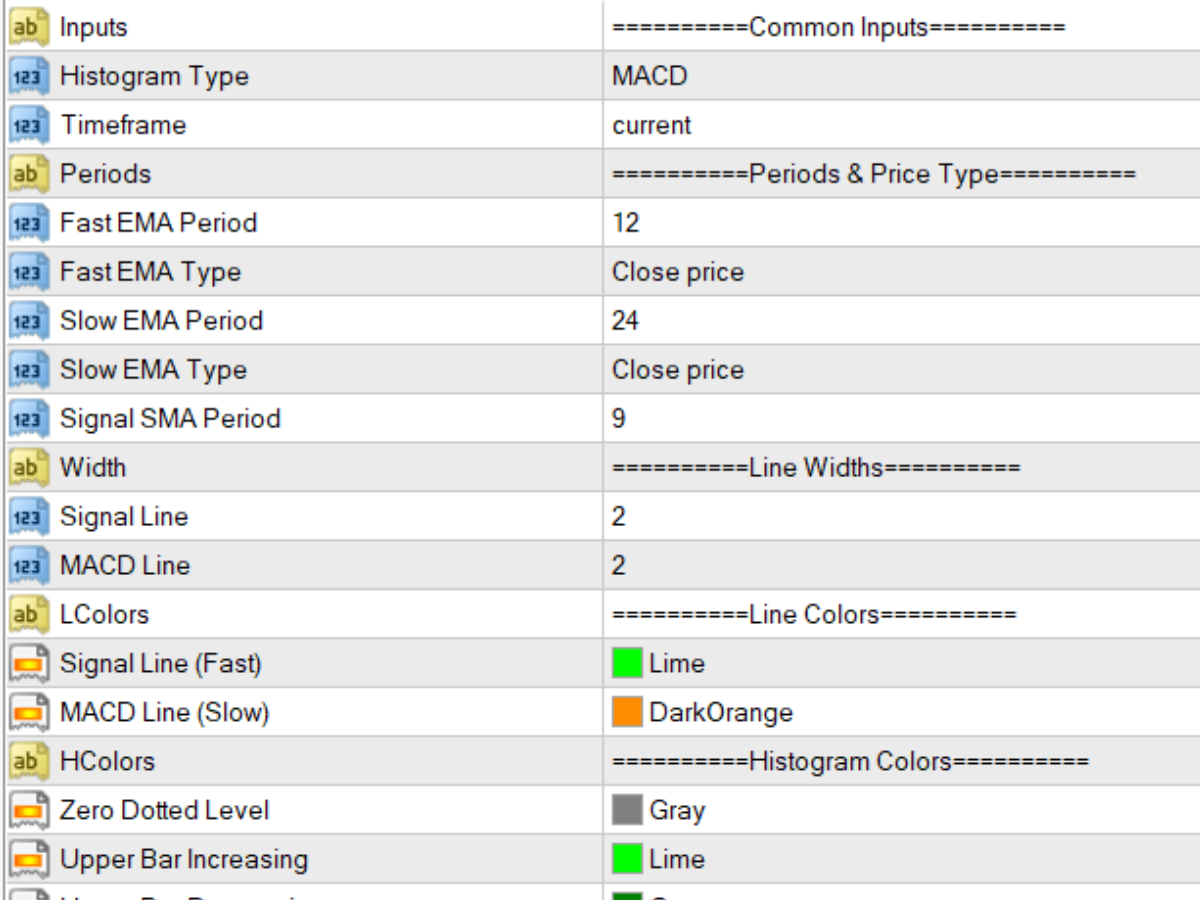
A estratégia de negociação Moving Average Convergence Divergence (MACD) é uma ferramenta popular de análise técnica usada para identificar mudanças no impulso e direção da tendência. O MACD é calculado subtraindo a média móvel exponencial (EMA) de 26 períodos da EMA de 12 períodos. Uma EMA de 9 períodos, chamada "linha de sinal", é então plotada em cima do MACD para atuar como um gatilho para sinais de compra e venda.
O MACD é considerado em território de alta quando a linha MACD está acima da linha de sinal e em território de baixa quando está abaixo. Os traders frequentemente usam essas informações para identificar possíveis oportunidades de compra e venda.
O MACD é um indicador versátil e pode ser usado de várias maneiras, algumas maneiras comuns de usá-lo são:
Cruzamento: um cruzamento de alta ocorre quando a linha MACD cruza acima da linha de sinal e um cruzamento de baixa ocorre quando a linha MACD cruza abaixo da linha de sinal.
Divergência: uma divergência de alta ocorre quando o MACD está fazendo novas máximas enquanto o título subjacente não está, e uma divergência de baixa ocorre quando o MACD está fazendo novas mínimas enquanto o título subjacente não está.
Seguimento de tendência: uma tendência de alta ocorre quando o MACD está acima da linha zero e uma tendência de baixa ocorre quando o MACD está abaixo da linha zero.
É importante observar que o MACD é um indicador atrasado e deve ser usado em conjunto com outros indicadores técnicos e análises para tomar uma decisão de negociação.


This is so nice.