Sto Candles AM
- Indicadores
- Andriy Matviyevs'kyy
- Versão: 26.0
- Atualizado: 13 setembro 2023
- Ativações: 5
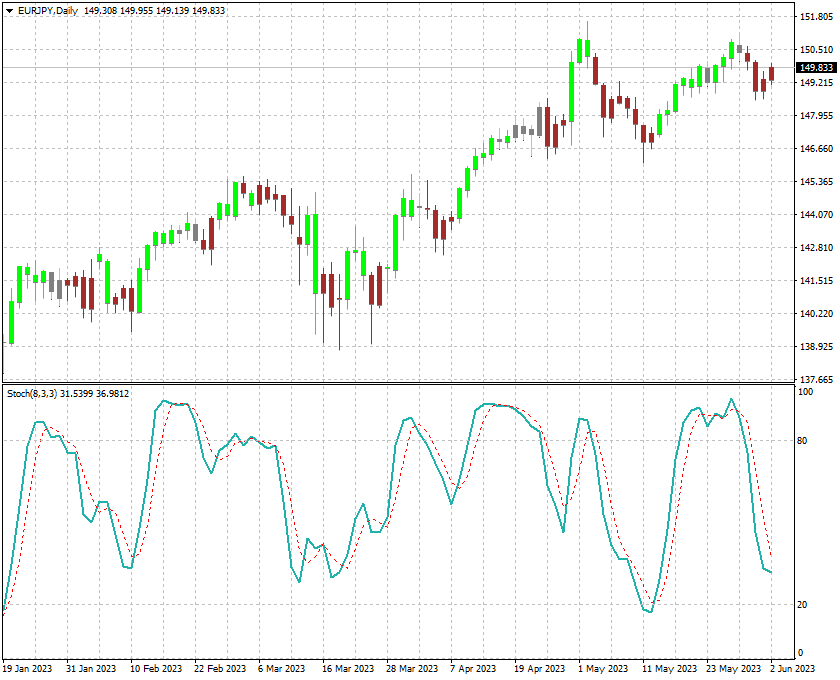
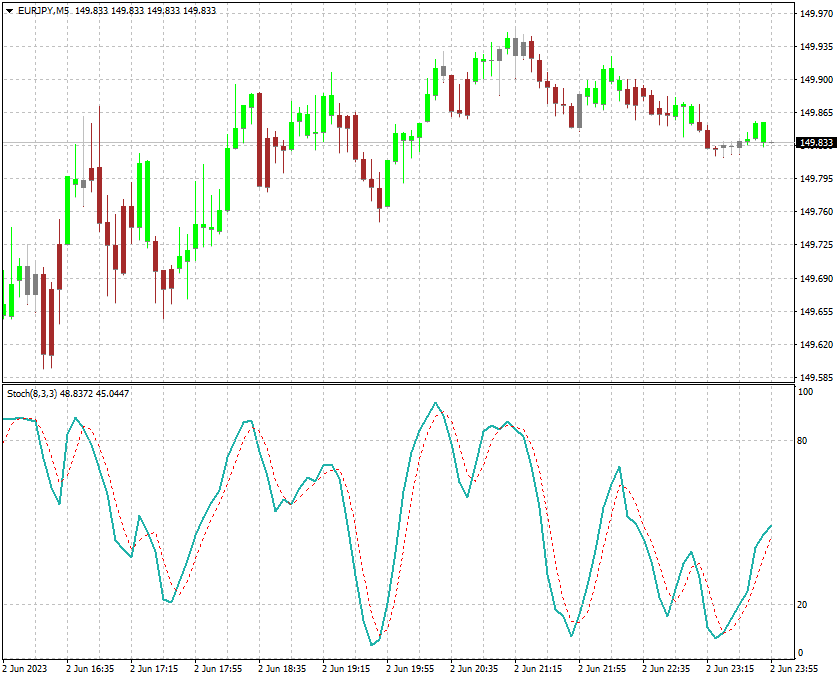
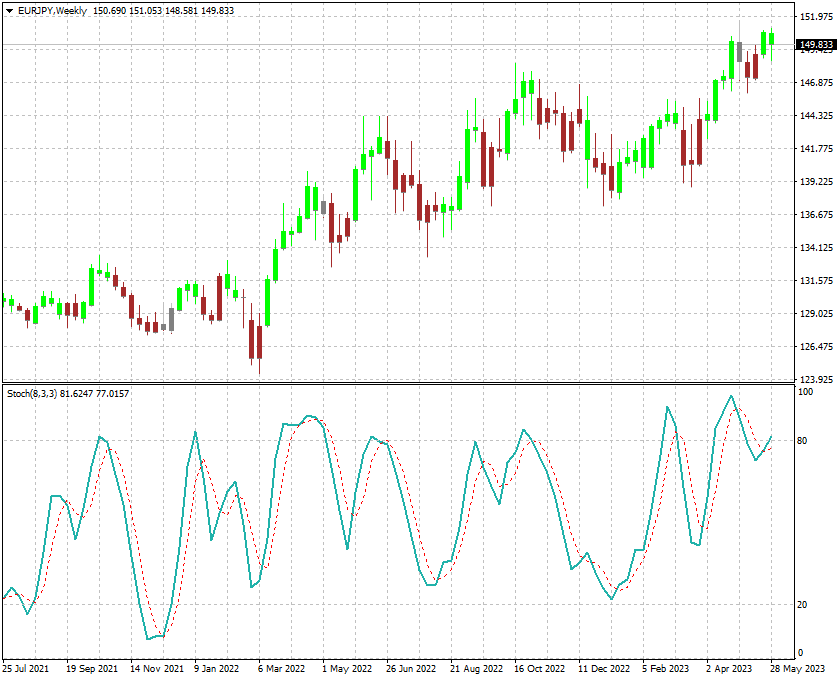
This indicator colors candles in accordance with the projected price movement. The analysis is based on the values of the classic Stochastic Oscillator.
- If the main line of the Stochastic Oscillator is above the signal line and above the oversold level - the candlestick is painted in color that signals a price growth;
- If the main line of the Stochastic Oscillator is below the signal line and below the overbought level - the candlestick is painted in color that signals a price fall.
The indicator does not redraw on completed candlesticks.
The forming candlestick can change its color depending on the current data.
Thus, it is recommended to wait for the candlestick to be completed before making a decision.
The signal is confirmed when the price exceeds the High or Low of the completed candlestick that is painted in the corresponding color.
At the same time the precious candlestick must have a neutral or opposite color.
Custom Parameters:
- Stochastic_Price (0-1) - The applied price of the Stochastic Oscillator (HIGH/LOW or CLOSE/CLOSE);
- K_Period (>0) - The period of the main line of the Stochastic Oscillator;
- Slowing (>-1) - The slowing of the main line of the Stochastic Oscillator;
- D_Period (>1) - The period of the signal line of the Stochastic Oscillator;
- D_Smoothing_Method (0-3) - The smoothing method of the signal line of the Stochastic Oscillator;
- Level oversold (0-100) - The oversold level of the Stochastic Oscillator;
- Level overbuy (0-100) - The overbought level of the Stochastic Oscillator.
- Alerts - show a dialog box;
- Send_Mail - sends an email using an address specified on the Email tab of the options window;
- Send_Notification - sends push notifications to the mobile terminals, whose MetaQuotes IDs are specified in the "Notifications" tab.