Heikin Ashi Dashboard
- Indicadores
- Taras Slobodyanik
- Versão: 2.50
- Atualizado: 24 julho 2024
- Ativações: 10
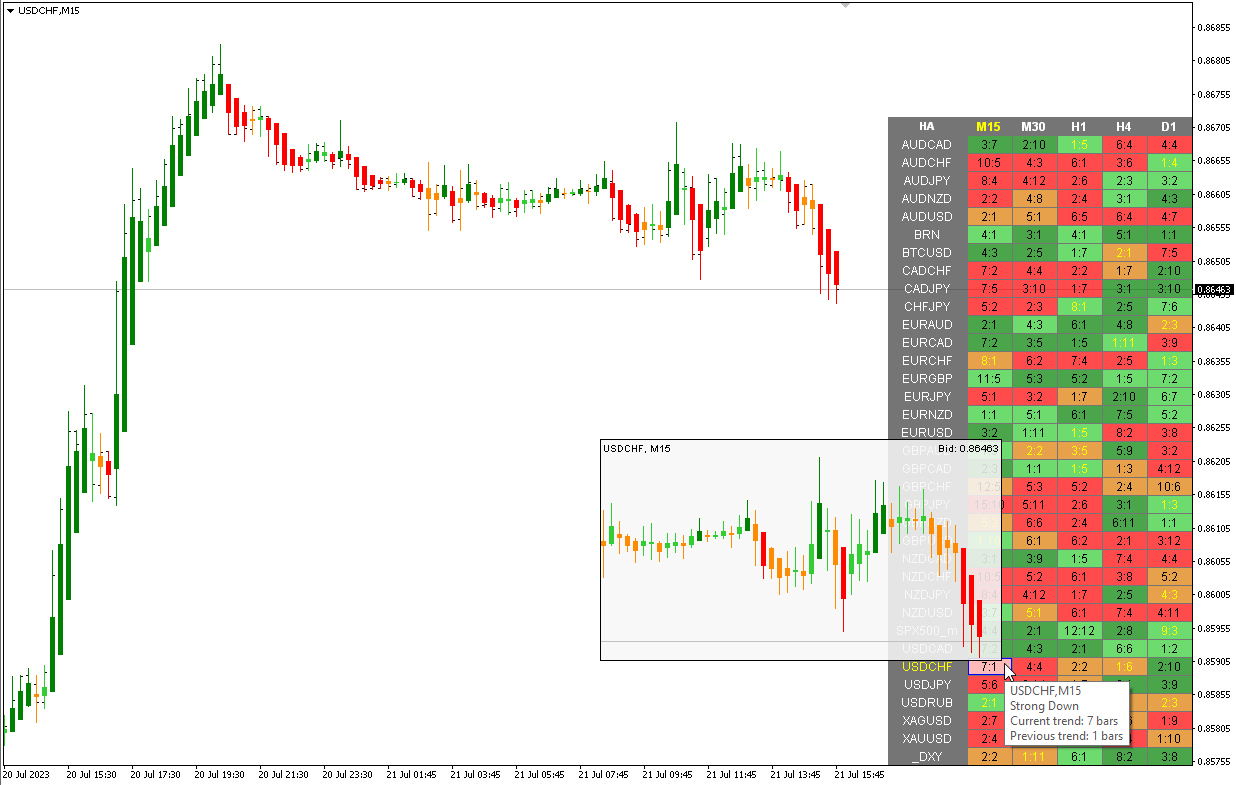
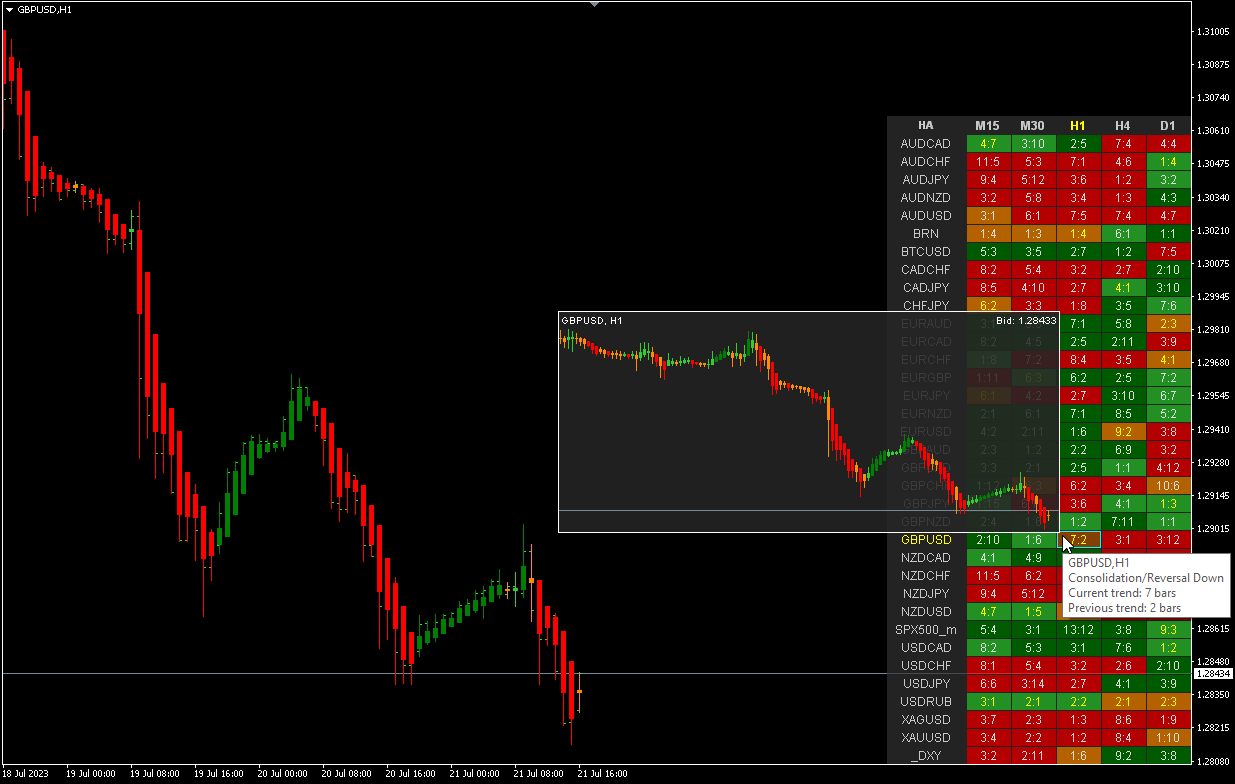
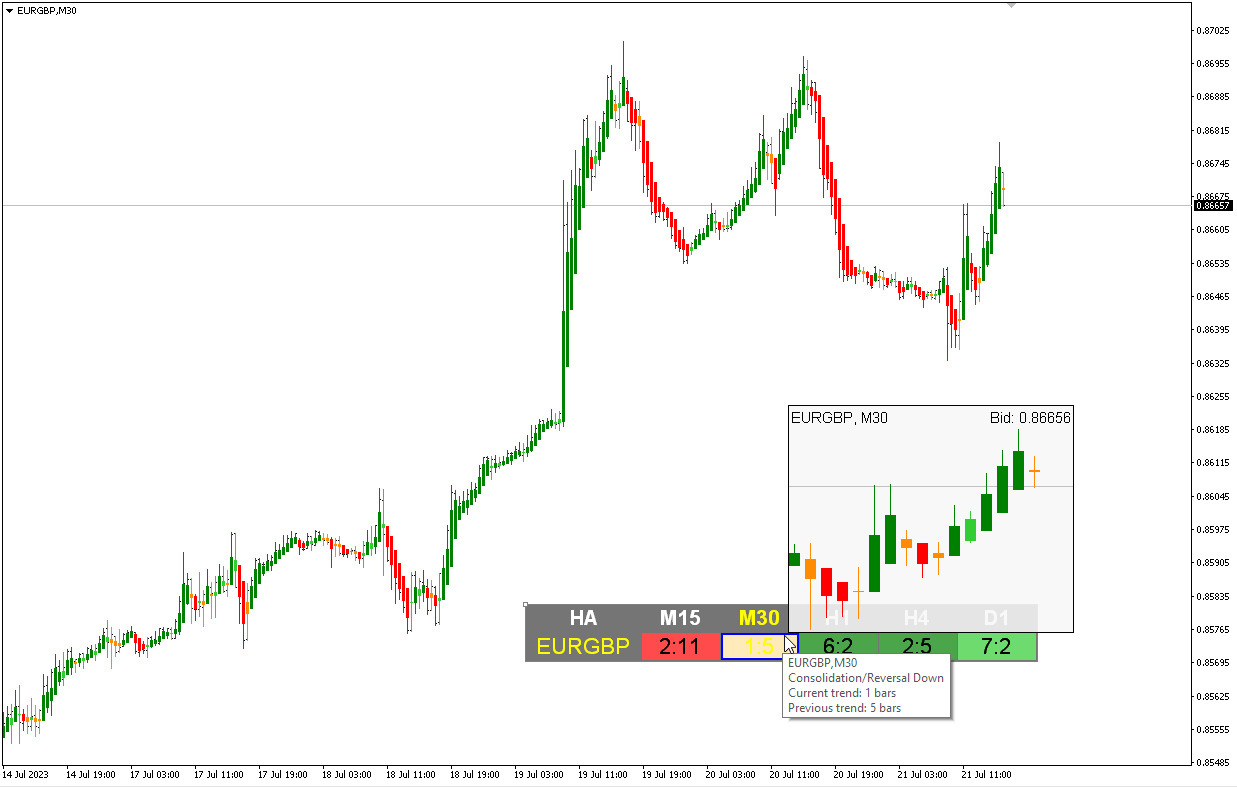
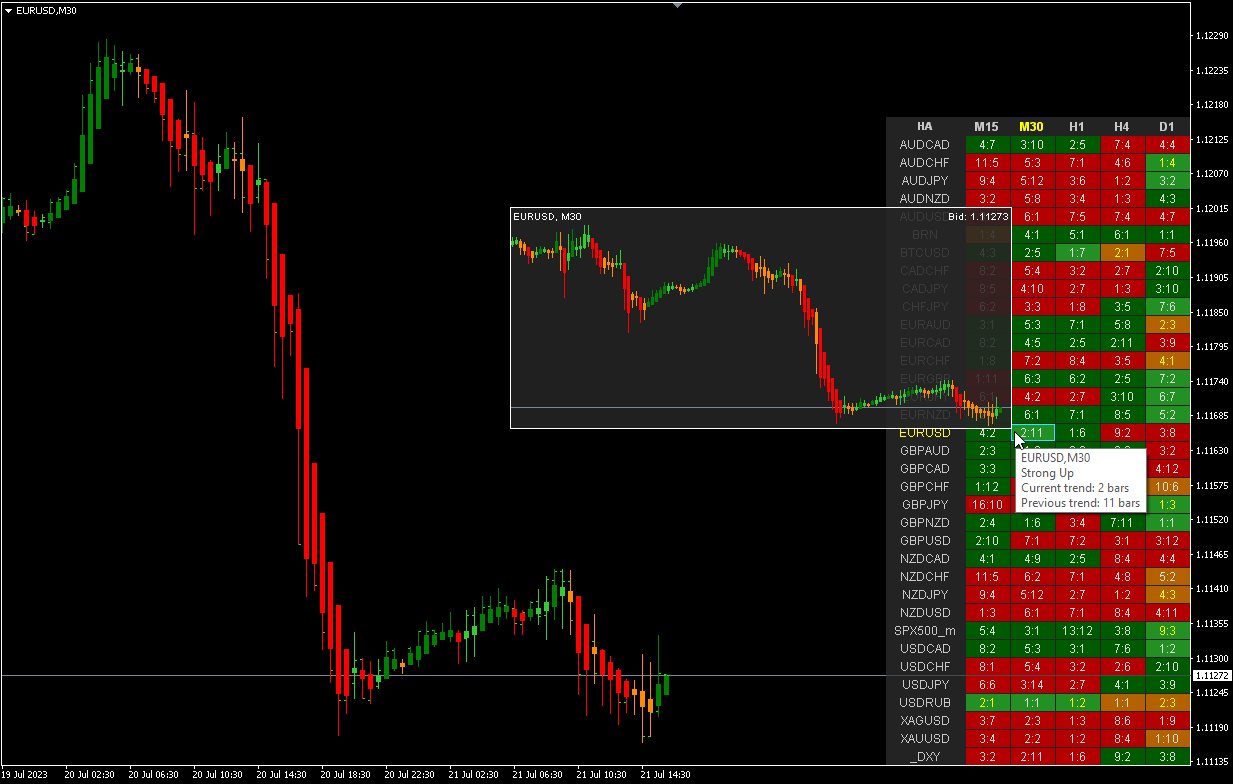
Indicador Heikin Ashi multimoeda e multitimeframe. Mostra o estado atual do mercado. No painel do scanner você pode ver a direção, força e número de barras da tendência atual. As velas de Consolidação/Reversão também são mostradas em cores. Você pode especificar quaisquer moedas e períodos desejados nos parâmetros. Além disso, o indicador pode enviar notificações quando a tendência muda ou quando velas de reversão e consolidação (dojis) aparecem. Ao clicar em uma célula, este símbolo e ponto final serão abertos. Este é o scanner MTF.
Heikin-Ashi é um indicador comercial e gráfico financeiro japonês que significa "ritmo médio". Os gráficos Heikin-Ashi se assemelham aos gráficos de velas, mas têm uma aparência mais suave, pois rastreiam uma série de movimentos de preços, em vez de rastrear cada movimento de preços como acontece com as velas. Heikin-Ashi foi criado em 1700 por Munehisa Homma, que também criou o gráfico de velas. Esses gráficos são usados por traders e investidores para ajudar a determinar e prever movimentos de preços.
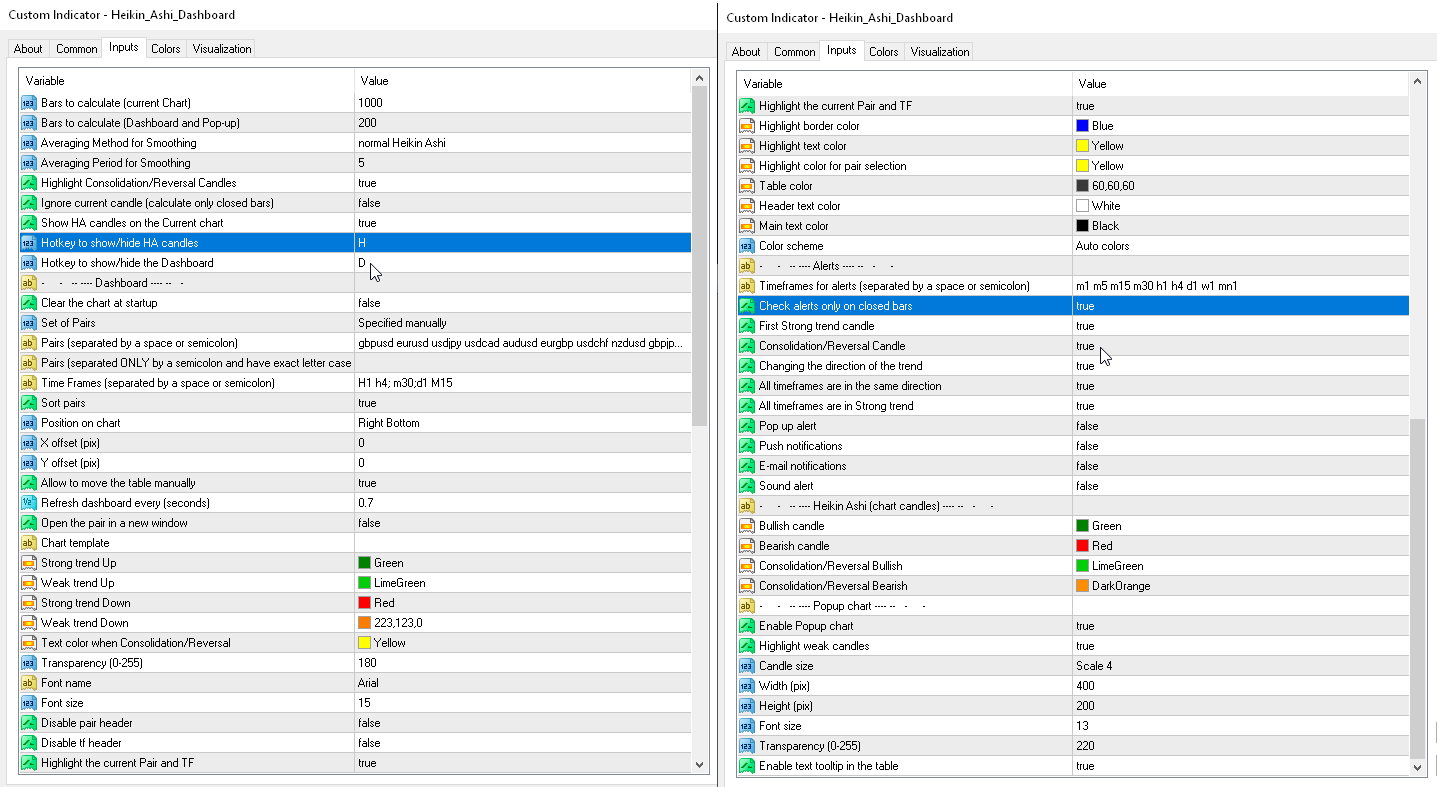
Parâmetros
- Averaging Method for Smoothing — seleção de um método para suavizar os preços das velas.
— Simple MA — MA simples
— Exponential MA — MA exponencial
— Smoothed MA — MA suavizado
— Linear weighted MA — MA ponderado linear
— normal Heikin Ashi — Heikin Ashi normal
- Averaging Period for Smoothing — seleção do período para suavização.
- Ignore current candle (calculate only closed bars) — desativa a exibição da vela atual (não fechada).
- Show HA candles on the current chart — As velas Heiken Ashi serão desenhadas no gráfico atual.
- Show Consolidation/Reversal Candles (Doji) — Mostrar velas de consolidação/reversão (Doji).
- Doji. Body length to the Candle length ratio, % (body<=%) — o parâmetro define o tamanho do corpo da vela como uma porcentagem em relação ao tamanho de toda a vela. O corpo deve ser <= a esta porcentagem.
- Doji. Wick length to the Candle length ratio, % (each wick>=%) — o parâmetro define o tamanho dos pavios superior e inferior como uma porcentagem, em relação ao tamanho de toda a vela. Cada pavio deve ser >= a esta porcentagem.
- Hotkey to show/hide HA candles — Tecla de atalho para mostrar/ocultar velas HA.
- Hotkey to show/hide the Dashboard — Tecla de atalho para mostrar/ocultar o Dashboard.
Painel
Clear the chart at startup — limpe o gráfico na inicialização.
Set of Pairs — Conjunto de Pares — conjunto de símbolos
— Market Watch — pares do "Market Watch".— Specified manually — pares especificados manualmente, nos parâmetros "Pares".— Current pair — mostra apenas o par atual.
Pairs (separated by a space or semicolon) — lista de símbolos separados por espaço ou ponto e vírgula. Os nomes das moedas devem ser escritos exatamente como os da corretora, mantendo a caixa e o prefixo/sufixo.
Time Frames (separated by a space or semicolon) — lista de prazos separados por espaços ou ponto e vírgula (vários prazos).
Sort pairs — classificando a lista de pares.
Position on chart — canto para exibir o painel no gráfico.
X offset (pix) — desloca o painel ao longo do eixo X;
Y offset (pix) — desloca o painel ao longo do eixo Y;
Refresh dashboard every (seconds) — período de atualização para todos os pares e intervalos de tempo.
Open the pair in a new window — abra um símbolo em uma nova janela do gráfico clicando.
Chart template — o nome do modelo do gráfico, se o gráfico for aberto em uma nova janela.
Strong trend Up — cor para uma forte tendência de alta.
Weak trend Up — cor para uma tendência de alta fraca.
Strong trend Down — cor para uma forte tendência de baixa.
Weak trend Down — cor para uma tendência de baixa fraca.
Text color when Consolidation/Reversal — cor de destaque (e velas no gráfico) para barras de consolidação/reversão.
Transparency (0-255) — Transparência (0-255).
Font name — Nome da fonte.
Font size — Tamanho da fonte.
Alertas
Timeframes for alerts (separated by a space or semicolon) — Prazos para alertas (separados por espaço ou ponto e vírgula).
Check alerts only when the candle is closed — Verifique os alertas apenas quando a vela estiver fechada.
First Strong trend candle — alerta para a primeira vela de tendência forte.
Consolidation/Reversal Candle — alerta quando uma vela de consolidação/reversão aparece.
Changing the direction of the trend — um alerta quando a direção da tendência muda.
All timeframes are in Strong trend — Esses alertas são enviados uma vez por barra de acordo com o prazo mínimo no painel. Eles não olham o parâmetro “Prazos para alertas”.
All timeframes are in the same direction — Esses alertas são enviados uma vez por barra de acordo com o prazo mínimo no painel. Eles não olham o parâmetro “Prazos para alertas”.
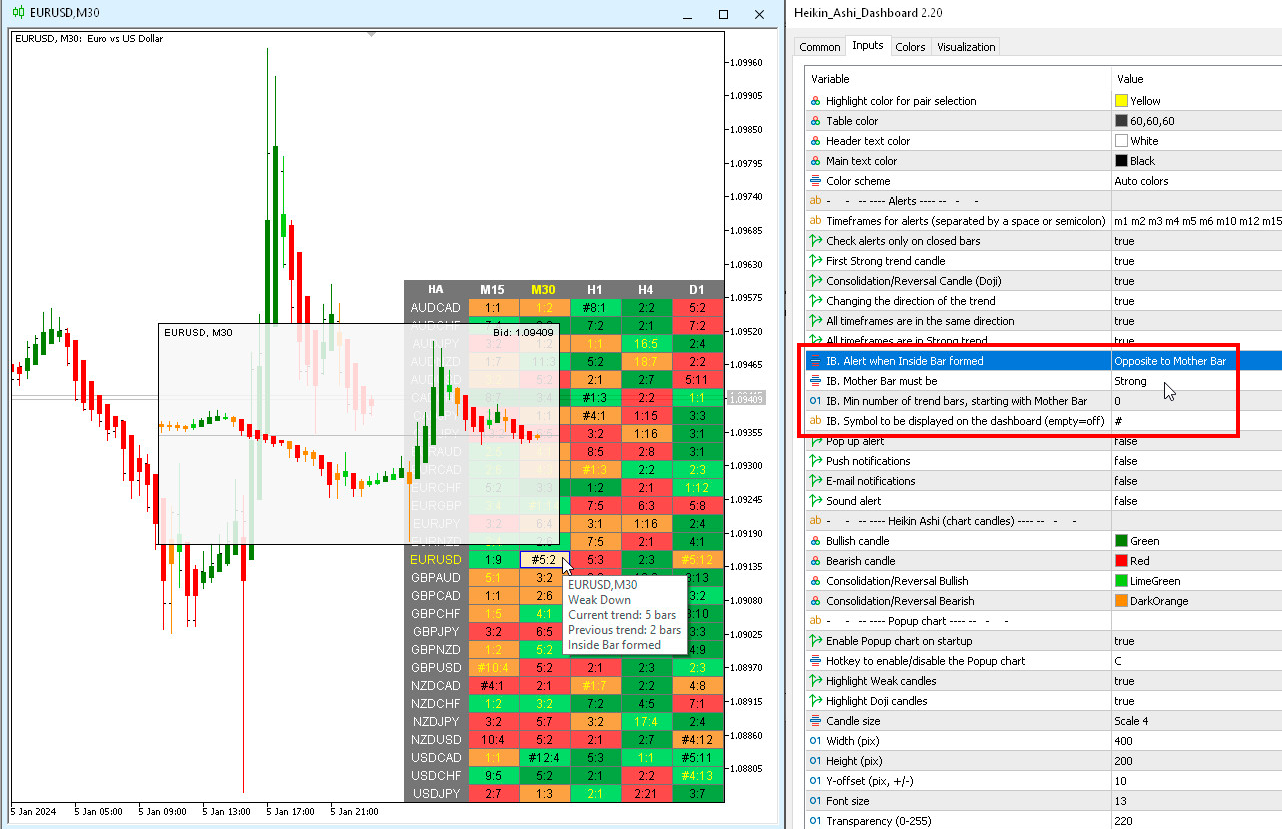
IB. Alert when Inside Bar formed — IB. Alerta quando o Inside Bar é formado.
IB. Mother Bar must be — IB. Mãe Bar deve ser.
IB. Min number of trend bars, starting with Mother Bar — IB. Número mínimo de barras de tendência, começando pela Barra Mãe.
IB. Symbol to be displayed on the dashboard (empty=off) — IB. Símbolo a ser exibido no painel (vazio=desligado).


Great Indi! Great setting options.