NosTraderMusLR
- Indicadores
- Victor Gauto
- Versão: 1.0
- Ativações: 5
INDICADOR DE REGRESSÃO LINEAR ==>
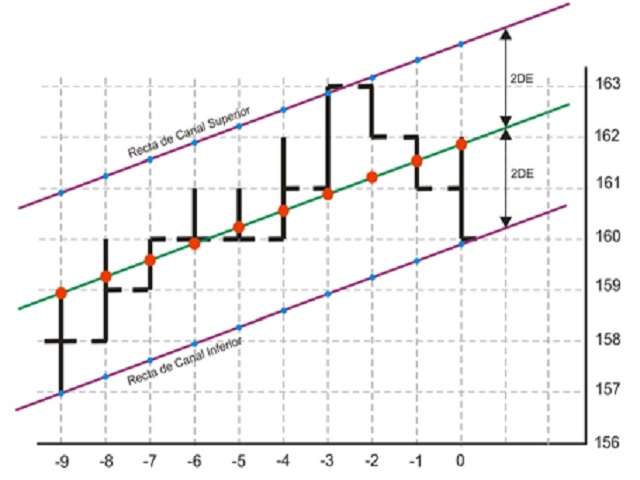
O indicador representa a linha de regressão linear e as linhas de suporte e resistência, obtidas com base no desvio padrão em relação à regressão linear. Personalização: os seguintes valores podem ser ajustados:
- Rango Tendencia: o número de barras ou períodos, dentro do período de tempo considerado, utilizado como referência para o indicador.
- AmpDesv: a amplitude ou número de vezes para considerar o desvio padrão da regressão linear para sua representação.
- Colores: é possível escolher cores de uma paleta para a representação de cada linha.
O indicador de Regressão Linear é utilizado para medir a relação entre duas variáveis, neste caso, preço e tempo. O indicador constrói uma linha reta através dos preços de fechamento do ativo durante um período determinado e é utilizado para determinar a direção da tendência no mercado. Se a linha de regressão estiver aumentando, isso indica que o mercado está em uma tendência de alta, e se estiver diminuindo, isso indica uma tendência de baixa.
A principal vantagem de utilizar o indicador de Regressão Linear é que permite aos traders identificar pontos de entrada e saída no mercado com maior precisão. Além disso, também é útil para estabelecer níveis de suporte e resistência, o que pode ajudar os traders a determinar objetivos de lucro e stop loss.
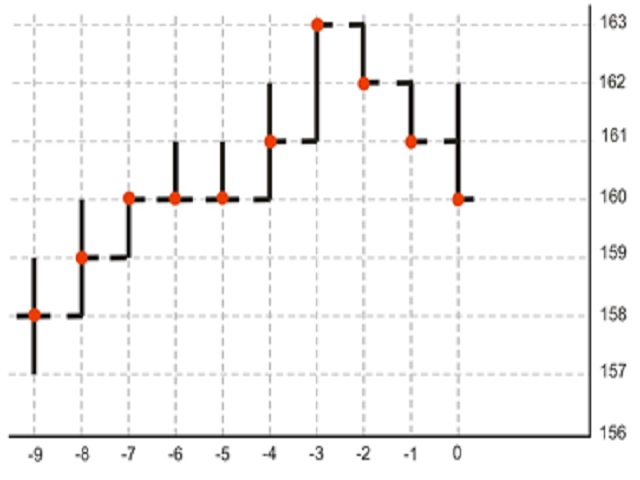
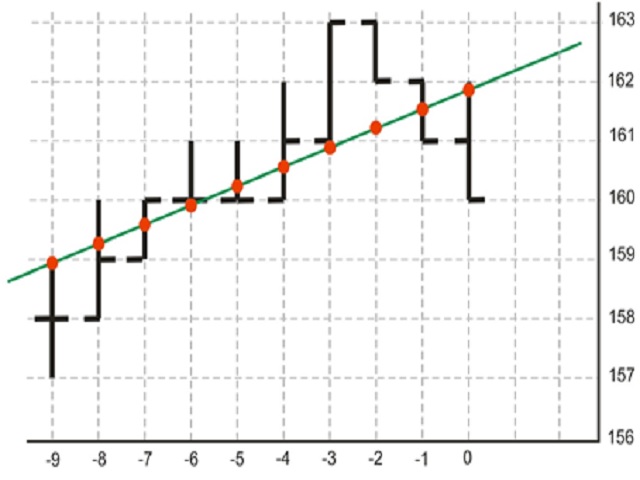
Linha de Regressão Linear
Uma linha de regressão linear é um modelo matemático utilizado em estatística para descrever a relação entre duas variáveis (no nosso caso, preço e tempo). É uma linha reta que se ajusta aos pontos de dados (preços de fechamento) e representa a tendência central dos dados. Esta linha é utilizada para prever o valor de uma variável (preço) em função do valor da outra variável (tempo), assumindo que o comportamento dos preços futuros é baseado nos preços passados.
Uma linha de regressão linear é um modelo matemático utilizado em estatística para descrever a relação entre duas variáveis (no nosso caso, preço e tempo). É uma linha reta que se ajusta aos pontos de dados (preços de fechamento) e representa a tendência central dos dados. Esta linha é utilizada para prever o valor de uma variável (preço) em função do valor da outra variável (tempo), assumindo que o comportamento dos preços futuros é baseado nos preços passados.
Desvio padrão de uma regressão linear
O desvio padrão de uma regressão linear é uma medida usada em estatística para medir a variabilidade dos dados em torno da linha de regressão. O desvio é calculado a partir dos resíduos, que são as diferenças entre os valores observados e os valores previstos pela linha de regressão. O desvio padrão de uma regressão linear é importante porque fornece informações sobre a precisão da linha de regressão. Um desvio padrão baixo indica que os dados estão muito próximos da linha de regressão e que é uma boa aproximação dos dados. Um desvio padrão alto indica que os dados estão muito dispersos e que a linha de regressão não é uma boa aproximação dos dados. No entanto, no caso do comércio de instrumentos financeiros e considerando a dinâmica do mercado, a magnitude do desvio padrão deve ser interpretada da seguinte maneira: um desvio padrão baixo indica baixa volatilidade e um desvio padrão alto indica maior volatilidade no instrumento ou ativo sujeito a análise para o período considerado.