FiveTT Pivot Lines
- Indicadores
- Chima Nwokoro
- Versão: 1.1
- Atualizado: 19 novembro 2021
- Ativações: 5
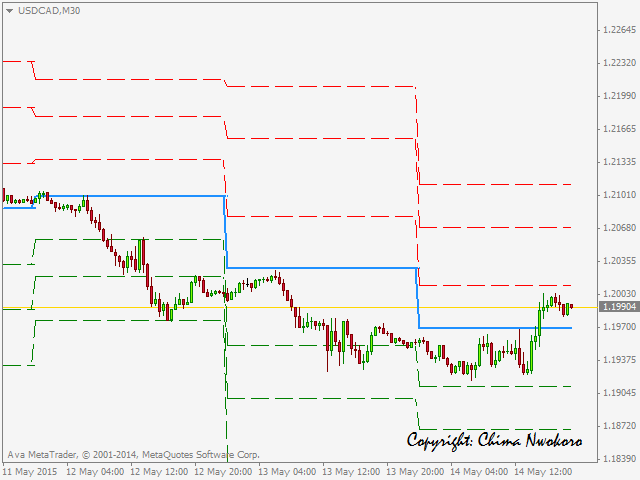
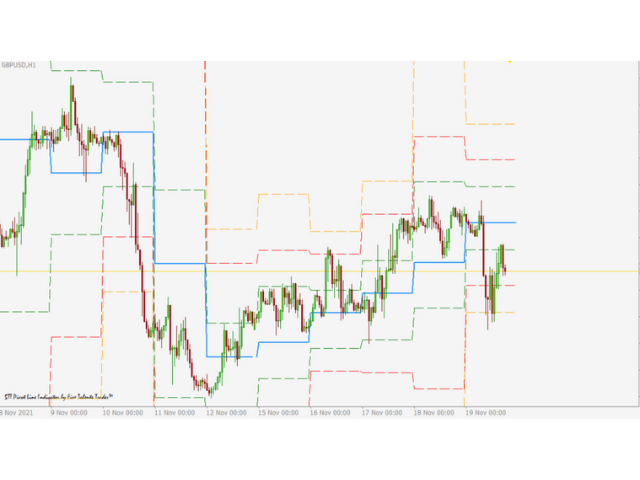
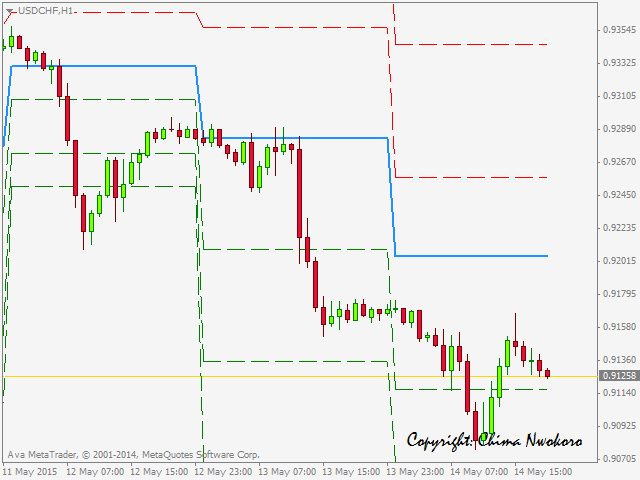
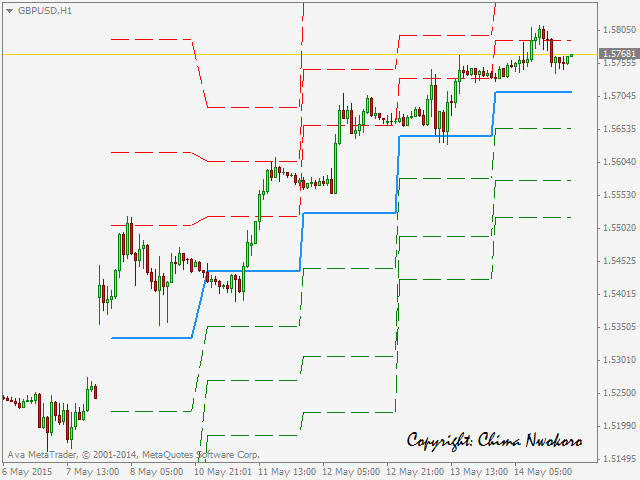
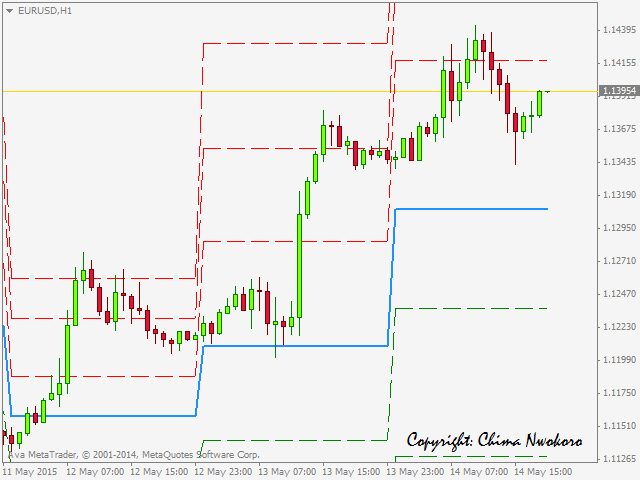
5TT Pivot Lines is a visual display of pivot lines. These are primarily support and resistance points with the 'Blue' Pivot Point.
Pivot points are useful for determining key levels for entry or exits (setting targets and stop loss levels).
Having these support & resistance lines visually displayed on the chart is very useful for intraday traders.
5TT Pivot Lines come with some user-friendly settings to decide if to display the lines or connectors on the chart
Settings
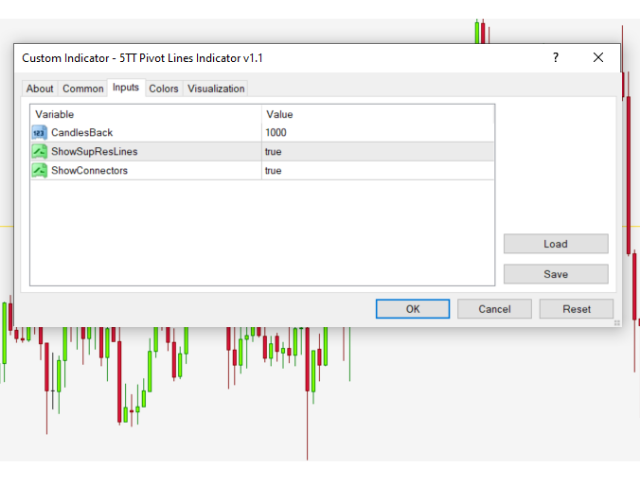
- CandlesBack: This gives the user the ability to enter the numbers of candles on the chart to monitor. The default is 1000 candles
- ShowSupResLines: This parameter can enable and disable the display of S1, S2, S3, R1, R2, & R3 lines. Perhaps a user wants to only display the Pivot Line. This is also possible by disabling the ShowSupResLines parameter
- ShowConnectors: This option allows the user to display connector lines between different days for pivot line, resistance and support lines on the chart.




O usuário não deixou nenhum comentário para sua avaliação