MP First Candle Range Breakout for MT5
- Indicadores
- Pierre Ksachikian
- Versão: 1.0
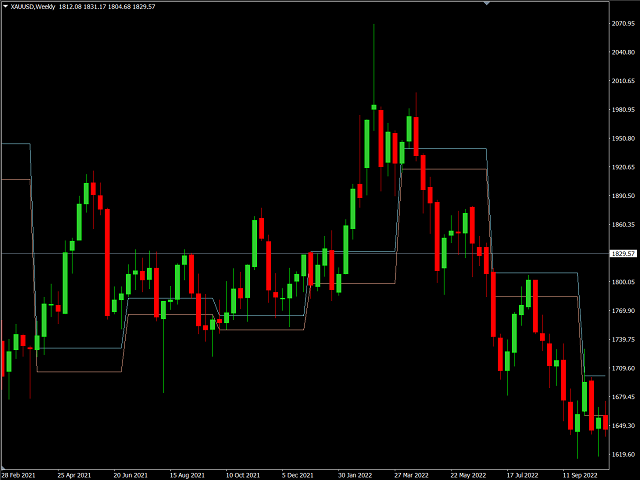
This creative simple indicator will provide a precise framework for market sentiment within technical analysis of different timeframes.
For instance, for traders like me that uses "Mark Fisher" strategy regularly, this is a perfect indicator for having an insight to markets from short term to long term point of view, using Break points of candles' lows and highs and perfect to combine with "Price Action".
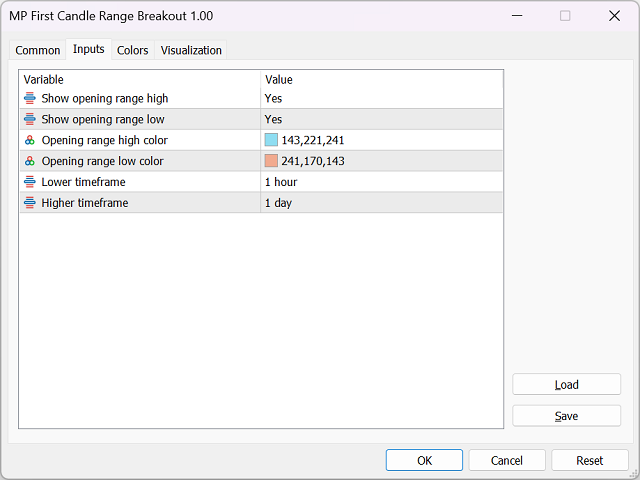
For more options and modifications you can also edit the low timeframe candles within high timeframe charts and also use different colors for more easier identification of break lines within lower time frames.
___________________________________________________________________________________
Disclaimer:
Do NOT trade or invest based upon the analysis presented on this channel. Always do your own research and due diligence before investing or trading. I’ll never tell you what to do with your capital, trades or investments. I’ll also never recommend for you to buy, sell, long or short any asset, commodity, security, derivative or cryptocurrency related instrument as it's extremely HIGH RISK! You should always consult with a professional/licensed financial adviser before trading or investing in any type of assets.