Rubdfx Divergence Detector
- Indicadores
- Namu Makwembo
- Versão: 1.0
- Ativações: 5
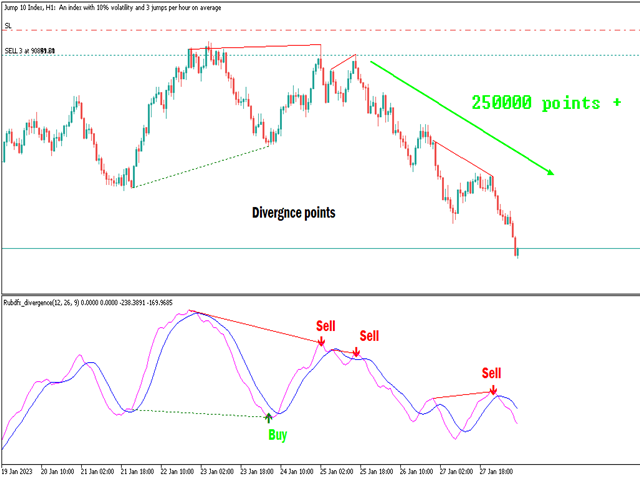
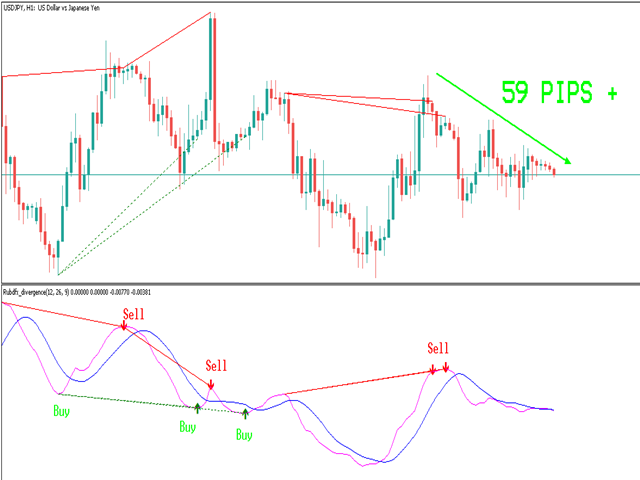
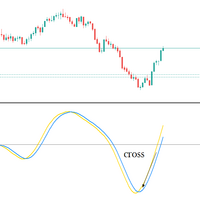
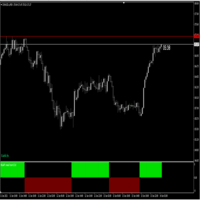
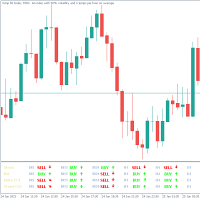
The rubdfx divergence indicator is a technical analysis tool that compares a security's price movement. It is used to identify potential changes in the price trend of a security. The indicator can be applied to any type of chart, including bar charts and candlestick charts.
The algorithm is based on MACD, which has been modified to detect multiple positive and negative divergences.
Settings
___settings___
* fastEMA
* slowEMA
* signalSMA
*Alerts: True/False
#Indicator Usage
Buying:
When a positive divergence occurs, it suggests that the security's price may be about to rise. A buy rule for when a positive divergence arrow appears would be to enter a long position in the security. a good exit strategy would
Selling:
On the other hand, when a negative divergence occurs, it suggests that the security's price may be about to fall. A sell rule for when a negative divergence arrow appears would be to enter a short position in the security.

