RSI 2 based on normalized price
- Indicadores
- Florian Nuebling
- Versão: 1.0
- Ativações: 5
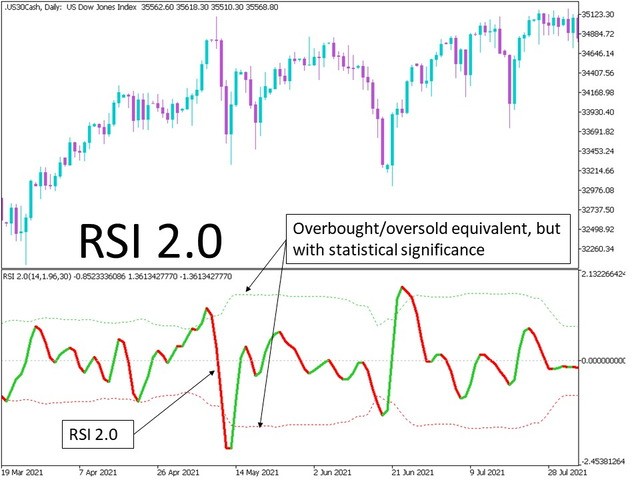
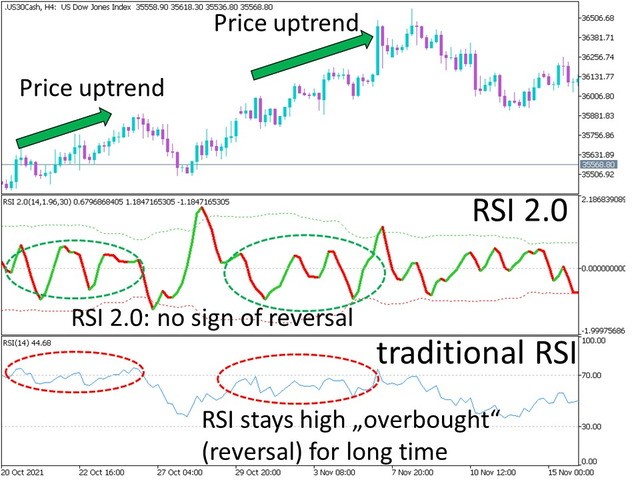
The RSI2.0 indicator uses normalized price data and signal processing steps to get a normal distributed oscillator with no skew (mean is zero). Therefore, it can give much better reads than the traditional RSI.
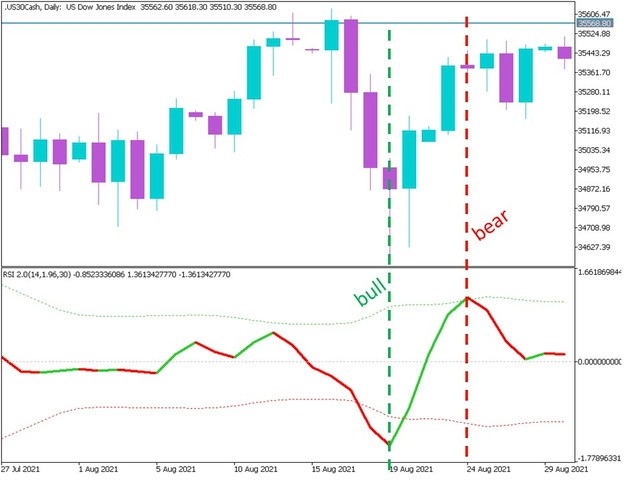
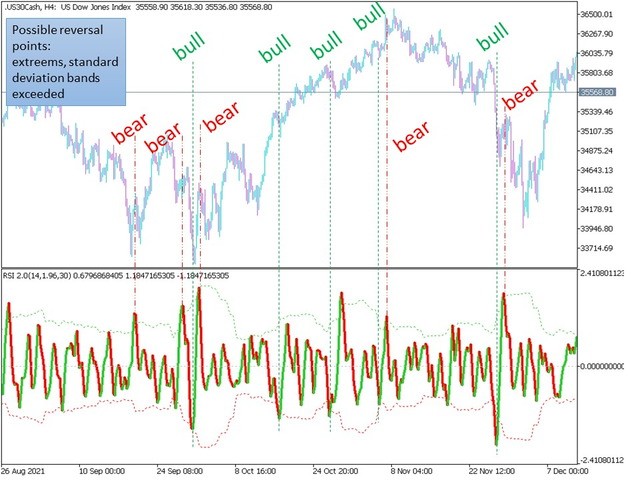
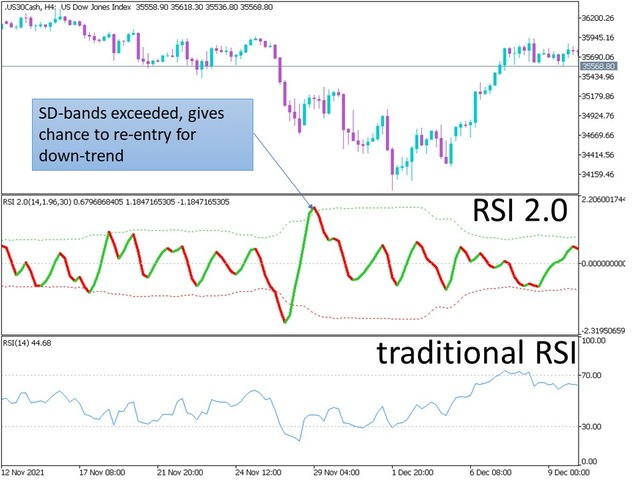
Areas/Levels of reversal: Overbought or oversold levels from traditional RSI have no statistical significance, therefore the standard deviation bands are implemented here, which can be used in similar way as possible reversal points.
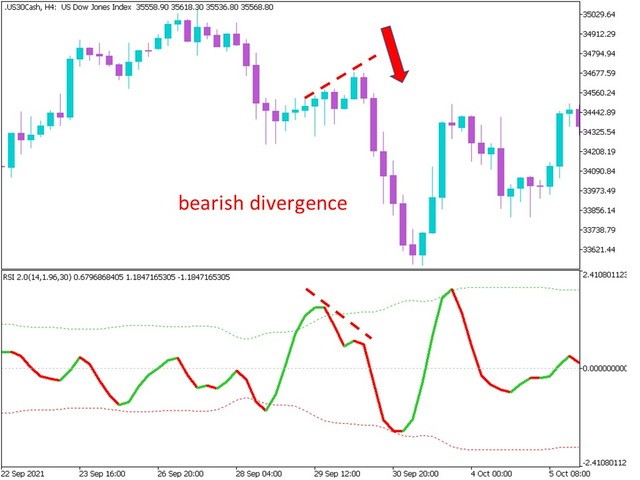
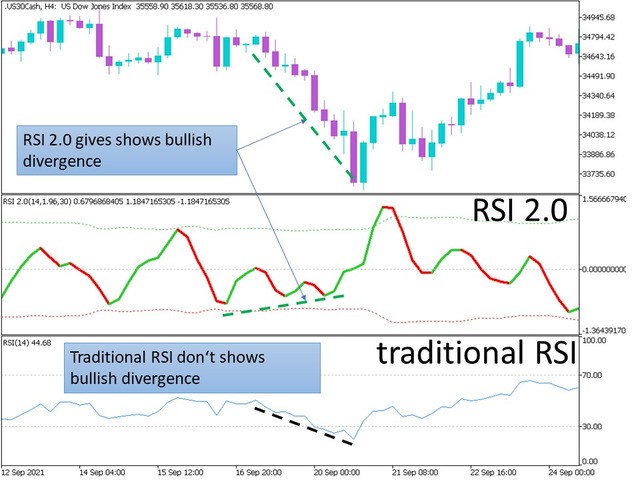
Divergence: As the indicator is nearly normal distributed, due to the signal processing, it can also be used as divergence indicator. This works much better than with traditional RSI, which can stay “overbought” or “oversold” for a long time, as mean is not zero (axis).
Use in confluence with other indicators made based on volatility, probability and statistics.
The Input Settings:
Sample Size RSI 2.0: Default 14, length of periods back to calculated RSI 2.0
Multiplier: default 1.96, Multiplier in terms of standard deviation, to show outliers/possible reversals (line colour change)
Sample Size Bands: Default 30, length of periods back to calculated SD-Bands of RSI 2.0
Remark: Indicator is provided for statistical analysis and showing probabilities only and should not be construed as financial advice.

