Supply and Demand Multi Timeframe Indicator
- Indicadores
- Roman Zhitnik
- Versão: 1.73
- Atualizado: 26 julho 2023
- Ativações: 5
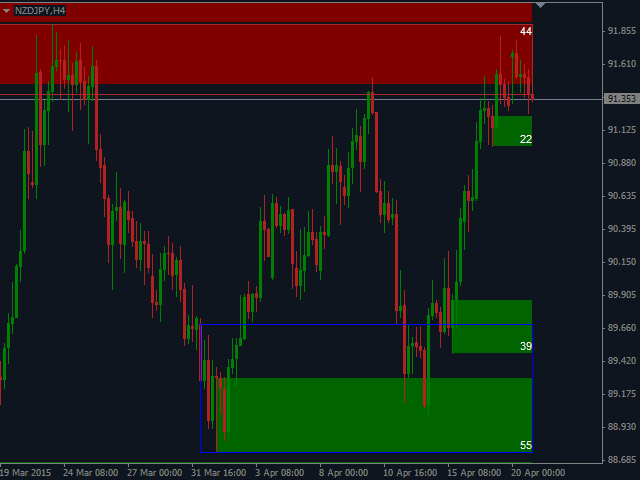
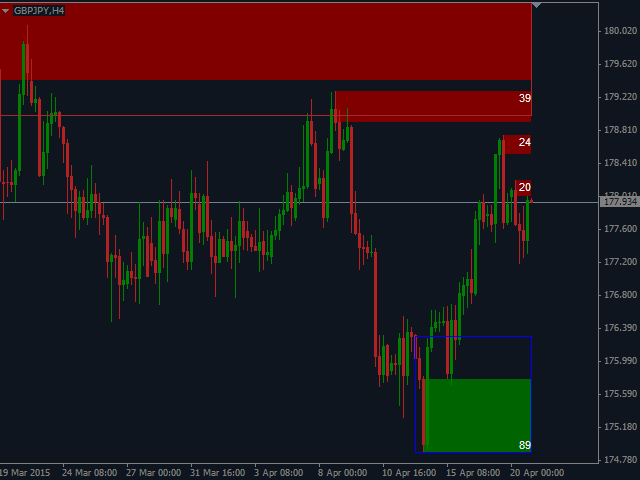
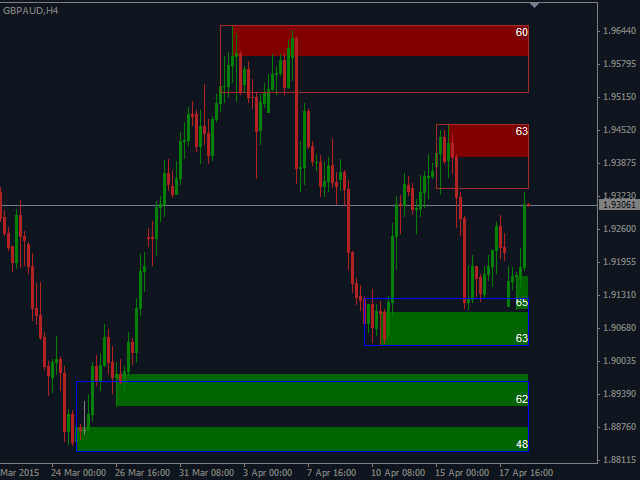
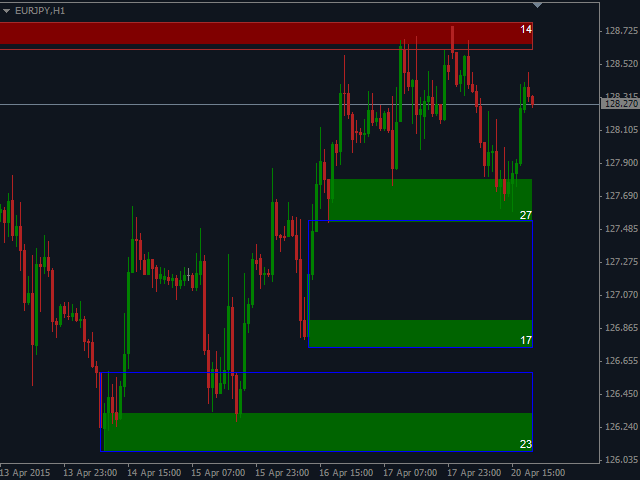
This is a multi timeframe version of the Supply and Demand indicator. It allows you to analyze a chart using the law of supply and demand on three different timeframes at a time. You will see zones of sales and purchases and determine the most profitable points to open positions. The indicator is based on the principle of market fractality.
Supply and demand zones show places where a strong buyer or seller has made the price reverse and change its direction. The indicator has several types of zones calculation. Color and width of zones are fully adjustable. Font and type of zones display can be changed as well. The alerts of price in zone, new zone formation, the break of zone and presense of price in zones on all timeframes are available. The Push notifications are presented as well.
Link to version for MetaTrader 5
Settings
- Print zones only after full outside bar close — display level only when the very first bar does not touch the potential zone;
- Show only untested zones — display only zones that were not touched by price yet;
- Type of zone — zone calculation principle:
- StandartZones - zone border is calculated using an average value of open and close prices of neighboring bars;
- ZonesWithFullCandles - zone border is calculated as Low of a bar which has formed a supply zone, or High of a bar which has formed a demand zone correspondingly;
- ZonesWithWicksOnly - zone border is calculated as the highest value among open/close prices of the bar which has formed the supply zone and the lowest value for the demand zone correspondingly;
- CertainZoneWidth - certain zone width;
- EngulfZones — zones formed by engulfing;
- Width of zone — zone width in pips (used if CertainZoneWidth is chosen as Type of zone);
- Colour of main TF Supply levels — color of main TF supply zones;
- Colour of main TF Demand levels — color of main TF demand zones;
- Type of line of main TF zones — type of lines of main TF zones;
- Width of line of main TF zones — width of lines of main TF zones;
- Draw main zones with background — fill zones with a color;
- Show the zone width — show width of zones (in pips);
- Font size of zone width display — zone width font size;
- Colour of zone size display — zone width font color;
- Timeframe of additional zones #1 — timeframe of additional zones #1;
- Timeframe of additional zones #2 — timeframe of additional zones #2;
- Colour of additional TF #1 Supply levels — color of additional TF #1 Supply zones;
- Colour of additional TF #1 Demand levels — color of additional TF #1 Demand zones;
- Type of line of additional TF #1 zones— type of line of additional TF #1 zones;
- Width of line of additional TF #1 zones— width of line of additional TF #1 zones;
- Colour of additional TF #2 Supply levels — color of additional TF #2 Supply zones;
- Colour of additional TF #2 Demand levels — color of additional TF #2 Demand zones;
- Type of line of additional TF #2 zones — type of line of additional TF #2 zones;
- Width of line of additional TF #2 zones — width of line of additional TF #2 zones;
- Draw additional zones with background — fill additional TF zones with a color;
- Alert when price is in zone — alert when price is in Demand or Supply zone;
- Alert only when price is in both TF zones — alert when price is in all timeframes Demand or Supply zones;
- Alert when new zone formed — alert when new Demand or Supply zone formed;
- Alert when zone broken by price — alert when Demand or Supply zone broken;
- Use Push notifications - use push notifications.
















Looks good, give 5 star, Author can you please add email alert? because your indicator no email alert and my broker phone push notification alert doesn't work, please add email alert ok? Thank you.