React Fibonacci Chart
- Indicadores
- Kim Yonghwa
- Versão: 1.6
- Atualizado: 5 junho 2024
Funcionalidades
- Indicador para Negociação de Retração de Fibonacci
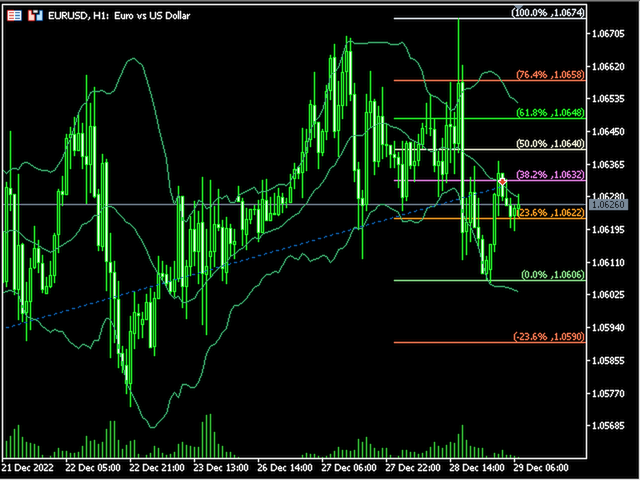
- Um gráfico de Fibonacci é desenhado com base na barra anterior selecionada entre 1H, 4H, 1D e 1W.
- Quando o preço de mercado toca o nível de Fibonacci, a cor muda e o horário do toque é exibido.
- O gráfico de Fibonacci é desenhado nos níveis -23.6, 0, 23.6, 38.2, 50, 61.8, 76.4, 100 e 123.6, e o gráfico é atualizado quando a barra é atualizada.
Variáveis
- Intervalo de tempo: Um gráfico de Fibonacci é desenhado com o intervalo de tempo selecionado entre 1H, 4H, 1D e 1W.
- FiboWidth: Determina a espessura do nível.
- FiboStyle: Define o estilo do nível pivô.
- TouchedColor: Cor que muda ao ser tocada.
Por favor, comente se encontrar erros ou gostaria de ver melhorias.
As avaliações são de grande ajuda para os desenvolvedores. Se estiver satisfeito, por favor, nos dê 5 estrelas.


good share