• Visão global
  • Comentários
  • Discussão

KT Half Trend MT4

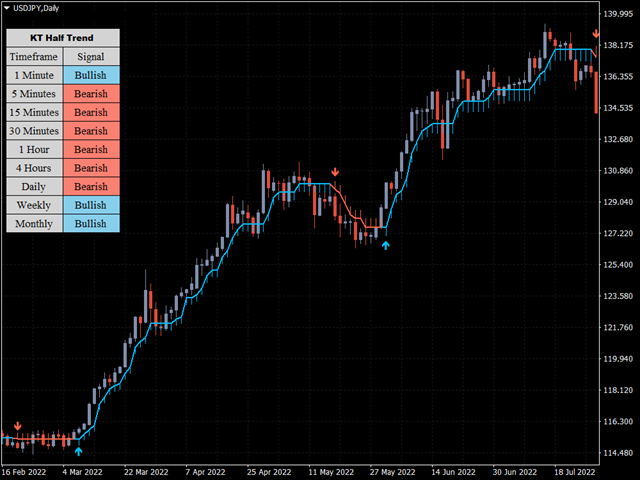
O KT HalfTrend é um indicador de tendência baseado em média móvel que desenha zonas no gráfico. Ele sinaliza uma mudança de tendência marcando zonas de invalidação altista e baixista.

Também exibe a força de compra e venda com setas no gráfico principal. Quando não há tendência, o indicador permanece plano, indicando zonas de acumulação, consolidação ou distribuição temporária. Quando há tendência, ele apresenta uma inclinação na direção correspondente.

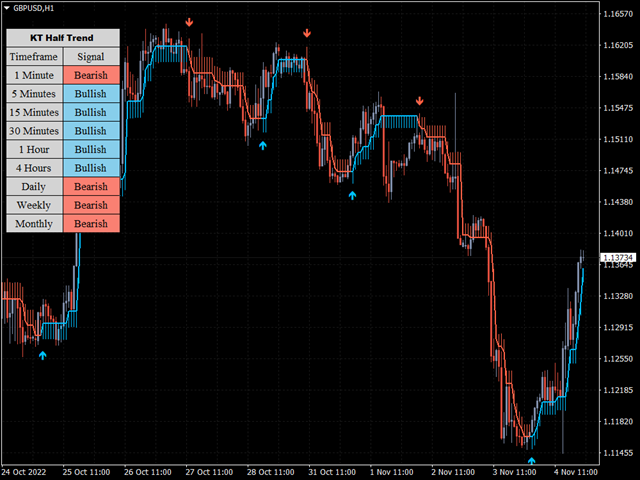
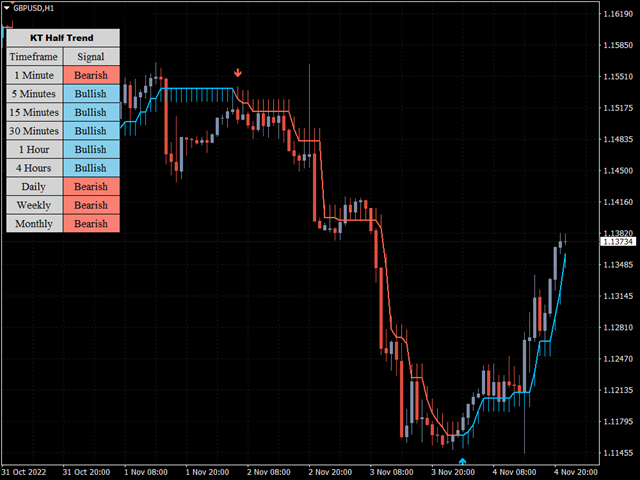
Os sinais de tendência são mais fortes quando a inclinação é acentuada, seja para cima ou para baixo. Uma forte tendência de alta pode ser destacada com a cor azul. Uma forte tendência de baixa pode ser destacada com a cor vermelha.

Recursos

  • É um indicador muito intuitivo e fácil de usar.
  • Pode ser utilizado com sucesso em qualquer par de moedas e período de tempo.
  • Oferece sinais tanto para entradas agressivas quanto conservadoras.
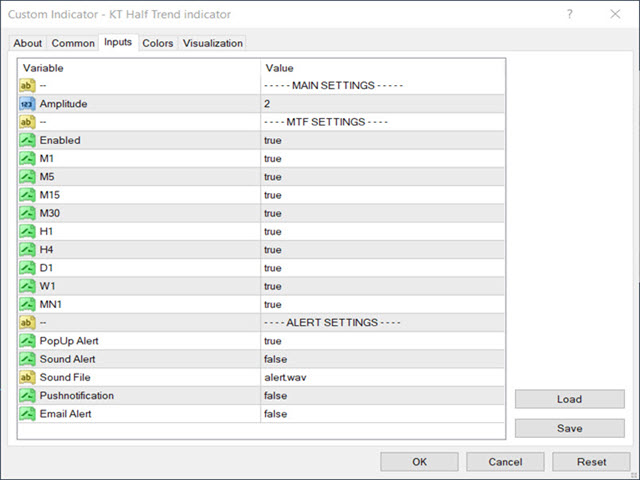
  • Permite personalizar a média móvel, configurações do Parabolic SaR e cores visuais.

Aplicações

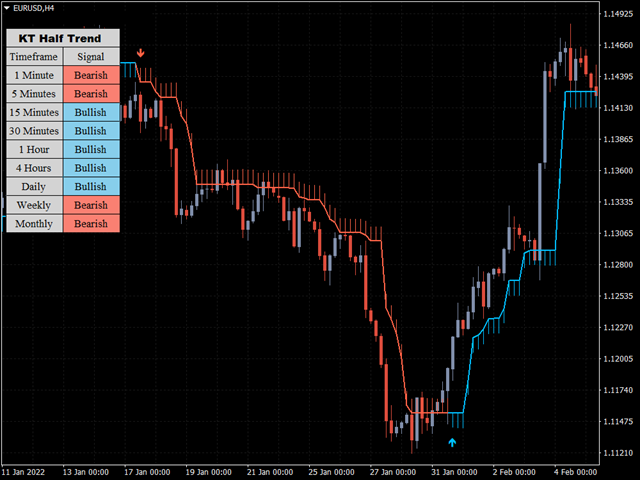
Normalmente, as condições de compra ocorrem quando o preço sobe acima da inclinação do indicador e o HalfTrend muda para azul.

Abaixo da vela de preço, uma seta azul para cima será exibida, indicando um movimento altista. O stop-loss deve ser colocado abaixo do indicador.

Se surgir uma seta vermelha apontando para baixo, recomenda-se encerrar a posição de compra ou definir um take-profit.

As condições de venda aparecem quando o preço cai abaixo da inclinação e o HalfTrend muda para vermelho.

Acima da vela, será exibida uma seta vermelha para baixo. Nesse caso, o stop-loss deve ser colocado acima do indicador.

Se uma seta azul para cima aparecer depois, considere encerrar a venda ou configurar um take-profit.

Produtos recomendados
KT 4 Timeframe Trend MT4
KEENBASE SOFTWARE SOLUTIONS
The KT 4 Time Frame Trend is an invaluable forex indicator for traders seeking to identify the trend direction across 4-time frames accurately. This innovative indicator allows users to simultaneously observe and analyze price trends across four different timeframes. Whether you're a beginner or an experienced trader, this tool offers an enhanced understanding of trend dynamics, leading to improved trading strategies on your trading platform. The capability to concurrently monitor multiple timef
VR Cub
Vladimir Pastushak
VR Cub é um indicador para obter pontos de entrada de alta qualidade. O indicador foi desenvolvido para facilitar cálculos matemáticos e simplificar a busca por pontos de entrada em uma posição. A estratégia de negociação para a qual o indicador foi escrito tem provado a sua eficácia há muitos anos. A simplicidade da estratégia de negociação é a sua grande vantagem, o que permite que até mesmo os comerciantes novatos negociem com sucesso com ela. VR Cub calcula os pontos de abertura de posição e
KT Pin Bar
KEENBASE SOFTWARE SOLUTIONS
KT Pin Bar identifies the pin bar formation which is a type of price action pattern which depicts a sign of reversal or rejection of the trend. When combined with support and resistance, BRN and other significant levels, Pin Bar pattern proved to be a very strong sign of reversal. Basically, a pin bar is characterized by a small body relative to the bar length which is closed either in upper or lower 50% part of its length. They have very large wicks and small candle body. A pin bar candlestic
RSI DIVERENCE INDICATOR RSI divergence is very powerful pattern which is often used to detect a strong trend reversal. it also indicates the weakening of strong signal. So some traders  want to use it as the exit criteria. This indicator works in all timeframe and send notification, alert or email to the user. It also show the Higher Highs and Lower Low Pattern with its corresponding RSI divergency. This indicator can be used in Expert Advisors as it has accessible buffers List of Inputs ______
Classical Divergence , Hidden Divergence both available . Enter a trade with the arrow on lower indicator. Nexus Divergence Pro is the best Divergence tool one can imagine with trade signals you will experience the super functionality. Needless to say how accurate divergence trading can be . Do your research on google you will understand its a standalone super accurate strategy.
This indicator scans for you up to 30 trading instruments and up to 8 timeframes for occurrences of the high probability reversal patterns: Double Tops/Bottoms with fake breakouts . Please read also the blog post " Professional Trading With Double Tops/Bottoms And Divergences! " which explains the concepts behind the ULTIMATE Double Top/Bottom indicator and how you can use a professional top-down approach. This FREE Version of the Scanner scans only EURUSD and GBPUSD. The full version of the sca
FREE
Apresentando o   Bollinger Band Volume Breakout Detector   , um poderoso indicador técnico projetado para aprimorar a popular   Bollinger Band Breakout Strategy   . Este indicador leva o acompanhamento de tendências para o próximo nível, incorporando dados de volume, minimizando efetivamente os sinais falsos. Ao aderir ao princípio de "o volume confirma o preço", esta ferramenta permite que os traders identifiquem quebras de preço acompanhadas de aumentos significativos no volume, garantindo dec
KT Horizontal Lines MT4
KEENBASE SOFTWARE SOLUTIONS
No MetaTrader, traçar várias   linhas horizontais   e acompanhar seus respectivos níveis de preço pode ser uma tarefa trabalhosa. Este indicador desenha automaticamente várias linhas horizontais em intervalos iguais para configurar alertas de preço, marcar níveis de suporte e resistência e outros usos manuais. Este indicador é ideal para traders iniciantes no Forex que estão em busca de oportunidades para obter lucros rápidos comprando e vendendo. As linhas horizontais ajudam a identificar possí
Fractal Channel Breakout MT4
KEENBASE SOFTWARE SOLUTIONS
KT Fractal Channel Breakout draws a continuous channel by connecting the successive Up and Down fractals. It provides alerts and also plots the Up and Down arrows representing the bullish and bearish breakout of the fractal channel. Features If you use Bill Williams fractals in your technical analysis, you must also include it in your trading arsenal. It can be very effective and useful for stop-loss trailing. A new market trend often emerges after a fractal channel breakout in a new direction.
Stochastic BR
Antony Augustine
Stochastic BR allows you to recognize reversals professionally. The "Stochastic BR" is designed to recognize profitable counter trend patterns from your chart. Stochastic Indicator: This technical indicator was developed by George Lane more than 50 years ago. The reason why this indicator survived for so many years is because it continues to show consistent signals even in these current times. The Stochastic indicator is a momentum indicator that shows you how strong or weak the current trend i
O indicador Crypto_Forex "Auto FIBO Pro" é uma ótima ferramenta auxiliar na negociação! - O indicador calcula e coloca automaticamente no gráfico os níveis de Fibonacci e as linhas de tendência locais (cor vermelha). - Os níveis de Fibonacci indicam áreas-chave onde o preço pode reverter. - Os níveis mais importantes são 23,6%, 38,2%, 50% e 61,8%. - Pode utilizá-lo para scalping de reversão ou para negociação de grelha de zona. - Existem muitas oportunidades para melhorar o seu sistema atual u
Higher High Lower Low MT4
KEENBASE SOFTWARE SOLUTIONS
KT Higher High Lower Low marca os seguintes pontos de oscilação com seus respectivos níveis de suporte e resistência: Higher High: O topo formado pelo preço que é mais alto que o topo anterior. Lower High: O topo formado pelo preço que é mais baixo que o topo anterior. Lower Low: O fundo formado pelo preço que é mais baixo que o fundo anterior.  Higher Low: O fundo formado pelo preço que é mais alto que o fundo anterior.   Recursos A intensidade dos topos e fundos pode ser ajustada alterando o
Trend Ray
Andriy Sydoruk
The indicator shows the potential trend direction by cyclical-wave dependence. Thus, all the rays of the intersection will be optimal rays, in the direction of which the price is expected to move, taking into account the indicator period. Rays can be used as a direction for potential market movement. But we must not forget that the approach must be comprehensive, the indicator signals require additional information to enter the market.
O indicador,   Support and Resistance Detect Signal   detecta automaticamente níveis de suporte e resistência e linhas de tendência, emitindo sinal sempre que a condição for respeitada, conforme configuração. Ele faz a leitura de suporte e resistências desenhadas manualmente ou embutidas automaticamente no gráficos por outros indicadores externos. Obs.: O   Support and Resistance Detect Signal   é compatível com quase todos indicadores externos que desenham no gráfico, níveis de suporte e res
Trend PA
Mikhail Nazarenko
5 (3)
The Trend PA indicator uses   Price Action   and its own filtering algorithm to determine the trend. This approach helps to accurately determine entry points and the current trend on any timeframe. The indicator uses its own algorithm for analyzing price changes and Price Action. Which gives you the advantage of recognizing, without delay, a new nascent trend with fewer false positives. Trend filtering conditions can be selected in the settings individually for your trading style. The indicator
Title : UT_Bot - ATR-Based Trading Indicator Introduction : Discover the power of "UT_Bot," the ultimate trading indicator that leverages the Average True Range (ATR) to provide unparalleled accuracy in your trading decisions. If you're seeking a more reliable alternative to the Super Trend indicator, look no further. UT_Bot is your key to precision trading. Key Features : ATR-Powered Precision: UT_Bot uses the ATR to deliver accurate signals that adapt to market volatility. Enhanced Trend Detec
Os indicadores [ZhiBiCCI] são adequados para todo o ciclo de uso e também são adequados para todas as variedades do mercado. [ZhiBiCCI] Linha sólida verde é uma inversão da divergência de alta. A linha pontilhada verde é uma divergência de alta clássica. [ZhiBiCCI] A linha sólida para o vermelho é uma divergência de baixa reversa. A linha pontilhada vermelha é uma divergência clássica de baixa. [ZhiBiCCI] pode ser definido nos parâmetros (Alerta, Enviar e-mail, Enviar notificação), definido c
NOTE: PRICE WILL RISE VERY SOON. DON'T SKIP THIS OFFER! Dear traders I am glad to introduce the " Market Swing Scanner Board" indicator to you. This indicator was made mainly to be used in combination with the Market Swing Index Indicator. You use the  "Market Swing Scanner Board"  indicator to scan for trading opportunities on the  Market Swing Index Indicator . This tool is designed for serious traders who have decided to make a difference through trading. Be the next person to witness this st
Alpha Trend sign has been a very popular trading tool in our company for a long time. It can verify our trading system and clearly indicate trading signals, and the signals will not drift. Main functions: Based on the market display of active areas, indicators can be used to intuitively determine whether the current market trend belongs to a trend market or a volatile market. And enter the market according to the indicator arrows, with green arrows indicating buy and red arrows indicating se
Doji Engulfing Paths
Boubacar Tidiane Traore
Presentation Doji Engulfing Paths enables to get signals and data about the doji and the engulfing patterns on charts. It makes it possible to get opportunities from trends, and to follow the directional moves to get some profits on the forex and stocks markets. It is a good advantage to take all the appearing opportunities with reversal signals and direct signals in order to obtain some profits on the forex market. System features With fast execution, it allows to register directly the informa
Multi Divergence Indicator for MT4 - User Guide Introduction Overview of the Multi Divergence Indicator and its capabilities in identifying divergences across multiple indicators. Importance of divergence detection in enhancing trading strategies and decision-making. List of Indicators RSI CCI MACD STOCHASTIC AWSOME MFI ACCELERATOR OSMA MOMENTUM WPR( Williams %R) RVI Indicator Features Indicator Selection:  How to enable/disable specific indicators (RSI, CCI, MACD, etc.) for divergence detectio
FREE
Trend Line Chart Pattern Signals  Is a traders Tool for Signals based on Strong  Patterns Formed By a pair of robust trend lines. They FOR WITH DIFFERENT POPULAR PATTERNS ON CHARTS LIKE – TRIANGLES, FLAGS,RANGE , ASCENDING TRIANGLES, DESCENDING PATTERNS, PENNANTS ETC. The TREND LINES  form  dynamically  on running bars. The  sensitivity  of the trend lines can be changed by custom settings. The  Buy and Sell Signals Generate upon Break Of the Trend Line + "Close" of the same bar above the previo
MegaTrends
Sivakumar Subbaiya
1 (1)
Megatrends  Indicator   Time Frame: Suitable for any time frame.  Purpose: Trend Prediction. Blue and red color indicate the buy and sell call respectively. Buy: When the blue line is originating it is opened buy call. Sell: When the Red line is origination it is opened sell call Happy trade!! this indicator is suitable for all time frame, but our recommended time frame to use 1hour and 4 hours, suitable for any chart.
FREE
KT Renko Patterns MT4
KEENBASE SOFTWARE SOLUTIONS
2.33 (3)
O KT Renko Patterns analisa o gráfico Renko tijolo por tijolo para identificar padrões gráficos conhecidos que são amplamente utilizados por traders em diversos mercados financeiros. Em comparação com gráficos baseados em tempo, os gráficos Renko tornam a identificação de padrões muito mais fácil e visualmente clara, graças à sua aparência limpa e objetiva. O KT Renko Patterns possui vários padrões Renko, muitos dos quais são explicados com profundidade no livro "Profitable Trading with Renko
Indicador único que implementa uma abordagem profissional e quantitativa para significar negociação de reversão. Ele capitaliza o fato de que o preço desvia e retorna à média de maneira previsível e mensurável, o que permite regras claras de entrada e saída que superam amplamente as estratégias de negociação não quantitativas. [ Installation Guide | Update Guide | Troubleshooting | FAQ | All Products ] Sinais de negociação claros Incrivelmente fácil de negociar Cores e tamanhos personalizáveis
If you are good at trading at levels This indicator is all you need levels to manage your trades Market is usually follow current trend when break out some levels or reverse Trade at the Institutional traders level with the best supply and demand zone indicator available in MT4 and MT5 The Secret Profit Levels Signals indicator for MT4 is a complete trading system that provides traders with the entry price and 2 take profit levels. Technical analysts use support and resistance levels to identi
Novo Indicador de Suporte e Resistência com Probabilidades e Alertas Descrição: Maximize seus lucros com o mais novo indicador de Suporte e Resistência! Nosso indicador calcula automaticamente os níveis de suporte e resistência com base em períodos de análise de 24 horas e fornece probabilidades detalhadas para cada nível. Além disso, você pode configurar alertas personalizados para ser notificado quando o preço tocar níveis específicos, diretamente no seu celular. Características: Análise de su
Indicador Crypto_Forex HTF Ichimoku para MT4. - O indicador Ichimoku é um dos indicadores de tendência mais poderosos. HTF significa Higher Time Frame (Quadro de Tempo Superior). - Este indicador é excelente para os traders de tendências, bem como em combinação com entradas de ação de preço. - O indicador HTF Ichimoku permite-lhe anexar Ichimoku de um período de tempo mais longo ao seu gráfico atual. - Tendência de alta - linha vermelha acima da azul (e ambas as linhas estão acima da nuvem) /
Signal Tower   indicator is designed for signal trading. This indicator generates trend signals. It uses many algorithms and indicators to generate this signal. It tries to generate a signal from the points with the highest trend potential. This indicator is a complete trading product. This indicator does not need any additional indicators. The indicator certainly does not repaint. The point at which the signal is given does not change. The indicator has a pips counter. You can see how many
Owl smart levels
Sergey Ermolov
4.24 (37)
Versão MT5  |  FAQ O   Indicador Owl Smart Levels   é um sistema de negociação completo dentro de um indicador que inclui ferramentas populares de análise de mercado, como   fractais avançados de Bill Williams , Valable ZigZag que constrói a   estrutura de onda correta   do mercado e   níveis de Fibonacci que marcam os níveis exatos de entrada no mercado e lugares para obter lucros. Descrição detalhada da estratégia Instruções para trabalhar com o indicador Consultor de negociação Owl Helper Ch
Os compradores deste produto também adquirem
Gann Made Easy
Oleg Rodin
4.79 (121)
Gann Made Easy é um sistema de negociação Forex profissional e fácil de usar, baseado nos melhores princípios de negociação usando a teoria do sr. W. D. Gann. O indicador fornece sinais precisos de COMPRA e VENDA, incluindo níveis de Stop Loss e Take Profit. Você pode negociar mesmo em movimento usando notificações PUSH. Entre em contato comigo após a compra! Vou compartilhar minhas dicas de negociação com você e ótimos indicadores de bônus de graça! Provavelmente você já ouviu muitas vezes sobr
Cycle Maestro
Stefano Frisetti
NOTE: CYCLEMAESTRO is distributed only on this website, there are no other distributors. Demo version is for reference only and is not supported. Full versione is perfectly functional and it is supported CYCLEMAESTRO , the first and only indicator of Cyclic Analysis, useful for giving signals of TRADING, BUY, SELL, STOP LOSS, ADDING. Created on the logic of Serghei Istrati and programmed by Stefano Frisetti ; CYCLEMAESTRO is not an indicator like the others, the challenge was to interpret only t
Gold Stuff
Vasiliy Strukov
4.86 (259)
Gold Stuff-um indicador de tendência projetado especificamente para o ouro, também pode ser usado em qualquer instrumento financeiro. O indicador não é redesenhado ou atrasado. O timeframe recomendado é H1. O EA Gold Stuff Expert Advisor está escrito neste indicador, você pode encontrá-lo no meu perfil. Importante! Entre em contato comigo imediatamente após a compra para obter instruções e bônus!  Você pode obter uma cópia gratuita do nosso indicador Strong Support e Trend Scanner, envie uma
Trend Screener
STE S.S.COMPANY
4.78 (93)
Indicador de tendência, solução única inovadora para negociação e filtragem de tendências com todos os recursos de tendências importantes construídos dentro de uma ferramenta! É um indicador multi-timeframe e multi-moedas 100% sem repintura que pode ser usado em todos os símbolos/instrumentos: forex, commodities, criptomoedas, índices e ações. OFERTA POR TEMPO LIMITADO: O indicador Support and Resistance Screener está disponível por apenas US$ 50e vitalício. (Preço original US$ 250) (oferta este
Scalper Inside PRO
Alexey Minkov
4.77 (65)
!SPECIAL SALE! An exclusive indicator that utilizes an innovative algorithm to swiftly and accurately determine the market trend. The indicator automatically calculates opening, closing, and profit levels, providing detailed trading statistics. With these features, you can choose the most appropriate trading instrument for the current market conditions. Additionally, you can easily integrate your own arrow indicators into Scalper Inside Pro to quickly evaluate their statistics and profitability
FX Volume
Daniel Stein
4.6 (35)
FX Volume: Vivencie o Verdadeiro Sentimento de Mercado sob a Perspectiva de um Corretor Visão Geral Rápida Quer aprimorar sua abordagem de trading? FX Volume fornece insights em tempo real sobre como traders de varejo e corretores estão posicionados—bem antes de relatórios atrasados como o COT. Seja para buscar ganhos consistentes ou simplesmente ter uma vantagem mais clara no mercado, FX Volume ajuda você a detectar grandes desequilíbrios, confirmar rompimentos e aperfeiçoar sua gestão de ris
Algo Pumping MT4
Ihor Otkydach
5 (7)
PUMPING STATION – Sua estratégia pessoal “tudo incluído” Apresentamos o PUMPING STATION — um indicador revolucionário para Forex que vai transformar sua maneira de operar em uma experiência empolgante e eficaz. Este não é apenas um assistente, mas sim um sistema de trading completo com algoritmos poderosos que vão te ajudar a operar de forma mais estável. Ao adquirir este produto, você recebe GRATUITAMENTE: Arquivos de configuração exclusivos: para uma configuração automática e desempenho máximo
TPSproTREND PrO
Roman Podpora
4.68 (25)
VERSION MT5        —        ИНСТРУКЦИЯ RUS           —        INSTRUCTIONS  ENG Principais funções: Sinais de entrada precisos SEM RENDERIZAÇÃO! Se aparecer um sinal, ele permanece relevante! Esta é uma diferença importante em relação aos indicadores de redesenho, que podem fornecer um sinal e depois alterá-lo, o que pode levar à perda de fundos depositados. Agora você pode entrar no mercado com maior probabilidade e precisão. Também existe a função de colorir as velas após o aparecimento da se
Advanced Supply Demand
Bernhard Schweigert
4.91 (294)
Atualmente com 33% de desconto! A melhor solução para qualquer Trader Novato ou especialista! Este indicador é uma ferramenta de negociação exclusiva, de alta qualidade e acessível porque incorporamos uma série de recursos proprietários e uma nova fórmula. Com esta atualização, você poderá mostrar fusos horários duplos. Você não só será capaz de mostrar um TF mais alto, mas também mostrar ambos, o TF do gráfico, MAIS o TF mais alto: MOSTRANDO ZONAS ANINHADAS. Todos os traders de Oferta e Demanda
System Trend Pro
Aleksandr Makarov
5 (2)
Special offer! https://www.mql5.com/ru/users/bossik2810 System Trend Pro - This is the best trend trading indicator!!! The indicator no repaint!!!  The indicator has   MTF   mode, which adds confidence to trading on the trend (   no repaint   ). How to trade? Everything is very simple, we wait for the first signal (big arrow), then wait for the second signal (small arrow) and enter the market in the direction of the arrow. (See screens 1 and 2.) Exit on the opposite signal or take 20-30 pips,
Currency Strength Exotics
Bernhard Schweigert
4.88 (32)
ACTUALMENTE 20% DE DESCONTO ! A melhor solução para qualquer novato ou comerciante especializado! Este Indicador é especializado para mostrar a força da moeda para quaisquer símbolos como Pares Exóticos de Commodities, Índices ou Futuros. É o primeiro do seu género, qualquer símbolo pode ser adicionado à 9ª linha para mostrar a verdadeira força da moeda de Ouro, Prata, Petróleo, DAX, US30, MXN, TRY, CNH etc. Esta é uma ferramenta de negociação única, de alta qualidade e acessível, porque inco
Actualmente 20% OFF ! A melhor solução para qualquer novato ou comerciante especializado! Este software de painel de instrumentos está a funcionar em 28 pares de moedas. É baseado em 2 dos nossos principais indicadores (Advanced Currency Strength 28 e Advanced Currency Impulse). Dá uma grande visão geral de todo o mercado Forex. Mostra valores avançados de força da moeda, velocidade de movimento da moeda e sinais para 28 pares de divisas em todos os (9) períodos de tempo. Imagine como a sua n
GOLD Impulse with Alert
Bernhard Schweigert
4.6 (10)
Este indicador é uma super combinação dos nossos 2 produtos Advanced Currency IMPULSE with ALERT  +   Currency Strength Exotics . Funciona para todos os períodos de tempo e mostra graficamente impulso de força ou fraqueza para as 8 principais moedas mais um Símbolo! Este Indicador é especializado para mostrar a aceleração da força da moeda para quaisquer símbolos como Ouro, Pares Exóticos, Commodities, Índices ou Futuros. É o primeiro do seu género, qualquer símbolo pode ser adicionado à 9ª
M1 Arrow
Oleg Rodin
5 (17)
Uma estratégia intradiária baseada em dois princípios fundamentais do mercado. O algoritmo é baseado na análise de volumes e ondas de preços usando filtros adicionais. O algoritmo inteligente do indicador dá um sinal apenas quando dois fatores de mercado se combinam em um. O indicador calcula ondas de um determinado intervalo no gráfico M1 usando os dados do período de tempo mais alto. E para confirmar a onda, o indicador utiliza a análise por volume. Este indicador é um sistema de negociação pr
Trend Arrow Super
Aleksandr Makarov
5 (2)
Special offer! https://www.mql5.com/ru/users/bossik2810 Trend Arrow Super The indicator not repaint or change its data. A professional, yet very easy to use Forex system. The indicator gives accurate BUY\SELL signals. Trend Arrow Super is very easy to use, you just need to attach it to the chart and follow simple trading recommendations. Buy signal: Arrow + Histogram in green color, enter immediately on the market to buy. Sell signal: Arrow + Histogram of red color, enter immediately on the m
FX Power MT4 NG
Daniel Stein
4.94 (18)
FX Power: Analise a Força das Moedas para Decisões de Negociação Mais Inteligentes Visão Geral FX Power é a sua ferramenta essencial para compreender a força real das principais moedas e do ouro em quaisquer condições de mercado. Identificando moedas fortes para comprar e fracas para vender, FX Power simplifica as decisões de negociação e revela oportunidades de alta probabilidade. Quer você prefira seguir tendências ou antecipar reversões usando valores extremos de Delta, esta ferramenta adap
StalkeR Arrow
Abdulkarim Karazon
5 (3)
StalkeR Arrow é um indicador de seta que dá sinal de compra e venda na barra aberta/intra-barra, este indicador é baseado em padrões de ação de preço e fractais este indicador fornece tp e sl para cada sinal de compra e venda, o tp e sl estão na forma de linhas acima e abaixo de cada sinal, eles se estendem até que um novo sinal seja formado este indicador possui painel/painel de backtesting que fornece estatísticas de vitórias/perdas de sinais históricos, este indicador não repinta ou pinta
Easy Breakout
Mohamed Hassan
5 (12)
After your purchase, feel free to contact me for more details on how to receive a bonus indicator called VFI, which pairs perfectly with Easy Breakout for enhanced confluence!   Easy Breakout is a powerful price action trading system built on one of the most popular and widely trusted strategies among traders: the Breakout strategy ! This indicator delivers crystal-clear Buy and Sell signals based on breakouts from key support and resistance zones. Unlike typical breakout indicators, it levera
Golden Trend Indicator
Noha Mohamed Fathy Younes Badr
5 (10)
Golden Trend indicator  is The best indicator for predicting trend movement this indicator never lags and never repaints and never back paints    and give  arrow buy and sell    before the candle appear  and it will help you and  will make your trading decisions clearer its work on all currencies and  gold and crypto and all time frame This unique  indicator uses very secret algorithms to catch the  trends, so you can trade using this indicator and see the trend clear on charts  manual guide and
Dynamic Forex28 Navigator
Bernhard Schweigert
5 (5)
Dynamic Forex28 Navigator - A ferramenta de negociação Forex de última geração. ATUALMENTE 49% DE DESCONTO. Dynamic Forex28 Navigator é a evolução dos nossos indicadores populares de longa data, combinando o poder de três em um: Indicador Advanced Currency Strength28 (695 avaliações) + Advanced Currency IMPULSE com ALERTA (520 avaliações) + Sinais CS28 Combo (Bônus). Detalhes sobre o indicador https://www.mql5.com/en/blogs/post/758844 O que o Next-Generation Strength Indicator oferece?  Tudo
TPSpro RFI Levels
Roman Podpora
4.85 (27)
Zonas de reversão / Volumes de pico / Zonas ativas de um grande player =       SISTEMA TS TPSPRO INSTRUÇÕES RUS       /       INSTRUÇÕES       ENG       /       Version MT5 Cada comprador deste indicador recebe adicionalmente GRATUITAMENTE: 6 meses de acesso aos sinais de negociação do serviço RFI SIGNALS - pontos de entrada prontos de acordo com o algoritmo TPSproSYSTEM. Materiais de treinamento com atualizações regulares - mergulhe na estratégia e aumente seu nível profissional. Suporte 24 h
Stratos Pali
Michela Russo
5 (3)
Stratos Pali Indicator   is a revolutionary tool designed to enhance your trading strategy by accurately identifying market trends. This sophisticated indicator uses a unique algorithm to generate a complete histogram, which records when the trend is Long or Short. When a trend reversal occurs, an arrow appears, indicating the new direction of the trend. Important Information Revealed Leave a review and contact me via mql5 message to receive My Top 5 set files for Stratos Pali at no cost! Dow
Hit Rate Top Bottom Signal
Martin Alejandro Bamonte
Hit Rate Top Bottom Signal Hit Rate Top Bottom Signal Hit Rate Top Bottom Signal oferece uma abordagem completamente inovadora. É ideal para aqueles que desejam avaliar previamente como o sinal funciona com um TP-SL específico e em quais PARES/TFs ele apresenta melhor desempenho. A estratégia Hit Rate Top Bottom Signal é uma ferramenta fundamental para qualquer trader e qualquer tipo de trading porque não só emite sinais precisos e sem repaint , indicando claramente quando operar e em qual direç
Market Structure Break Out
Ashkan Hazegh Nikrou
5 (3)
O Market Structure Break Out (MSB) é uma ferramenta avançada desenvolvida para MT4 e MT5 , projetada para ajudar os traders a visualizar o movimento do mercado como uma estrutura. Ele identifica e mostra sinais de trading importantes por meio de setas e alertas , tanto na direção da tendência quanto na direção contrária . Uma das funcionalidades principais é o desenho de zonas de oferta e demanda contínuas , fornecendo uma visão clara dos níveis importantes de preço. Além disso, o recurso de ba
Currency Strength Wizard é um indicador muito poderoso que fornece uma solução completa para uma negociação bem-sucedida. O indicador calcula o poder deste ou daquele par forex usando os dados de todas as moedas em vários intervalos de tempo. Esses dados são representados em uma forma de índice de moeda fácil de usar e linhas de energia de moeda que você pode usar para ver o poder desta ou daquela moeda. Tudo o que você precisa é anexar o indicador ao gráfico que deseja negociar e o indicador mo
Apresentando       Quantum Trend Sniper Indicator   , o inovador Indicador MQL5 que está transformando a maneira como você identifica e negocia as reversões de tendência! Desenvolvido por uma equipe de traders experientes com experiência comercial de mais de 13 anos,       Indicador de Atirador de Tendência Quântica       foi projetado para impulsionar sua jornada de negociação a novos patamares com sua forma inovadora de identificar reversões de tendência com precisão extremamente alta. ***Com
IQ FX Gann Levels a precision trading indicator based on W.D. Gann’s square root methods. It plots real-time, non-repainting support and resistance levels to help traders confidently spot intraday and scalping opportunities with high accuracy. William Delbert Gann (W.D. Gann) was an exceptional market analyst, whose trading technique was based on a complex blend of mathematics, geometry, astrology, and ancient mathematics which proved to be extremely accurate. Download the Metatrader 5 Version M
Experimente o "Chart Patterns All in One" no modo demo e receba um bônus. Envie-me uma mensagem após testar no modo demo para receber seu bônus. Deixe um comentário após a compra para receber 8 indicadores de alta qualidade como bônus. O indicador Chart Patterns All-in-One ajuda os traders a visualizar vários padrões gráficos comumente usados na análise técnica. Este indicador auxilia na identificação de comportamentos potenciais do mercado, mas não garante rentabilidade. Recomenda-se testar o
ACTUALMENTE COM 26% DE DESCONTO A melhor solução para qualquer novato ou comerciante especializado! Este Indicador é uma ferramenta comercial única, de alta qualidade e acessível, porque incorporámos uma série de características proprietárias e uma nova fórmula. Com apenas UM gráfico, pode ler a força da moeda para 28 pares de Forex! Imagine como a sua negociação irá melhorar porque é capaz de apontar o ponto exacto do gatilho de uma nova tendência ou oportunidade de escalada? Manual do util
O sistema PRO Renko é um sistema de negociação altamente preciso especialmente concebido para a negociação de gráficos RENKO. Trata-se de um sistema universal que pode ser aplicado a vários instrumentos de negociação. O sistema neutraliza eficazmente o chamado ruído de mercado, dando-lhe acesso a sinais de inversão precisos. O indicador é muito fácil de usar e tem apenas um parâmetro responsável pela geração de sinal. Você pode facilmente adaptar a ferramenta a qualquer instrumento de negocia
Mais do autor
Se você negocia Forex, ter informações detalhadas sobre a força das moedas e a correlação entre os pares pode levar suas operações a um novo patamar. A correlação ajudará a reduzir o risco pela metade, enquanto a análise de força ajudará a maximizar os lucros. Este indicador oferece uma abordagem híbrida para selecionar os pares de moedas mais adequados, combinando análise de força e correlação entre pares de moedas. Como usar a Análise de Força das Moedas Suponha que sua estratégia de negociaç
KT Asian Breakout Indicator
KEENBASE SOFTWARE SOLUTIONS
O indicador KT Asian Breakout analisa uma parte crítica da sessão asiática para gerar sinais de compra e venda em ambas as direções, com base na quebra de preço. Um sinal de compra ocorre quando o preço rompe acima da máxima da sessão, enquanto um sinal de venda ocorre quando o preço rompe abaixo da mínima da sessão. Coisas para lembrar Se a caixa da sessão for muito ampla verticalmente, deve-se evitar uma nova negociação, pois a maior parte da ação do preço já ocorreu dentro da sessão. Se a ve
KT Auto Fibo
KEENBASE SOFTWARE SOLUTIONS
O KT Auto Fibo desenha automaticamente os níveis de retração de Fibonacci com base na direção atual da tendência. Os pontos máximos e mínimos são selecionados automaticamente usando os valores máximos e mínimos disponíveis no gráfico. Você pode dar zoom e rolar o gráfico para ajustar os níveis de Fibonacci conforme necessário. Modos Automático:  Desenha automaticamente os níveis de Fibonacci com base na área do gráfico. Manual: Desenha os níveis de Fibonacci apenas uma vez. Depois disso, você p
KT Psar Arrows
KEENBASE SOFTWARE SOLUTIONS
O KT Psar Arrows plota setas no gráfico utilizando o indicador padrão Parabolic SAR. Uma seta de alta é desenhada quando a máxima da vela toca o SAR. Uma seta de baixa é desenhada quando a mínima da vela toca o SAR. Os sinais são gerados em tempo real, sem a necessidade de esperar o fechamento da vela.  Recursos Uma ferramenta útil para traders que desejam experimentar estratégias de negociação que envolvem o indicador Parabolic SAR.  Pode ser usado para identificar pontos de reversão no mercad
KT Volatility Oscillator
KEENBASE SOFTWARE SOLUTIONS
O Oscilador de Volatilidade KT analisa os dados de mercado passados e atuais utilizando uma fórmula matemática para exibir o resultado na forma de um oscilador. As ondas crescentes e decrescentes equivalem a alta e baixa volatilidade do ativo.  Em resumo, a volatilidade é simplesmente uma medida das flutuações de preço de um ativo ao longo de um determinado período de tempo. Sem volatilidade, haveria pouco movimento no mercado e os traders não poderiam lucrar com as variações de preço. Uso da V
KT MA Crossover MT5
KEENBASE SOFTWARE SOLUTIONS
O KT MA Crossover desenha setas de compra e venda com base no cruzamento das médias móveis selecionadas. Além disso, ele também gera os alertas apropriados e exibe o valor de MFE (Excursão Mais Favorável) para cada sinal consecutivo. O cruzamento de médias móveis é uma das estratégias mais utilizadas por traders em todo o mundo. Normalmente envolve uma média móvel rápida e uma lenta para identificar sinais de compra e venda com base na direção do cruzamento. Sinal de compra – quando a média móv
KT Momentum Arrows MT5
KEENBASE SOFTWARE SOLUTIONS
5 (2)
O indicador KT Momentum Arrows é baseado em uma quebra momentânea que é calculada usando a variação das bandas e a volatilidade emergente em determinada direção. Um sinal de compra é gerado quando o preço fecha acima da banda superior, e um sinal de venda é gerado quando o preço fecha abaixo da banda inferior. Um coeficiente de magnitude é utilizado como parâmetro de entrada, influenciando tanto a variação das bandas quanto a medição da volatilidade. O valor desse coeficiente deve ser escolhido
KT RSI Divergence Robot MT4
KEENBASE SOFTWARE SOLUTIONS
KT RSI Divergence robot is a 100% automated expert advisor that trades regular and hidden divergence built between the price and Relative Strength Index (RSI) oscillator. The divergence signals are fetched from our freely available RSI divergence indicator. Not every divergence ends up in a successful price reversal, that's why this ea combines the raw divergences signals with its inbuilt technical analysis module to exploit the price inefficiency that occurs after some selected divergence sig
KT RSI Divergence Robot MT5
KEENBASE SOFTWARE SOLUTIONS
KT RSI Divergence robot is a 100% automated expert advisor that trades regular and hidden divergence built between the price and Relative Strength Index (RSI) oscillator. The divergence signals are fetched from our freely available RSI divergence indicator. Not every divergence ends up in a successful price reversal, that's why this ea combines the raw divergences signals with its inbuilt technical analysis module to exploit the price inefficiency that occurs after some selected divergence sig
Use of support and resistance in systematic trading is very subjective. Every trader has their own idea and way to plotting the support and resistance levels on the chart. KT Support and Resistance indicator take out this ambiguity out of the situation and automatically draws support and resistance levels following an algorithmic approach using a unique multi-timeframe analysis. When launched on the chart, It immediately scan the most significant extreme points across all the available timefra
KT Stoch Divergence MT5
KEENBASE SOFTWARE SOLUTIONS
A divergência é um dos sinais mais importantes para indicar uma possível reversão de preço no mercado. O indicador KT Stoch Divergence identifica divergências regulares e ocultas entre o preço e o oscilador estocástico. Limitações do KT Stoch Divergence Usar divergência estocástica como único sinal de entrada pode ser arriscado. Nem toda divergência representa uma reversão forte. Para melhores resultados, combine com ação do preço e direção da tendência. Recursos Identifica divergências regul
KT Trend Magic MT5
KEENBASE SOFTWARE SOLUTIONS
KT Trend Magic shows the trend depiction on chart using the combination of market momentum and volatility. A smoothing coefficient is used to smooth out the noise from the signal.It can be used to find out the new entries or confirm the trades produced by other EA or indicator. Features Drag n drop MTF scanner which scans for the new signals across multiple time-frames. Find new entries in the trend direction. Improve the accuracy of other indicators when used in conjunction. Can be used as a d
KT Trend Magic
KEENBASE SOFTWARE SOLUTIONS
KT Trend Magic shows the trend depiction on chart using the combination of market momentum and volatility. A smoothing coefficient is used to smooth out the noise from the signal.It can be used to find out the new entries or confirm the trades produced by other EA/Indicators. Usage Drag n drop MTF scanner which scans for the new signals across multiple time-frames. Find new entries in the trend direction. Improve the accuracy of other indicators when used in conjunction. Can be used as a dynami
KT COG Advanced MT4
KEENBASE SOFTWARE SOLUTIONS
1 (1)
KT COG is an advanced implementation of the center of gravity indicator presented by John F. Ehlers in the May 2002 edition of Technical Analysis of Stocks & Commodities magazine. It's a leading indicator which can be used to identify the potential reversal points with the minimum lag. The COG oscillator catches the price swings quite effectively. MT5 version of the same indicator is available here KT COG Advanced MT5 Calculation of COG The COG indicator is consist of the two lines. The main l
KT CCI Divergence MT4
KEENBASE SOFTWARE SOLUTIONS
KT CCI Divergence shows the regular and hidden divergence created between the price and CCI oscillator. Divergence is one of the vital signals that depicts the upcoming price reversal in the market. Manually spotting the divergence between price and CCI can be a hectic and ambiguous task. Limitations of KT CCI Divergence   Using the CCI divergence as a standalone entry signal can be risky. Every divergence can't be interpreted as a strong reversal signal. For better results, try to combine it w
ACB Breakout Arrows
KEENBASE SOFTWARE SOLUTIONS
4.15 (34)
The ACB Breakout Arrows indicator provides a crucial entry signal in the market by detecting a special breakout pattern. The indicator constantly scans the chart for a settling momentum in one direction and provide the accurate entry signal right before the major move.  Get multi-symbol and multi-timeframe scanner from here - Scanner for ACB Breakout Arrows MT4 Key features Stoploss and Take Profit levels are provided by the indicator. Comes with a MTF Scanner dashboard which tracks the breako
ACB Trade Filter MT4
KEENBASE SOFTWARE SOLUTIONS
5 (1)
The ACB Trade Filter indicator provides a solution for filtering out the low probability trading setups in a trading strategy. The indicator uses a sophisticated filtration algorithm based on the market sentiment and trend. Applications Works great with our indicator " ACB Breakout Arrows ". Filter out low probability signals from any indicator. Avoid overtrading and minimize the losses. Trade in the direction of market sentiment and trend. Avoid the choppiness in the market. How to use Only L
KT Momentum Arrows
KEENBASE SOFTWARE SOLUTIONS
O indicador KT Momentum Arrows é baseado em uma quebra momentânea que é calculada usando a variação das bandas e a volatilidade emergente em determinada direção. Um sinal de compra é gerado quando o preço fecha acima da banda superior, e um sinal de venda é gerado quando o preço fecha abaixo da banda inferior. Um coeficiente de magnitude é utilizado como parâmetro de entrada, influenciando tanto a variação das bandas quanto a medição da volatilidade. O valor desse coeficiente deve ser escolhido
KT Pin Bar
KEENBASE SOFTWARE SOLUTIONS
KT Pin Bar identifies the pin bar formation which is a type of price action pattern which depicts a sign of reversal or rejection of the trend. When combined with support and resistance, BRN and other significant levels, Pin Bar pattern proved to be a very strong sign of reversal. Basically, a pin bar is characterized by a small body relative to the bar length which is closed either in upper or lower 50% part of its length. They have very large wicks and small candle body. A pin bar candlestic
KT Ichimoku Trader
KEENBASE SOFTWARE SOLUTIONS
1 (1)
KT Ichimoku Trader is a fully automated expert advisor that offers five popular trading strategies based on the Ichimoku indicator. Each strategy has it's own entry and exit method without any interference to other strategies. The Ichimoku system can be applied to all major currency pairs and metals. However, we found that it performs reasonably well mainly on two pairs.   MT5 Version is available here  https://www.mql5.com/en/market/product/35043 Features Trade up to 5 famous trading strategi
KT COG Robot
KEENBASE SOFTWARE SOLUTIONS
KT COG Robot is a fully automated Expert Advisor based on the KT COG Indicator . The COG indicator was originally presented by John F. Ehlers in the May 2002 edition of Technical Analysis of Stocks & Commodities magazine. The EA fires a long trade when COG line cross above the signal line and a short trade is fired when the COG line cross below the signal line.  Adaptive Filtration Our adaptive filtration algorithm combines the original COG formula with the major trend direction and market acce
ACB Breakout Arrows EA
KEENBASE SOFTWARE SOLUTIONS
This is a 100% automated expert advisor based on our custom indicator named "ACB Breakout Arrows" . The entries are based on a breakout pattern that constantly occurs in a bi-directional manner. The intensity of entry signals can be manipulated using the external input called "Signal Sensitivity". MT5 Version is available here  https://www.mql5.com/en/market/product/35785 Trades Confirmation ACB Breakout Arrows EA provides an ability to filter the entries using our another custom indicator nam
KT Asian Breakout
KEENBASE SOFTWARE SOLUTIONS
4 (1)
KT Asian Breakout carefully analyzes the range-bound market during the Asian session and then fires a long or short trade after doing some preassessment based on its inbuilt technical analysis module. The executed orders are closed within a day before the completion of the next day session. The inbuilt technical analysis module checks for the session range and compares it with the last 20 days price movement. If it finds any erratic price movement within the session, the orders are not executed
KT London Breakout
KEENBASE SOFTWARE SOLUTIONS
First thirty minutes are essential for a trading session. The early reaction of traders and market players sets a path for the rest of the day. KT London Breakout EA takes advantage of this phenomenon, and after analyzing the first thirty minutes of London session, it places two bidirectional pending orders. One of pending order is eventually canceled after realizing the market direction with certainty. It has been strictly tested and developed for EUR/JPY using 30-Min Time Frame. You can expe
MACD Divergence Seeker
KEENBASE SOFTWARE SOLUTIONS
KT MACD Divergence Seeker trades the regular and hidden divergence signals generated by our free indicator named KT MACD Divergence indicator. Trading the standalone divergences can be a risky affair that's why the KT MACD Divergence Seeker combines the standard divergence signals with an advanced analysis module to exploit the price inefficiencies on some FX pairs. What is the Divergence exactly? As a general conception if the price is making higher highs, then macd should also be making hig
MACD Divergence MT4
KEENBASE SOFTWARE SOLUTIONS
KT MACD Divergence shows the regular and hidden divergences build between the price and oscillator. If your trading strategy anticipates the trend reversal, you can include the MACD regular divergence to speculate the potential turning points. And if your trading strategy based on the trend continuation, MACD hidden divergence would be a good fit. Limitations of KT MACD Divergence Using the macd divergence as a standalone entry signal can be a risky affair. Every divergence can't be interprete
KT Bollinger Bands Trader MT4
KEENBASE SOFTWARE SOLUTIONS
KT Bollinger Bands Trader is a 100% automated expert advisor that's incorporated a mean reversion trading strategy using the Bollinger bands during the period of low volatility. Price often reacts at the upper or lower line of Bollinger bands, but a reversal not always occurs. However, there is more chance of price reversal during the time of low volatility. Entries A buy trade is activated when price correctly aligns below the bottom line of Bollinger bands. A sell trade is activated when pric
KT Heiken Ashi Smoothed MT4
KEENBASE SOFTWARE SOLUTIONS
KT Heiken Ashi Smoothed is a smoothed version of the standard Heiken Ashi. Moreover, it also plots buy/sell arrows on a trend change. A buy arrow is plotted when it change to a bullish state from bearish state. A sell arrow is plotted when it change to a bearish state from bullish state. Mobile notifications, Email, Sound and Pop-up alerts included. What exactly is Heiken Ashi Smoothed? It filters out the false signals and noise in the standard Heiken Ashi. It applies the set of two moving ave
KT MA Crossover MT4
KEENBASE SOFTWARE SOLUTIONS
O KT MA Crossover desenha setas de compra e venda com base no cruzamento das médias móveis selecionadas. Além disso, ele também gera os alertas apropriados e exibe o valor de MFE (Excursão Mais Favorável) para cada sinal consecutivo. O cruzamento de médias móveis é uma das estratégias mais utilizadas por traders em todo o mundo. Normalmente envolve uma média móvel rápida e uma lenta para identificar sinais de compra e venda com base na direção do cruzamento. Sinal de compra – quando a média móv
KT Round Numbers MT4
KEENBASE SOFTWARE SOLUTIONS
KT Round Numbers plots the round number levels which are also commonly known as psychological levels in the Forex world. In the context of Forex trading, round number levels are those levels in which there are two or more zeroes at the end. They are named as 00 levels on the chart. Some traders also consider the halfway points as a valid round number level. They are named as 50 levels on the chart. Use of round number levels in trading Round number levels work as strong support and resistance
Filtro:
Sem comentários
Responder ao comentário