• Visão global
  • Comentários
  • Discussão (5)

QQE Mod Indicator

The Quantitative Qualitative Estimation (QQE) indicator is derived from Wilder’s famous Relative Strength Index (RSI). In essence, the QQE is a heavily smoothed RSI.

Modification of this version: ( converted from tradingview script by Mihkell00, original from Glaz)
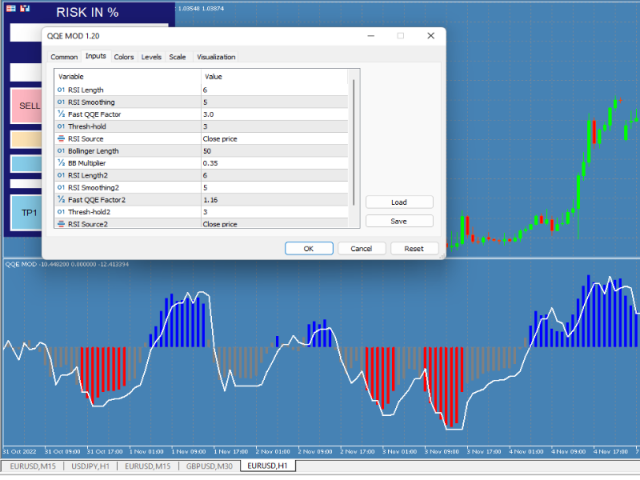
So there are Two QQEs. One that is shown on the chart as columns, and the other "hidden" in the background which also has a 50 MA bollinger band acting as a zero line.
When both of them agree - you get a blue or a red bar.


Produtos recomendados
The 4 headed dragon is an indicator that has two functions. 1) Set the background trend. 2) Mark the predominant trend. By combining these two indicator signals, we will be able to trade for or against the trend, adapting the signals to your reading of the market. You can download the demo and test it yourself. 1) Set the background trend.    Define four possibilities of trend that are the four heads of the dragon, marked by colors on the indicator, marking a) Powerful buying trend. b) Weak
Kill Zones MT5
Diego Arribas Lopez
MT4 Version Kill Zones Kill Zones allows you to insert up to 3 time zones in the chart. The visual representation of the Kill Zones in the chart together with an alert and notification system helps you to ignore fake trading setups occurring outside the Kill Zones or specific trading sessions. Using Kill Zones in your trading will help you filter higher probability trading setups. You should select time ranges where   the market   usually reacts with high volatility. Based on   EST time zone, fo
This Indicator adding power to traditional zigzag indicator. With High-Low numbers in vision it will be easier to estimate change of trend by knowing the depth of each wave. Information including points, pips, percentage%, and #bars can be displayed based on configuration. All information is real-time update. This indicator is especially useful in sideway market to buy low sell high.
Introducing RSIScalperPro - the revolutionary RSI-based indicator for Metatrader 5, specifically designed for scalping in the one-minute chart. With RSIScalperPro, you'll have a powerful toolkit for precise entry and exit signals to take your trading to the next level. RSIScalperPro utilizes two different RSI indicators that provide clear signals for overbought and oversold areas. You can customize the time periods and limit values of the two RSIs according to your preferences to achieve the be
O Histograma ADX do HiperCube está aqui! Código de desconto de 25% na Darwinex Zero: DWZ2328770MGM Estes indicadores ajudam-no a saber se poderia ser uma forte tendência no mercado. O ADX é um indicador muito popular e útil, pelo que muitos reconhecimentos dos principais comerciantes o utilizam como filtros para negociações más ou em combinações de outras análises. Com o HiperCube ADX será uma exoeriência premium usando uma bela e um grande indicador para a sua negociação. FUNCIONALIDADES: To
FREE
Introducing the Smart Money Concepts (SMC) and Inner Circle Trader (ICT) Indicator, an advanced tool designed for professional traders seeking precision in their decisions. This indicator directly integrates the fundamental principles of SMC/ICT into your charts, providing clear and reliable visual signals to help you identify key opportunities. Indicator Configuration Guide: Click here Integrated Concepts: Fair Value Gap (FVG) Order Blocks Imbalance  Gap Equal Highs and Equal Lows Highs and Lo
About indicator > The indicator is a function based on one value (open/high prices up to now) and then it is a mathematical representation of the whole function that is totally independent from any else values. So, if you ask yourself will the future be as it is on the graph... I can tell you - as it was the same as the trading function up to the moment "now"... In conclusion, the point of the indicator is  to try to show the future of the trading function into eternity. The graphic is sometime
The indicator colors the candles relative to their volume delta. The calculation of the candles delta is based on the tick history or on the deals tape history (see below for a description of the input variable "Volumes"). Coloring is performed by two parameters : by delta sign, as candle color, by delta value, as candle color contrast against chart window background color. In addition to coloring the candles, the indicator also displays the delta profile on the interval specified by the user
1. Why did I develop this series of indicators I found that most traders need to use multiple time frame indicators. They usually switch time frame to see indicators. However, once the timeframe is switched, you cannot see the  corresponding relationship  between  the price in the smaller timeframe  and  the indicator in the larger timeframe . For example: if your price chart is in H1 timeframe, you can see H4, D1 and W1 indicators in H1 timeframe Chart. This is more helpful for you to find th
Indicator introduction:  A channel and trend line indicator, which is a good tool for manual trading, and also can be used for creating new EAs, without drifting or repainting.  It applies to any timeframes and any symbols.   The work of the indicator is shown in the screenshots. For any novice and programming trading friend, you can write the signal into the EA to play freely, buffer 0 corresponds to the bold trend line, buffer 4 and 5 respectively corresponds to the channel's upper and lower f
FVG for MT5
Nicola Capatti
Indicador "Fair Value Gap" (FVG) - Descubra o Poder das Descontinuidades de Mercado O mundo do trading está repleto de oportunidades ocultas, mas somente aqueles que possuem as ferramentas certas conseguem identificá-las e aproveitá-las de forma eficaz. O nosso Indicador FVG foi projetado para ajudá-lo a fazer exatamente isso. Se você é um trader que busca aprimorar sua capacidade de leitura do mercado e identificar os melhores pontos de entrada e saída, o Indicador FVG é o seu aliado perfeito.
Este sinal DYJ é um sistema de transação completo baseado na especificação ATR. Esses indicadores registram o status atual de cada tendência de força em cada par de tempo e moeda analisada. Os sinais de Energia da DYJ avaliam esses dados para criar uma exibição profissional da intensidade da tendência e da lista de sinais de ponto de entrada. Se algum par corresponder exatamente, um alerta indicará essa condição. Os dados da lista incluem Symbol, M5 MN1, BuyPercent, SellPercent e LastEntry. Las
1. Why did I develop this series of indicators I found that most traders need to use multiple time frame indicators. They usually switch time frame to see indicators. However, once the timeframe is switched, you cannot see the  corresponding relationship  between  the price in the smaller timeframe  and  the indicator in the larger timeframe . For example: if your price chart is in H1 timeframe, you can see H4, D1 and W1 indicators in H1 timeframe Chart. This is more helpful for you to find th
The Fat and Slim indicator tracks strong and weak money in the market. It is derived from RSI, MFI and many similar indicators. Input values are closing prices and volumes. The RSI (yellow curve) is in the range -100 ... 100. It is additionally multiplied by a coefficient so that the curve is not compressed to the middle values at higher periods (a problem with the classic RSI with different periods). Strong/Fat red curve is RSI weighted by higher volumes. Weak/Slim blue curve is calculated so t
1. Why did I develop this series of indicators I found that most traders need to use multiple time frame indicators. They usually switch time frame to see indicators. However, once the timeframe is switched, you cannot see the  corresponding relationship  between  the price in the smaller timeframe  and  the indicator in the larger timeframe . For example: if your price chart is in H1 timeframe, you can see H4, D1 and W1 indicators in H1 timeframe Chart. This is more helpful for you to find th
Este indicador do painel de controle de zona de oferta e demanda com vários períodos e vários símbolos envia alertas quando o preço atinge uma zona de oferta / demanda. Também é possível usá-lo para ser alertado sobre topos / fundos duplos regulares em vez de zonas. Ele pode ser usado com todos os intervalos de tempo de M1 a MN.       No máximo 9 períodos de tempo podem ser mostrados no painel ao mesmo tempo.   É possível usar RSI, divergência (MACD, OsMA, RSI ou Awesome) e filtros de padrões de
1. Why did I develop this series of indicators I found that most traders need to use multiple time frame indicators. They usually switch time frame to see indicators. However, once the timeframe is switched, you cannot see the  corresponding relationship  between  the price in the smaller timeframe  and  the indicator in the larger timeframe . For example: if your price chart is in H1 timeframe, you can see H4, D1 and W1 indicators in H1 timeframe Chart. This is more helpful for you to find th
Descriptions A point point is a technical analysis indicator, or calculations, used to determine the overall trend of market over different time frames. This indicator calculate the highest or lowest pivots among left x and right y bars and show the high/low level during that period.   From that, you could clearly see the top resistance & bottom support level and how market goes break out. Instructions pivotLeft - pivot left bar count pivotRight - pivot right bar count pivotHighColor - color
Trailing Uses Standard Deviation.   A daptive_Trailing_uses_StdDev_Indicator is an indicator of directional movement that allows you to identify a trend at the time of its inception and set the levels of a protective stop. Unlike trailing with a constant distance, the indicator uses the distance to the price proportional to the current standard deviation of StdDev. The distance is equal to the product of the standard deviation and the constant coefficient set by the user. Thus, the trailing
The Trap Play MT5
Carl Gustav Johan Ekstrom
5 (1)
You can also access this indicator for FREE on TradingView! Link: The Trap Play Trap Play  refers to a market situation where price initially makes a new high or low, luring traders into believing a strong trend is forming. However, the price quickly reverses and invalidates the breakout, trapping those traders who entered positions based on the initial move. This sudden reversal often results in a rapid exit of positions, leading to significant price movement in the opposite direction.  Trap p
FREE
The Rise of Sky walker   is a trend indicator is a powerful indicator for any par and any timeframe. It doesn't requires any additional indicators for the trading setup.The indicator gives clear signals about opening and closing trades.This Indicator is a unique, high quality and affordable trading tool.  Can be used in combination with other indicators Perfect For New Traders And Expert Traders Low risk entries. Never repaints signal. Never backpaints signal. Never recalculates signal. Great Fo
1. Why did I develop this series of indicators I found that most traders need to use multiple time frame indicators. They usually switch time frame to see indicators. However, once the timeframe is switched, you cannot see the  corresponding relationship  between  the price in the smaller timeframe  and  the indicator in the larger timeframe . For example: if your price chart is in H1 timeframe, you can see H4, D1 and W1 indicators in H1 timeframe Chart. This is more helpful for you to find th
Squeeze Momentum Indicator for MetaTrader 5 - Unleash the Power of Market Momentum Introducing the "Squeeze Momentum Indicator" for MetaTrader 5, your gateway to mastering market momentum. This advanced tool is meticulously crafted to provide you with actionable insights into market dynamics, helping you make well-informed trading decisions. Basic Details : Indicator Type : Squeeze Momentum Indicator for MetaTrader 5 Key Metrics : Real-time analysis of market momentum and volatility. Customizati
1. Why did I develop this series of indicators I found that most traders need to use multiple time frame indicators. They usually switch time frame to see indicators. However, once the timeframe is switched, you cannot see the  corresponding relationship  between  the price in the smaller timeframe  and  the indicator in the larger timeframe . For example: if your price chart is in H1 timeframe, you can see H4, D1 and W1 indicators in H1 timeframe Chart. This is more helpful for you to find th
VWAP Indicator MT5
Kyra Nickaline Watson-gordon
Description : VWAP (Volume-Weighted Average Price) is the ratio of the value traded to total volume traded over a particular time horizon. It is a measure of the average price at which pair is traded over the trading horizon. Read More. All Symbols and All Timeframes are supported. Indicator Inputs :     VWAP Mode : Mode of VWAP Calculation. Options can be selected : Single,Session,Daily,Weekly,Monthly     Volumes : Real Volumes,Tick Volumes     Price Type : Used price for calculating. O
To get access to MT4 version please click   here . This is the exact conversion from TradingView: QQE MT4 Glaz-modified by JustUncleL This is a light-load processing and non-repaint indicator. All input options are available. This is not a multi time frame indicator. Buffers are available for processing in EAs. You can message in private chat for further changes you need.
Trend Monitor VZ MT5
Sergey Ermolov
5 (1)
Versão MT4  |   Indicador Valable ZigZag  |   FAQ A Teoria da Onda Elliott   é uma interpretação dos processos nos mercados financeiros, que se baseia no modelo visual das ondas nas tabelas de preços. De acordo com esta teoria, podemos saber exactamente qual é a tendência que prevalece actualmente no mercado, ascendente ou descendente. O   indicador Valable ZigZag   mostra a   estrutura de ondas do mercado , bem como indica a direcção da tendência principal no momento, no horizonte temporal act
【Super Scanner】Indicator Introduction : The color of the Super Scanner which is green and climbing up means that the price trend is going up.The color of the Super Scanner is red and going down means that the price trend is going down. It is very simple to use it to judge the market trend! What's even better is that the open parameters of the indicators allow investors to adjust. You can adjust【Super Scanner】according to your needs. Adjust it faster to be closer to short-term market fluctuatio
Os compradores deste produto também adquirem
Trend Screener Pro MT5
STE S.S.COMPANY
4.85 (79)
Desbloqueie o poder da negociação de tendências com o indicador Trend Screener: sua solução definitiva de negociação de tendências, alimentada por lógica difusa e sistema de múltiplas moedas! Eleve sua negociação de tendências com o Trend Screener, o revolucionário indicador de tendências alimentado por lógica difusa. É um poderoso indicador de acompanhamento de tendências que combina mais de 13 ferramentas e recursos premium e 3 estratégias de negociação, tornando-o uma escolha versátil para to
Описание индикатора MONEY Индикатор MONEY предназначен для анализа волатильности и выявления значительных рыночных движений (всплесков). Он использует ATR (Average True Range) для определения момента, когда цена выходит за пределы обычного диапазона, и сигнализирует об этом трейдеру с помощью стрелок на графике. Основные параметры: • Минимальное количество свечей – задает период для анализа всплесков. • Алерты (уведомления) – включение или отключение звуковых и текстовых сигналов. • Период AT
Golden Trend Indicator MT5
Noha Mohamed Fathy Younes Badr
4.88 (17)
Golden Trend indicator  is The best indicator for predicting trend movement this indicator never lags and never repaints and never back paints    and give  arrow buy and sell    before the candle appear  and it will help you and  will make your trading decisions clearer its work on all currencies and  gold and crypto and all time frame This unique  indicator uses very secret algorithms to catch the  trends, so you can trade using this indicator and see the trend clear on charts  manual guide and
Algo Pumping
Ihor Otkydach
5 (5)
PUMPING STATION – Sua estratégia pessoal “tudo incluído” Apresentamos o PUMPING STATION — um indicador revolucionário para Forex que vai transformar sua maneira de operar em uma experiência empolgante e eficaz. Este não é apenas um assistente, mas sim um sistema de trading completo com algoritmos poderosos que vão te ajudar a operar de forma mais estável. Ao adquirir este produto, você recebe GRATUITAMENTE: Arquivos de configuração exclusivos: para uma configuração automática e desempenho máxim
FX Power MT5 NG
Daniel Stein
5 (13)
FX Power: Analise a Força das Moedas para Decisões de Negociação Mais Inteligentes Visão Geral FX Power é a sua ferramenta essencial para compreender a força real das principais moedas e do ouro em quaisquer condições de mercado. Identificando moedas fortes para comprar e fracas para vender, FX Power simplifica as decisões de negociação e revela oportunidades de alta probabilidade. Quer você prefira seguir tendências ou antecipar reversões usando valores extremos de Delta, esta ferramenta adap
Grabber System MT5
Ihor Otkydach
5 (5)
Apresento a você um excelente indicador técnico: Grabber, que funciona como uma estratégia de trading “tudo incluído”, pronta para usar. Em um único código estão integradas ferramentas poderosas de análise técnica de mercado, sinais de entrada (setas), funções de alertas e notificações push. Cada comprador deste indicador também recebe gratuitamente: Utilitário Grabber: ferramenta para gerenciamento automático de ordens abertas Vídeo tutorial passo a passo: como instalar, configurar e operar com
O Support And Resistance Screener está em um indicador de nível para MetaTrader que fornece várias ferramentas dentro de um indicador. As ferramentas disponíveis são: 1. Screener de estrutura de mercado. 2. Zona de retração de alta. 3. Zona de retração de baixa. 4. Pontos de Pivô Diários 5. Pontos Pivot semanais 6. Pontos Pivot mensais 7. Forte suporte e resistência com base no padrão harmônico e volume. 8. Zonas de nível de banco. OFERTA POR TEMPO LIMITADO: O indicador de suporte e resistência
FX Volume MT5
Daniel Stein
4.82 (17)
FX Volume: Vivencie o Verdadeiro Sentimento de Mercado sob a Perspectiva de um Corretor Visão Geral Rápida Quer aprimorar sua abordagem de trading? FX Volume fornece insights em tempo real sobre como traders de varejo e corretores estão posicionados—bem antes de relatórios atrasados como o COT. Seja para buscar ganhos consistentes ou simplesmente ter uma vantagem mais clara no mercado, FX Volume ajuda você a detectar grandes desequilíbrios, confirmar rompimentos e aperfeiçoar sua gestão de ris
FX Levels MT5
Daniel Stein
5 (4)
FX Levels: Suporte e Resistência com Precisão Excepcional para Todos os Mercados Visão Geral Rápida Procurando um meio confiável de identificar níveis de suporte e resistência em qualquer mercado—incluindo pares de moedas, índices, ações ou commodities? FX Levels combina o método “Lighthouse” tradicional com uma abordagem dinâmica de vanguarda, fornecendo uma precisão quase universal. Baseado em nossa experiência real com corretores e em atualizações automáticas diárias mais as de tempo real,
Gold Stuff mt5
Vasiliy Strukov
4.93 (178)
Gold Stuff mt5-um indicador de tendência projetado especificamente para o ouro, também pode ser usado em qualquer instrumento financeiro. O indicador não é redesenhado ou atrasado. O timeframe recomendado é H1. Importante! Entre em contato comigo imediatamente após a compra para obter instruções e bônus!  Você pode obter uma cópia gratuita do nosso indicador Strong Support e Trend Scanner, envie uma mensagem privada. a mim! PARÂMETRO Draw Arrow-incl.desligado. desenhar setas no gráfico. Aler
TPSpro RFI Levels MT5
Roman Podpora
4.55 (20)
INSTRUÇÕES         Russo   -        ENG       R   ecomendado para uso com um indicador       -       TPSpro   TREND PRO -   Versão MT4         Principais funções:: Exibindo zonas ativas para vendedores e compradores! O indicador mostra todos os níveis/zonas de impulso inicial corretos para compra e venda. Após a ativação desses níveis/zonas, onde a busca por pontos de entrada começa, os níveis mudam de cor e são preenchidos com tons específicos. Além disso, setas aparecem para uma compreensão m
Este painel mostra os últimos   padrões harmónicos   disponíveis para os símbolos seleccionados, pelo que poupará tempo e será mais eficiente /   versão MT4 . Indicador gratuito:   Basic Harmonic Pattern Colunas do indicador Symbol :   aparecem os símbolos seleccionados Trend :   de alta ou de baixa Pattern :   tipo de padrão (gartley, borboleta, morcego, caranguejo, tubarão, cifra ou ABCD) Entry :   preço de entrada SL:   preço de paragem de perda TP1:   preço do 1º take profit TP2:   preço
TPSproTREND PrO MT5
Roman Podpora
4.72 (18)
VERSION MT4        —        ИНСТРУКЦИЯ RUS           —        INSTRUCTIONS  ENG Principais funções: Sinais de entrada precisos SEM RENDERIZAÇÃO! Se aparecer um sinal, ele permanece relevante! Esta é uma diferença importante em relação aos indicadores de redesenho, que podem fornecer um sinal e depois alterá-lo, o que pode levar à perda de fundos depositados. Agora você pode entrar no mercado com maior probabilidade e precisão. Também existe a função de colorir as velas após o aparecimento da set
IX Power MT5
Daniel Stein
4.86 (7)
IX Power: Descubra informações de mercado para índices, commodities, criptomoedas e forex Visão Geral IX Power é uma ferramenta versátil projetada para analisar a força de índices, commodities, criptomoedas e símbolos de forex. Enquanto o FX Power oferece a máxima precisão para pares de moedas ao utilizar dados de todos os pares disponíveis, o IX Power foca exclusivamente nos dados do mercado do símbolo subjacente. Isso torna o IX Power uma excelente escolha para mercados fora do forex e uma o
Matrix Arrow Indicator MT5
Juvenille Emperor Limited
5 (13)
O   Matrix Arrow Indicator MT5   é uma tendência única 10 em 1 seguindo um indicador multi-timeframe   100% sem repintura   que pode ser usado em todos os símbolos/instrumentos:   forex ,   commodities ,   criptomoedas ,   índices ,   ações .  O  Matrix Arrow Indicator MT5  determinará a tendência atual em seus estágios iniciais, reunindo informações e dados de até 10 indicadores padrão, que são: Índice de movimento direcional médio (ADX) Índice de canal de commodities (CCI) Velas clássicas de
Trend Line Map Pro MT5
STE S.S.COMPANY
4.09 (11)
O indicador Trend Line Map é um complemento do Trend Screener Indicator. Ele funciona como um scanner para todos os sinais gerados pelo Trend screener (Trend Line Signals). É um Trend Line Scanner baseado no Trend Screener Indicator. Se você não tiver o Trend Screener Pro Indicator, o Trend Line Map Pro não funcionará. It's a Trend Line Scanner based on Trend Screener Indicator. If you don't have Trend Screener Pro Indicator,     the Trend Line Map Pro will not work . Acessando nosso Blog MQ
Quantum TrendPulse
Bogdan Ion Puscasu
5 (13)
Apresentando   Quantum TrendPulse   , a ferramenta de negociação definitiva que combina o poder do   SuperTrend   ,   RSI   e   Stochastic   em um indicador abrangente para maximizar seu potencial de negociação. Projetado para traders que buscam precisão e eficiência, este indicador ajuda você a identificar tendências de mercado, mudanças de momentum e pontos de entrada e saída ideais com confiança. Principais características: Integração SuperTrend:   siga facilmente a tendência predominante do
FX Dynamic: Acompanhe a Volatilidade e as Tendências com Análise ATR Personalizável Visão Geral FX Dynamic é uma ferramenta poderosa que utiliza cálculos de Average True Range (ATR) para fornecer aos traders insights incomparáveis sobre a volatilidade diária e intradiária. Ao configurar limites de volatilidade claros —por exemplo, 80%, 100% e 130%—, você pode identificar rapidamente oportunidades de lucro ou receber alertas quando o mercado ultrapassar faixas normais. FX Dynamic se adapta ao f
CBT Quantum Maverick Sistema de Negociação de Opções Binárias de Alta Eficiência O CBT Quantum Maverick é um sistema de opções binárias de alto desempenho, projetado para traders que buscam precisão, simplicidade e um enfoque disciplinado. Não exige personalização: o sistema está otimizado para resultados eficazes desde o início. Basta seguir os sinais, que podem ser dominados com um pouco de prática. Principais características: Precisão nos sinais: Sinais baseados na próxima vela, utilizando
- Lifetime update free Contact me for instruction, any questions! Related Product:  Gold Trade Expert MT5 - Non-repaint - I just sell my products in Elif Kaya Profile, any other websites are stolen old versions, So no any new updates or support. Introduction The breakout and retest strategy is traded support and resistance levels. it involves price breaking through a previous level.  The break and retest strategy is designed to help traders do two main things, the first is to avoid false breako
Antes de tudo, vale ressaltar que esta Ferramenta de Negociação é um Indicador Não Repintante, Não Redesenhante e Não Atrasado, o que a torna ideal para negociação profissional. Curso online, manual do utilizador e demonstração. O Indicador de Conceitos de Ação de Preço Inteligente é uma ferramenta muito poderosa tanto para traders novos quanto experientes. Ele combina mais de 20 indicadores úteis em um único, combinando ideias avançadas de negociação como Análise do Trader do Círculo Interno
Trend Hunter MT5
Andrey Tatarinov
5 (2)
Trend Hunter é um indicador de tendência para trabalhar nos mercados Forex, criptomoeda e CFD. Uma característica especial do indicador é que ele segue a tendência com confiança, sem alterar o sinal quando o preço ultrapassa ligeiramente a linha de tendência. O indicador não é redesenhado; um sinal para entrar no mercado aparece após o fechamento da barra. Ao avançar ao longo de uma tendência, o indicador mostra pontos de entrada adicionais na direção da tendência. Com base nesses sinais, você
Primeiramente, vale ressaltar que este Sistema de Trading é um Indicador Não Repintado, Não Redesenho e Não Atrasado, o que o torna ideal tanto para o trading manual quanto para o automatizado. Curso online, manual e download de predefinições. O "Sistema de Trading Inteligente MT5" é uma solução completa de trading projetada para traders novos e experientes. Ele combina mais de 10 indicadores premium e apresenta mais de 7 estratégias de trading robustas, tornando-o uma escolha versátil para dive
Royal Scalping Indicator M5
Vahidreza Heidar Gholami
5 (6)
Royal Scalping Indicator is an advanced price adaptive indicator designed to generate high-quality trading signals. Built-in multi-timeframe and multi-currency capabilities make it even more powerful to have configurations based on different symbols and timeframes. This indicator is perfect for scalp trades as well as swing trades. Royal Scalping is not just an indicator, but a trading strategy itself. Features Price Adaptive Trend Detector Algorithm Multi-Timeframe and Multi-Currency Trend Low
Gold Trend 5
Sergei Linskii
3.5 (2)
Tendência do ouro - este é um bom indicador técnico de acções. O algoritmo do indicador analisa o movimento do preço de um ativo e reflecte a volatilidade e as potenciais zonas de entrada. Os melhores sinais do indicador: - Para VENDER = histograma vermelho + ponteiro SHORT vermelho + seta de sinal amarelo na mesma direção. - Para COMPRAR = histograma azul + ponteiro LONGO azul + seta de sinal aqua na mesma direção. Vantagens do indicador: 1. O indicador produz sinais com elevada precisão
Auto Order Block with break of structure based on ICT and Smart Money Concepts (SMC) Futures Break of Structure ( BoS )             Order block ( OB )            Higher time frame Order block / Point of Interest ( POI )    shown on current chart           Fair value Gap ( FVG ) / Imbalance   -  MTF      ( Multi Time Frame )    HH/LL/HL/LH  -  MTF      ( Multi Time Frame )  Choch  MTF      ( Multi Time Frame )  Volume Imbalance     ,  MTF          vIMB Gap’s Power of 3 Equal High / Low’s  
Volumatic VIDyA MT5
Duc Hoan Nguyen
5 (2)
Special offer : ALL TOOLS , just $35 each! New tools   will be   $30   for the   first week   or the   first 3 purchases !  Trading Tools Channel on MQL5 : Join my MQL5 channel to update the latest news from me Volumatic VIDYA (Variable Index Dynamic Average) é um indicador avançado projetado para rastrear tendências e analisar a pressão de compra e venda em cada fase de uma tendência. Utilizando o Promédio Dinâmico de Índice Variável (Variable Index Dynamic Average) como técnica central de sua
Atomic Analyst MT5
Issam Kassas
4.32 (19)
Primeiramente, vale ressaltar que este Indicador de Negociação não repinta, não redesenha e não apresenta atrasos, tornando-o ideal tanto para negociação manual quanto automatizada. Manual do utilizador: configurações, entradas e estratégia. O Analista Atômico é um Indicador de Ação de Preço PA que utiliza a força e o momentum do preço para encontrar uma vantagem melhor no mercado. Equipado com filtros avançados que ajudam a remover ruídos e sinais falsos, e aumentam o potencial de negociação.
ATrend
Zaha Feiz
4.77 (13)
ATREND: Como Funciona e Como Usá-lo #### Como Funciona O indicador "ATREND" para a plataforma MT5 é projetado para fornecer aos traders sinais robustos de compra e venda, utilizando uma combinação de metodologias de análise técnica. Este indicador aproveita principalmente o Intervalo Verdadeiro Médio (ATR) para medir a volatilidade, juntamente com algoritmos de detecção de tendências para identificar possíveis movimentos de mercado. Deixe uma mensagem após a compra e receba um brinde especial.
Timeframes Trend Scanner   is a trend analyzer or trend screener indicator that helps you know the trend in   all timeframes of selected symbol you are watching . This indicator provides clear & detailed analysis results on a beautiful dashboard, let you able to use this result right away without need to do any additional analysis. How it works Step 1: Calculate values of 23 selected & trusted technical indicators (Oscillator & Moving Average indicators) Step 2: Analyze all indicators using bes
Mais do autor
AUTOMATIC TRADE COPIER for local *   use . (copy trades between several metatrader terminals on the local computer/ *or GLOBALLY after setting your network /server !) Can copy trades from one or   several main MT5 accounts   to several MT5 and MT4 accounts   (no limit). For MT5 to MT4 copy you have to also get version for Metatrader 4 here : https://www.mql5.com/en/market/product/80842 - very fast execution (theoretically up to 5ms delay, depends on computer speed) - user can set speed of copy
AUTOMATIC TRADE COPIER for local * use . (copy trades between several metatrader terminals on the local computer/ *or GLOBALLY after setting your network /server !) Can copy trades from one or several main MT4 accounts to several MT4 and MT5 accounts (no limit). For MT4 to MT5 copy you have to also get version for Metatrader 5 here:  https://www.mql5.com/en/market/product/80843 - very fast execution (theoretically up to 5ms delay, depends on computer speed) - user can set speed of copying (re
this is DEMO VERISON (for demo acc.) of  TRADING OVERLAY with PARTIAL take profit    ("virtual TP")   and % risk lot size   --- full version available   on my 'seller page' as well as version for MT4 Take better control of your trades with ease ! Easy lot size calculation with easy SL/TP setting. Your trading will be much more comfortable with this tool!   Main goal with this tool is very SIMPLE and FAST operation!    Works like any EA, add it to selected chart and trade ! Features: start tra
FREE
Trend Meter MT5
Filip Valkovic
5 (1)
Very powerful indicator! converted from TradingView with upgraded alerts and added notifications.  Ideal use in EAs. Use as a supplementary Indicator to confirm your entries, but it is as good on it's own. The indicator consists of 3 different Trend Meters and a  2 Trend Bars which are used to confirm trend How to Use: The more Trend meters are lit up the better =>>   -more GREEN COLOR at one bar means more confirmation to open buy  trade, - more RED COLOR signals for one bar = more confirmat
This Fibonacci Indicator is showing fibo retracement lines on chart for EA trading same as the default tool from Metatrader's menu, except this one is fully automatic and changes along with the chart (with modes B and C, then mode A is always fixed by set levels) AND it also offers the line levels for the Expert Advisors to read (buffers) , so you can set your trades based on crossover\crossunder on those fibo lines. You can choose from 3 modes for selecting the max HIGH and min LOW limit, and
FREE
EXPER ADIVSOR that gets economic news calendar from forexfacotry.com and calculates time until next news happen or since last news happened. It shows exactly same output as ffcal for MT4 by Derk Wehler, original version may be available at forexfacotry This version is clean, done  WITHOUT ANY DLL IMPORTS !!!  Additionally it creates excel file  with latest news  in your datafolder-> ".../MQL5/Files" , (* so this data can be used if  you want to use news in EA , just load data from this file, I
TRADING PANEL - CHART OVERLAY with:   PARTIAL TAKE PROFIT  ("virtual TP")   % RISK LOT SIZE  TRAILING STOP LOSS  Fast and simple control of your trades this is DEM0 VERISON (for DEM0 acc.)   of    TRADING OVERLAY with PARTIAL take profit    ("virtual TP")   and % risk lot size   --- full version available   on my 'seller page' as well as version for MT5 Easy lot size calculation with easy SL/TP setting. Your trading will be much more comfortable with this tool ! Works like any EA, add it
FREE
CUSTOM Currency strength indicator -CHOOSE ANY CURENCIES that you want to calculate strength for, indicator will automatically compare all symbols /pairs from 8 selected currencies based on KU-chart calculations. -8 major currencies are used by default -add indicator to any chart -made for 15min timeframe= last 1 day change calculated, 30min = last 2 days and so on -clear currency distinguish  by color and name on chart  -if you chose non-standard currency, make sure all of inputted values hav
FREE
Simple Stats is utility for history management. Allowing you to clearly see trading performance for each symbol separately , and so it helps you to find the most and the worst profitable type of trades based on past results. History period depends on settings of your terminal, so if you want to get report for each month, you have to use custom period and run SIMPLE STATS for each. SS will  distinguish reports with filename - each history report is named with account number and date of the oldest
FREE
Tool converted from tradingview. A simple indicator that plots difference between 2 moving averages and depicts convergance/divergance in color coded format. Anything <= 0 is   red   and shows a   bearish   trend whereas > 0 is   green   and shows   bullish   trend. Adjust the input parameters as following for your preferred time frame : 4-Hr: Exponential, 15, 30 Daily: Exponential, 10, 20 Weekly: Exponential, 5, 10
FREE
Virtual Assistant MINI   VIRTUALL ASSISTANT = MAKE YOUR TP AND SL VIRTUAL!   Tool meant to control your stop loss and take profit by converting them to virtual SL/TP (with support for TRAILING) Convert all SL and TP to virtual so your exits on trades are hidden from your broker! Run this EA on any graph, choose 1MIN timeframe (VA is autosaving data only on new bar detected, so graph TF equals to VA autosave period) !!! When using virtual trade exits, stable connection is needed for order executi
FREE
AGS Scalping 2
Filip Valkovic
AGS Scalper 2  is a powerful and versatile trading robot with very customizable risk/profit Trading strategy : identification of overbought and oversold conditions of the market, and checking for trend reverse Just look at the first screenshot .  I’ve made 264% profit per month!  First month u sing this EA, I achieved  win   ratio 100% with maximal DD 18%.  It was just from one pair, this EA can run on more pairs, maximizing profit and minimalizing risk .   It was just the first version of AGS,
VIRTUALL ASSISTANT = MAKE YOUR TP AND SL VIRTUAL!   Tool meant to control your stop loss and take profit. Main idea of this program is to convert all SL and TP to virtual so your exits on trades are hidden from your broker. Run this EA on any graph, choose 1MIN timeframe (VA is autosaving data only on new bar detected, so graph TF equals to VA autosave period) !!! When using virtual trade exits, stable connection is needed for order execution! Best works with VPS! Developed with ECN accounts. 
HEIKEN PLUS is the only indicator you really need to be a successful trader , without in depth knowledge of the forex trading or any tools.  Also there is automatically trading  MT5  EA available   now:   https://www.mql5.com/en/market/product/89517?   with superb SL/TP management!  and sky high profit targets !    MT5 ONLY ! For Metatrader5 version visit:  https://www.mql5.com/en/market/product/83761?source=Site Very suitable tool for new traders or advanced traders too. HEIKEN+ is a combin
RISK CALCULATOR - TRADING PANEL - CHART OVERLAY with:   PARTIAL TAKE PROFIT  ("virtual TP")   % RISK LOT SIZE  TRAILING STOP LOSS  Fast and simple control of your trades Easy lot size calculation with easy SL/TP setting. Your trading will be much more comfortable with this tool!   Works like any EA, add it to selected chart and trade ! Features: start trade with   calculated lot   based on   % of account balance * that you want to risk/ or based on   how much money you want to risk  *r
Chart Notes = MULTI LINE TEXT INPUT ON CHART FOR MT4   is finally here! # sticky notes This indicator is a powerful text editor for placing notes on chart, similarly like the feature on Tradingview.  There are 2 types of messages: anchored (on screen ) and free (on chart).  1. Anchored = stays on the same place on screen (x point, y point) -this text can be   EDITED on click   (first line is for dragging the message around- this line is edited via right clicking- >properties) -move the message
Smart Manager Dashboard - with auto virtual TP and auto virtual SL for all trades. -this EA is a powerful trade manager that can manage all symbols and all trades at once , all from one chart so it is a must have tool for every trader who keeps more trades at once. -it mainly does 2 things : INFO ABOUT TRADES and CLOSING TRADES   (grouped by their symbol, so with this tool it is very easy and fast to manage even hundreds of trades ) -add to any chart, any timeframe and you are all set -this to
Classic Fractals indicator for MT4, with additional Trendlines connecting the latest couples of fractals ( fractals are showing highest high, and lowest low on each period) Rules for trendlines: -if new top fractal is below the last one = new resistance line -if new bot fractal is above the last one = new support line -Trendlines can be hidden -Fractals can be hidden Fractal Period = can be both even or uneven number, as it is setting for half (one side) of the bars sequence for findin
finally coming to MT5 too: AGS Scalper 2  is a powerful and versatile trading robot with very customizable risk/gain ratio Trading strategy :   identification of overbought and oversold conditions of the market, and checking for trend reverse Just look at the first screenshot .  I’ve made 264% profit per month!  First month u sing this EA, I achieved  win   ratio 100% with maximal DD 18%.  It was just from one pair, this EA can run on more pairs, maximizing profit and minimalizing risk .   It w
Tool converted from tradingview indicator. Modified version with pivot points calculated in a more intuitive way. This tool displays relative   volatility   and directional trend. Excellent way to pickup diversions and reversals. Length can be lowered to 11 or 13 in settings to show price range. Can be used to identify patterns such as parallel channels and likely direction of price action.
HEIKEN PLUS is the only indicator you really need to be a successful trader , without in depth knowledge of the forex trading or any tools. Also there is automatically trading EA available now: https://www.mql5.com/en/market/product/89517? with superb SL/TP management! and sky high profit targets !!! Very suitable tool for new traders or advanced traders too. This is MT5 version. For MT4 version visit :  https://www.mql5.com/en/market/product/85235?source=Site HEIKEN+ is a combination of 2 i
RISK TO REWARD TOOL for MT5 with UI on chart: (creates similar RR boxes like on tradingview)  -creates and deletes draggable boxes on chart, ANY SYMBOL, ANY TF. Menu buttons: NEW BUY,       NEW SELL,     DELETE ALL,   ( and minimize) -draggable target TP level -draggable SL limit level -text labels with pips SL TP, RR ratio-there is  no limit of boxes -but program remembers first 100 boxes after changing input. there is parameter "delete_on_init" so false = every created box stays as it is, true
I automated trading strategy based on my HEIKEN+ Indicator which is included in this EA, and it worked out very well !   "HEIKEN PLUS is the only indicator you really need to be a successful trader , without in depth knowledge of the forex trading or any tools." Very suitable tool for new traders or advanced traders too. Check my seller page to see info about the indicator.  HEIKEN+ is a combination of 2 indicators : normal Heiken Ashi and Heiken Ashi smoothed. It sends signal when these two
RISK CALCULATOR - TRADING PANEL - CHART OVERLAY with:   PARTIAL TAKE PROFIT  ("virtual TP")   % RISK LOT SIZE  TRAILING STOP LOSS  Fast and simple control of your trades Easy lot size calculation with easy SL/TP setting. Your trading will be much more comfortable with this tool!   Works like any EA, add it to selected chart and trade ! (this version is converted from MT4) Features: start trade with   calculated lot   based on   % of account balance * that you want to risk/ or based on
Chart Notes = MULTI LINE TEXT INPUT ON CHART FOR MT5 is finally here! # sticky notes This indicator is a powerful text editor for placing notes on chart, similarly like the feature on Tradingview. There are 2 types of messages: anchored (on screen ) and free (on chart).  1. Anchored = stays on the same place on screen (x point, y point) -this text can be EDITED on click (first line is for dragging the message around- this line is edited via right clicking- >properties) -move the messages by dra
Smart Manager Dashboard - with auto virtual TP and auto virtual SL for all trades. [Converted from MT4 version - All screenshots are from MT4] -this EA is a powerful trade manager that can   manage all symbols and all trades at once , all from one chart so it is a   must have tool for every trader   who keeps more trades at once. -it mainly does 2 things :   INFO ABOUT TRADES   and   CLOSING TRADES   (grouped by their symbol, so with this tool it is   very easy and fast to manage even hundreds
Simple Stats is utility for trades history management. (works as Expert Advisor) Allowing you to:   see trading performance for each symbol separately , and so it     helps you to find the most and the worst profitable type of trades  based on past results. filters: see only manual trades see only EA trades see only EA trades from one specific Magic Number select time period for history SS will  distinguish reports with filename - each history report is named with account number an
Filtro:
Sem comentários
Responder ao comentário