• Visão global
  • Comentários
  • Discussão (4)

The 123 Pattern Strategy With Fibonacci MT5

4

Get FREE Advanced Online Course and Learn About Our Advanced Trading System, Link in the Bio! Click Here. 

Our Mission and Vision:  

Why Am I Even Here?

Here is The Deal Brother, We Offer:Premium Quality Indicators: The Highest Quality Possible Algorithms.

  • Unlimited Activations: Can be used on Unlimited number of Computers, MT4s and MT5s for lifetime.

  • Inexpensive Prices: 30$ is the lowest price possible, Knowing that more than 50% of our Indicators are 100% FREE.


But Why Am I telling You this?

I am Telling You this, Because of 3 Reasons:

  • I would like to be honest with you: A rare quality nowadays..

  • I care, and I don't want to break your bank: We know how struggling new and even experienced traders feel. Whether you
    have money or not you will get premium and inexpensive even free indicators for life.

  • I Personally have been there and I wished somebody cared.


How Can We Help You?

Our Mission and our Goal is to turn you into a Pro Trader, In the shortest period of time possible, and we can do that by offering you:

  • Professional Knowledge: Today in our Pro Trading Academy, You can Enroll, Get Certified and Start a successful Career as a Pro Trader.

  • Professional Tools: Premium tools and Indicators that Pro Traders use on a daily basis, with inexpensive prices.


About This Indicator:

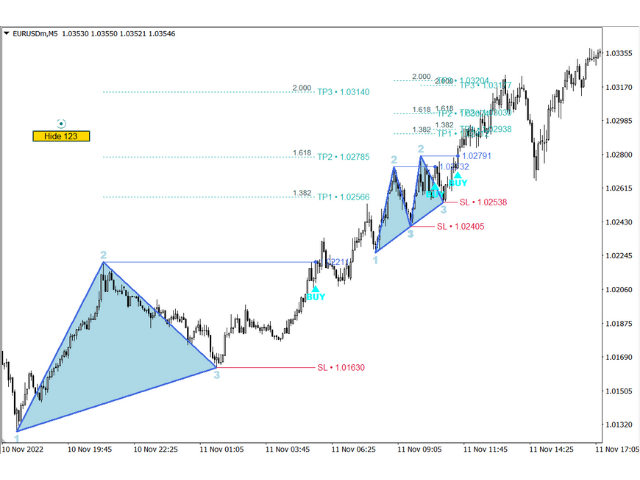
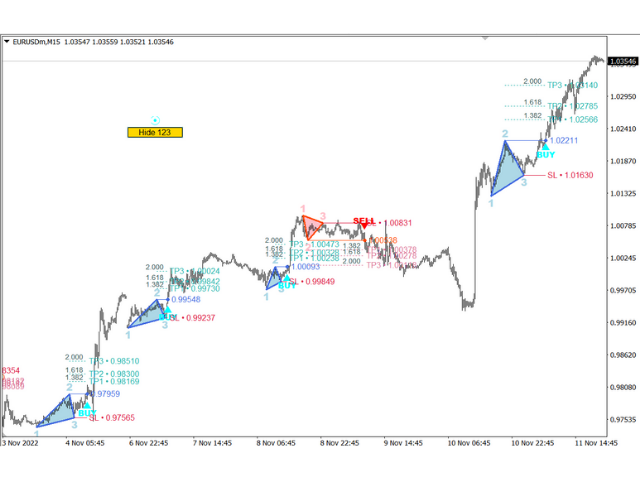
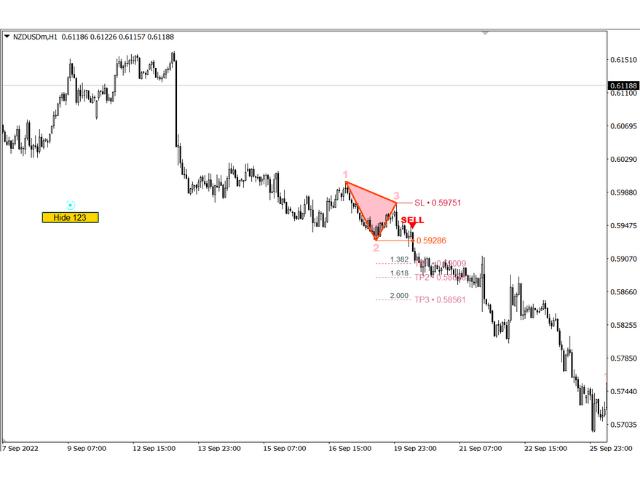
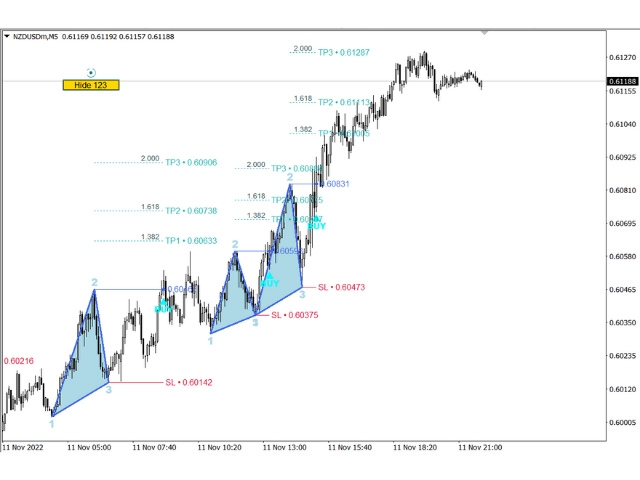
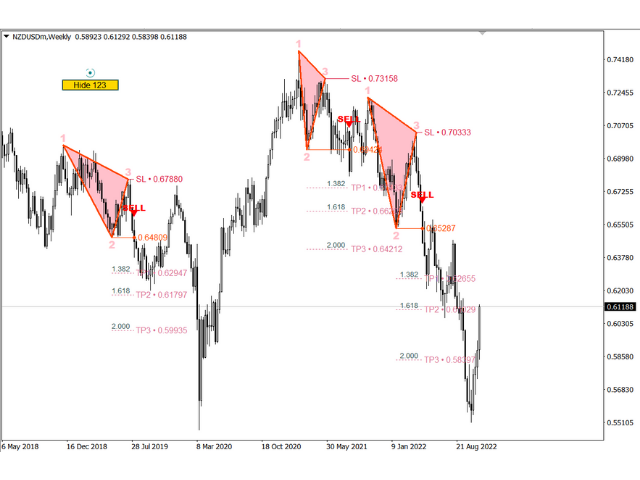
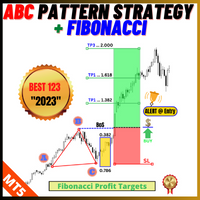
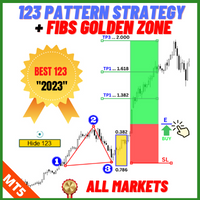
"The 123 or ABC Pattern Strategy With Fibonacci" Indicator is a cutting-edge technical analysis tool meticulously designed to recognize and leverage the power of the 123 or ABC chart patterns in combination with Fibonacci levels. This strategy let traders make well-informed decisions and gain a competitive edge in the dynamic forex market.

Spotting the 123 and ABC Patterns: Learn how to identify the 123 and ABC patterns on price charts. These patterns are composed of three distinct price swings, providing valuable insights into potential trend reversals or continuations.

Harnessing the Potential of Fibonacci: Discover the significance of Fibonacci retracement and extension levels. The indicator seamlessly incorporates these levels, assisting traders in pinpointing enhanced potential entry and exit points.

Entry and Exit Points: Master the art of using the 123 or ABC pattern in conjunction with Fibonacci levels to determine optimal entry and exit positions for your trades.

Confirmation with Multiple Timeframes: Explore the benefits of validating 123 or ABC patterns and Fibonacci levels across multiple timeframes. This comprehensive approach enhances the reliability of your signals.

Risk Management Strategies: Learn how to manage trading risks effectively. Implementing proper risk management techniques is crucial to safeguarding your trading capital.

Integrating Other Technical Indicators: Understand how to combine "The 123 or ABC Pattern Strategy With Fibonacci" Indicator with other technical indicators to create a well-rounded trading strategy.

Backtesting and Optimization: Utilize historical data to backtest the indicator and fine-tune your trading approach for optimal performance.

Real-time Alerts and Notifications: Stay ahead of the game with real-time alerts and notifications. Never miss a potential trading opportunity again.

User-Friendly Interface: The indicator boasts a user-friendly interface, making it suitable for traders of all experience levels.

Compatibility with Leading Trading Platforms: Enjoy the flexibility of using "The 123 or ABC Pattern Strategy With Fibonacci" Indicator on popular trading platforms such as MetaTrader 4 and MetaTrader 5.

Continuous Support and Updates: Benefit from ongoing support and updates to ensure the indicator remains up-to-date and effective.


Remember, while "The 123 or ABC Pattern Strategy With Fibonacci" Indicator provides valuable insights, trading requires a realistic approach. Combine technical analysis, risk management, and market knowledge to make prudent trading decisions. (Disclaimer: Forex trading involves risk, and past performance is not indicative of future results. Always trade responsibly and seek professional advice when needed.)


Frequently Asked Questions:

Q: What is 123 or ABC Pattern Strategy?

A: 123 or ABC pattern Strategy is a Pure Price Action Strategy that does not use any technical indicators, It’s a simple Pattern But Yet very Powerful, Used by a lot of Pro Traders All around the world.

The Concept behind the 123 or ABC pattern falls under two scenarios:

1-      Continuation 123 or ABC Pattern:

-          The Price should be in a Trend "Up or Down".

-          The Price Pulls back.

-          Traders then Look for reasons to enter at the Pull back to catch the trend.

2-      Reversal 123 or ABC Pattern:

-          The Price should be Oversold Or Overbought.

-          The Price Fails To create New High Or New Low.

-          At the Level of Failure the Traders look for reasons to enter.

The power of the 123 or ABC Pattern strategy is that its very Simple and easy to understand, evolves only Price action, No technical Indicators.


Q: What's Fibonacci Golden Zone?

A: It’s a well-known Strategy among Professional Price action traders, the Concept of this strategy is the following:

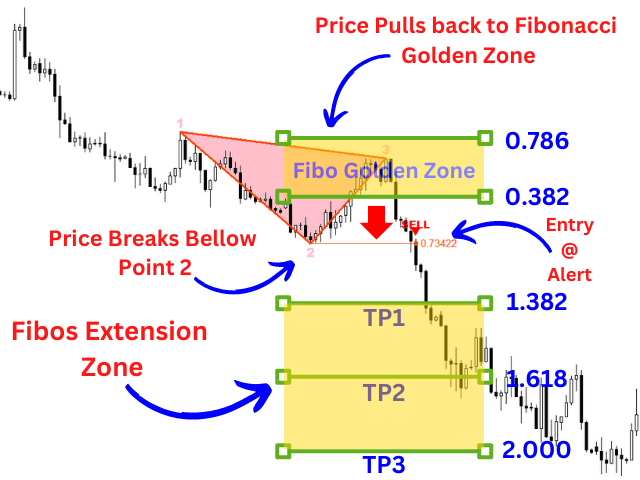
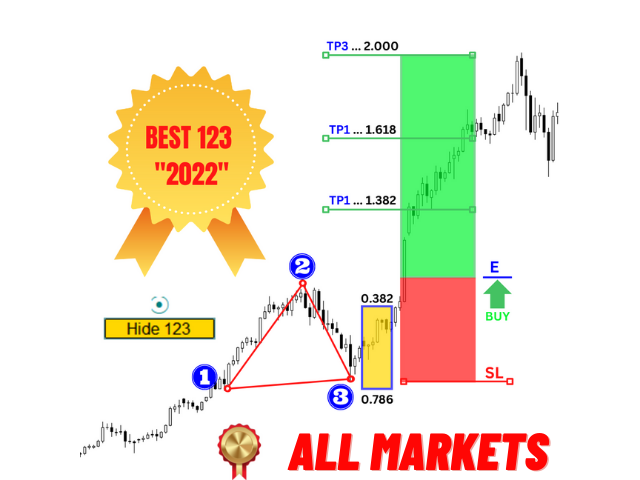
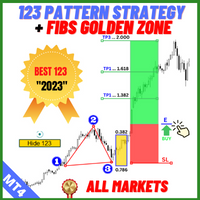
The trader will draw Fibonacci levels and mark the levels between 0.382 and 0.786 as the Golden Zone.

Any Pullback to this Zone is Considered very important, because the Golden Zone is considered as a Zone (Area) of value where the price has higher chances to Reverse.


Q: How much does it cost:

A: Current Price $30 Minimum, But Possible Future Price $199!


Q: Do you Sell outside of the Mql5 community?

A: Absolutely not, Its is against the rules of mql5 community and anybody who sells using our brand name is a scam and should be avoid at any cost.


Q: Can I use it on all timeframes and all markets?

A: YES, It Can be used on All Markets and All Timeframes.


Q: Can I use this custom indicator on multiple charts?

A: Yes, you can use the custom indicator on multiple charts. Simply add it to each chart from the Navigator window.


Q: Can I use this custom indicator on multiple trading accounts?

A: Yes, You can use it on unlimited trading accounts (with our unlimited activations).


Q: How do I install this custom indicator I purchased?

A: To install the custom indicator you purchased, follow these steps:

  1. If you still didn't buy the indicator by clicking the buy button above.
  2. Refresh the page and you will see Install button.
  3. Click install the web page will ask your to open MetaTrader, Click Confirm. 
  4. Open MetaTrader and go to "Navigator" -> "Indicators" -> "Market", you will see your newly bought indicator listed.
  5. double click or click and drag to the chart.
  6. setting window will open, custom your preferred setting and confirm. 


Q: Do you have the other version of MetaTrader?

A: Yes, you can find the other version Here


Q: How to trade using this indicator?

A: Follow below steps:

1-     Install the Indicator in your chart.

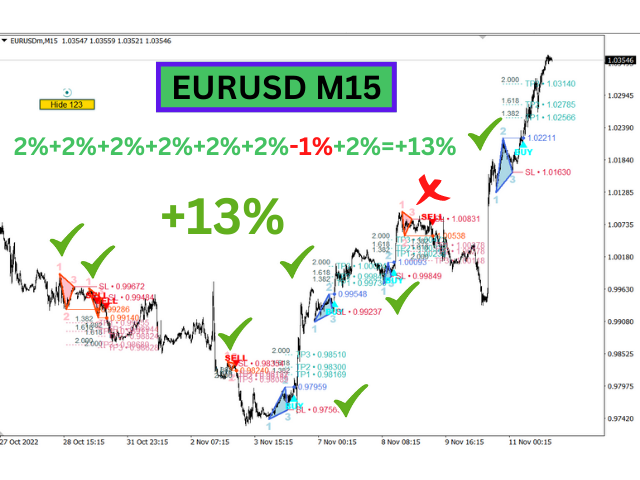
2-     The Indicator will Alert you to Meta Trader and your phone when new 123 or ABC patterns are detected and show you exactly where to Enter and where to put the Stop Loss and the Take Profits.

3-     All you have to do is Take the Trades whenever you get Alerted.

The most important thing when it comes to trading is the Analysis of the chart, Imagine you can skip that part and let the Algorithm take care of that for you!

This Algorithm has embedded instruction to find the 123 or ABC patterns and refine them using the Fibonacci levels, to get the best results out of your trading.

So why not Add this strategy to your trading Arsenal!

Removing the human error by using a complex algorithm formula will help not only save the traders time but increase accuracy of entries and  exists signals.

More tips:

1. Use On 15 Minutes Timeframe.

2. Use Active Trading Technics Like Moving SL to BE when Profit Reaches TP2.

3. This is a manual Trading strategy so you still need to filter the good signals from the bad.

4. Sometime the signal comes late I call it late Signal and I just Skip It! (After all we have to respect the original Strategy, signal at the close of the Candle).


Q: What's the formula used?

A: The indicator has a Smart algorithm that scans and retrieve valid and important info.


Q: Does if show SL and TP? and What is the red and green boxes?

A: No, The green and red boxes are used for demonstration only.


Q: Can this Indicator Alert me on Email and Phone when price near a level ?

A: Yes, you will be able to enable alerts in the setting panel.


Q: How to integrate this Indicator in my trading?

A: There are a lot of strategies that uses this Indicator including most of price action traders and day traders use it, Removing the human error by using a complex algorithm formula will help not only save the traders time but increase probabilities of your entries and  exists signals.


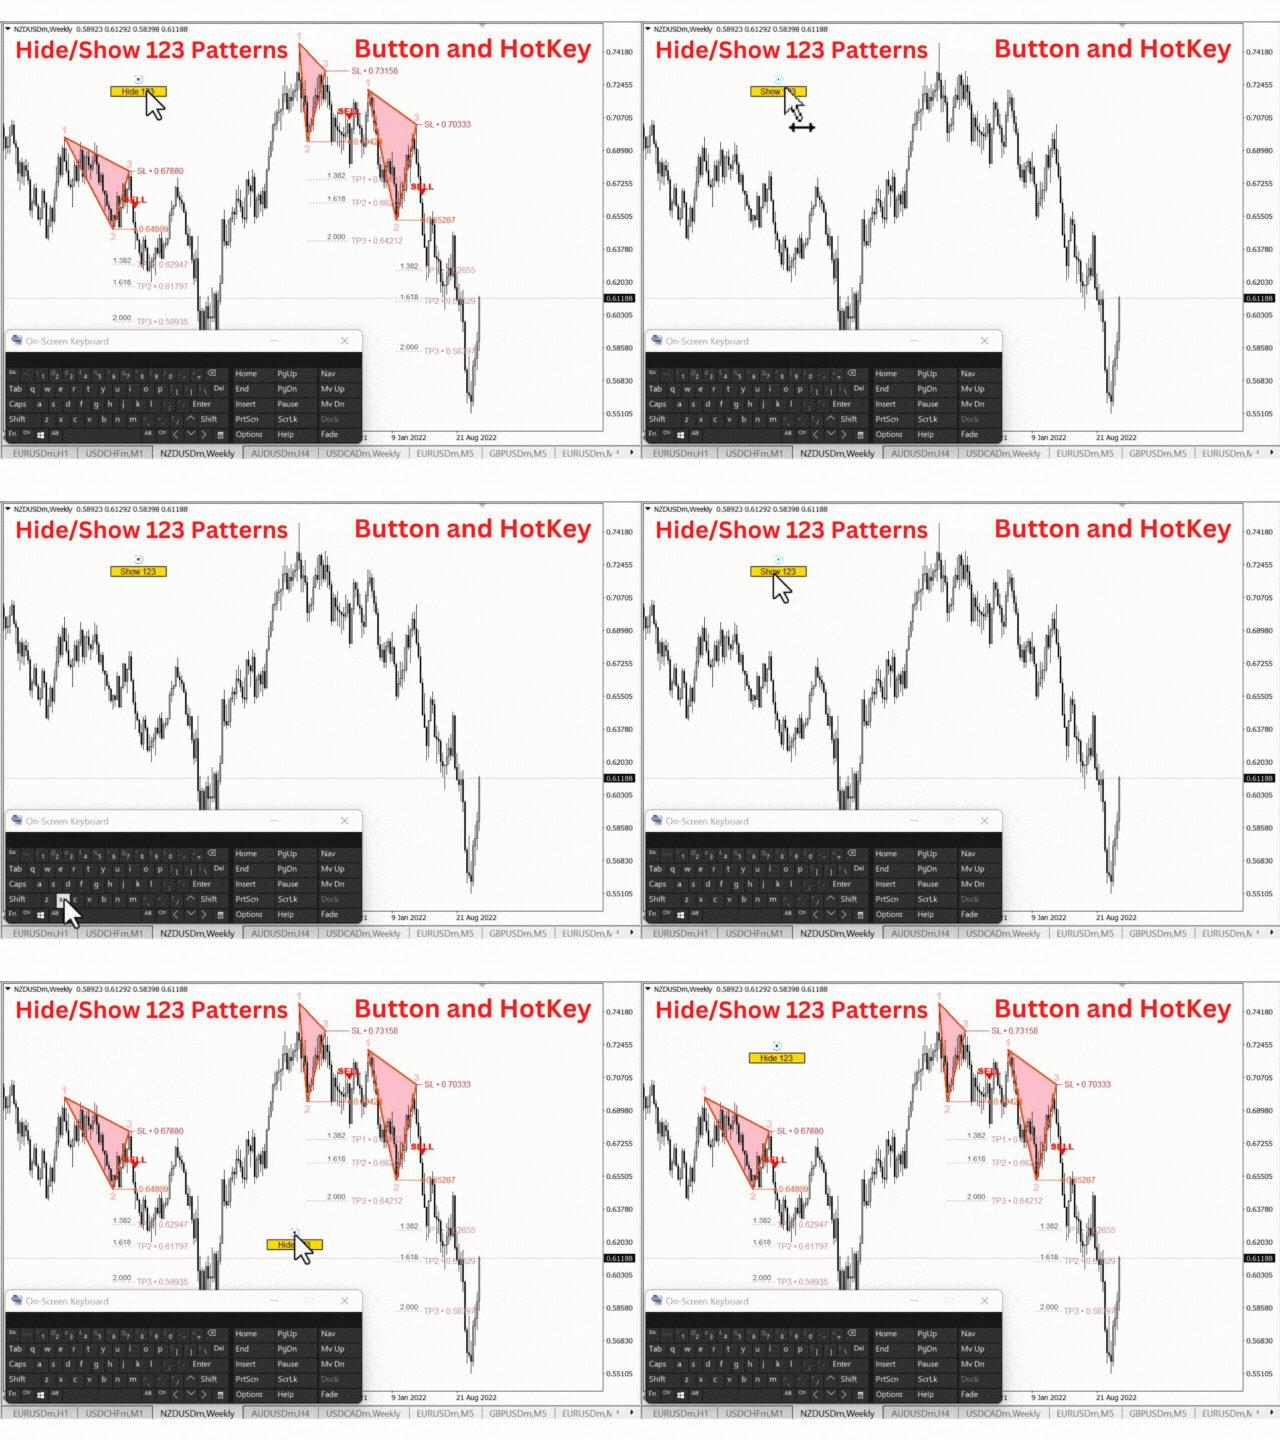
Q: Does it have the Hide and Show Button/Hot key?

A: Yes, Hide button is new technic that allow for cleaner chart setup.


Q: Can this indicator be used with an Expert Adviser?

A: Yes, This indicator does return buffers that can be used as buy and sell signals buy Expert Advisers.


    Q: How do I customize the settings of the custom indicator?

    A: To customize the settings of the custom indicator, double-click on it in the Navigator window or drag it onto the chart. A settings window will appear, allowing you to adjust the parameters as per your preference.


    Q: Does the custom indicator repaint or redraw its signals?

    A: The repainting behavior of custom indicators depends on their specific logic and design. Please refer to the indicator's documentation or ask the seller for clarification.


    Q: Can I get support or assistance with using the custom indicator?

    A: Yes, if you have any questions or need assistance with using the custom indicator, you can contact the seller or developer through the MQL5 website or the provided contact information.


    Q: How can I backtest the custom indicator's performance?

    A: To backtest the custom indicator, open the Strategy Tester in MetaTrader 5, select the indicator, choose the desired settings, and run the test on historical data.


    Q: What are the settings of this indicator?

    A: This indicator offers full control over everything:

    1. Control the Modes.
    2. Control the appearance of the indicator.
    3. Control number of bars to analyze.
    4. Control Alerts.
    5. Control thickness of elements.
    6. Control the colors of elements.
    7. Show hide of all elements using button or Hotkey.
    8. Change position of the button.


    Reviews:

    Your Feedback Matters!

    We hope you're enjoying our products! 

    We invite you to share your valuable reviews and feedback on our products. Your input is incredibly valuable in helping us enhance our offerings and cater to your needs even better. 

    By leaving a review, you not only support our work but also contribute to making our products even more effective for you! 

    Your satisfaction is our top priority, and your feedback will directly impact the future improvements we make. So, take a moment to share your thoughts and help us serve you better! 

    Thank you for being a part of our journey!

    Dubai Forex Group
    Produtos recomendados
    Noize Absorption Index - is the manual trading system that measures the difference of pressure between bears forces and bulls forces. Green line - is a noize free index that showing curent situation. Zero value of index shows totally choppy/flat market.Values above zero level shows how powerfull bullish wave is and values below zero measures bearish forces.Up arrow appears on bearish market when it's ready to reverse, dn arrow appears on weak bullish market, as a result of reverse expectation.
    Stratos Pali mt5
    Michela Russo
    5 (4)
    Stratos Pali Indicator is a revolutionary tool designed to enhance your trading strategy by accurately identifying market trends. This sophisticated indicator uses a unique algorithm to generate a complete histogram, which records when the trend is Long or Short. When a trend reversal occurs, an arrow appears, indicating the new direction of the trend. Important Information Revealed Leave a review and contact me via mql5 message to receive My Top 5 set files for Stratos Pali at no cost ! Down
    Owl Smart Levels MT5
    Sergey Ermolov
    4.07 (28)
    Versão MT4  |  FAQ O Indicador Owl Smart Levels é um sistema de negociação completo dentro de um indicador que inclui ferramentas populares de análise de mercado, como fractais avançados de Bill Williams , Valable ZigZag que constrói a estrutura de onda correta do mercado e níveis de Fibonacci que marcam os níveis exatos de entrada no mercado e lugares para obter lucros. Descrição detalhada da estratégia Instruções para trabalhar com o indicador Consultor de negociação Owl Helper Chat privado d
    O nível Premium é um indicador único com mais de 80% de precisão nas previsões corretas! Este indicador foi testado pelos melhores Especialistas em Negociação por mais de dois meses! O indicador do autor você não encontrará em nenhum outro lugar! A partir das imagens você pode ver por si mesmo a precisão desta ferramenta! 1 é ótimo para negociar opções binárias com um tempo de expiração de 1 vela. 2 funciona em todos os pares de moedas, ações, commodities, criptomoedas Instruções: Assim
    Golden Spike Premium
    Kwaku Bondzie Ghartey
    Golden Spikes Detector Acknowledgement and Dedications:  The name of this indicator was Inspired by an Original; Mr Grant Koopman; a Knowledgeable and experienced Synthetics trader. I dedicate this indicator to Mr Grant.  Overview:   The Golden Spikes Premium is a groundbreaking trading indicator meticulously crafted for the Boom and Crash indices on the Deriv market. Tailored to meet the needs of discerning traders, this powerful tool operates exclusively on the one-minute timeframe, providing
    US30NinjaMT5
    Satyaseelan Shankarananda Moodley
    US30 Ninja is a 5 minute scalping indicator that will let know you when there is a trade set up (buy or sell). Once the indicator gives the trade direction, you can open a trade and use a 30 pip stop loss and a 30 pip to 50 pip take profit. Please trade at own own risk. This indicator has been created solely for the US30 market and may not yield positive results on any other pair. 
    Crash 1000 Scalping Indicator for the Crash 1000 Deriv Synthetic Index. Introduction The Crash 1000 Scalping Indicator is a specialized tool designed for the Crash 1000 index on the Deriv Synthetic market. This indicator is particularly useful for scalping on the M1 timeframe, helping traders to identify precise entry and exit points for buy positions. It is designed to be non-repainting, providing clear signals with audible alerts and push notifications, and is compatible with mobile devices th
    Binary Options Assistant (BOA) Multi Currency Dashboard for Binary Options (MT5) . You can use any of the BOA Signals Indicators with the dashboard. Just change the BOA Signals Indicator Name in the dashboard settings to the indicator you want to get signals from. For example: CHILL. BLAZE:  BOA_BLAZE_Indicator_v1   Strategy :   BLW Online Trading Binary Options Strategy (3 Moving Average) LAVA:  BOA_LAVA_Indicator_v1   Strategy:   Lady Trader Binary Options Strategy (Bollinger Bands & Stochas
    O indicador cria cotações atuais, que podem ser comparadas com as históricas e, com base nisso, fazer uma previsão do movimento dos preços. O indicador possui um campo de texto para navegação rápida até a data desejada. Opções: Símbolo - seleção do símbolo que o indicador exibirá; SymbolPeriod - seleção do período do qual o indicador coletará dados; IndicatorColor - cor do indicador; HorisontalShift - deslocamento das cotações desenhadas pelo indicador pelo número especificado de barras; I
    PipFinite Exit EDGE MT5
    Karlo Wilson Vendiola
    4.86 (29)
    Did You Have A Profitable Trade But Suddenly Reversed? In a solid strategy, exiting a trade is equally important as entering. Exit EDGE helps maximize your current trade profit and avoid turning winning trades to losers. Never Miss An Exit Signal Again Monitor all pairs and timeframes in just 1 chart www.mql5.com/en/blogs/post/726558 How To Trade You can close your open trades as soon as you receive a signal Close your Buy orders if you receive an Exit Buy Signal. Close your Sell orders if
    Fibo Channels
    Jeffrey Quiatchon
    Fibo Daily Channel Indicator The  Indicator is a powerful tool for traders, providing precise daily support and resistance levels based on Fibonacci retracement and extension calculations. This indicator automatically draws key pivot points (PP, R1, R2, S1, S2) as well as additional extension levels (R3, R4, S3, S4), helping traders identify potential reversal and breakout zones with ease. It includes customizable alerts and push notifications, allowing traders to receive updates whenever the pr
    HMA Trend Professional MT5
    Pavel Zamoshnikov
    4.25 (4)
    Improved version of the free HMA Trend indicator (for MetaTrader 4) with statistical analysis. HMA Trend is a trend indicator based on the Hull Moving Average (HMA) with two periods. HMA with a slow period identifies the trend, while HMA with a fast period determines the short-term movements and signals in the trend direction. The main differences from the free version: Ability to predict the probability of a trend reversal using analysis of history data. Plotting statistical charts for analyzi
    Indicator and Expert Adviser  EA Available in the comments section of this product. Download with Indicator must have indicator installed for EA to work. Mt5 indicator alerts for bollinger band and envelope extremes occurring at the same time. Buy signal alerts occur when A bullish candle has formed below both the lower bollinger band and the lower envelope  Bar must open and close below both these indicators. Sell signal occur when A bear bar is formed above the upper bollinger band and upper
    Flow Bookmap
    Thalles Nascimento De Carvalho
    Flow Bookmap: Visualize o Fluxo de Mercado e Proteja Seu Operacional ️ QUER DOMINAR O MERCADO COM INFORMAÇÕES PRECISAS SOBRE COMPRADORES E VENDEDORES? O Flow Bookmap é a ferramenta definitiva para traders que buscam entender o comportamento do mercado em profundidade. Ele transforma os dados do fluxo de ordens em uma interface intuitiva no gráfico do MT5, destacando regiões de interesse crítico para decisões rápidas e seguras. Como Funciona? O Flow Bookmap interpreta a interação entre
    Laguerre SuperTrend Clouds   adds an Adaptive Laguerre averaging algorithm and alerts to the widely popular SuperTrend indicator. As the name suggests,   Laguerre SuperTrend Clouds (LSC)   is a trending indicator which works best in trendy (not choppy) markets. The SuperTrend is an extremely popular indicator for intraday and daily trading, and can be used on any timeframe. Incorporating Laguerre's equation to this can facilitate more robust trend detection and smoother filters. The LSC uses the
    Was: $249  Now: $149   Market Profile defines a number of day types that can help the trader to determine market behaviour. A key feature is the Value Area, representing the range of price action where 70% of trading took place. Understanding the Value Area can give traders valuable insight into market direction and establish the higher odds trade. It is an excellent addition to any system you may be using. Inspired by Jim Dalton’s book “Mind Over Markets”, this indicator is designed to suit the
    Volality Index Scalper
    Lesedi Oliver Seilane
    5 (1)
    Volality Index scalper indicator  Meant for Volality pairs such as Volality 10, 25, 50, 75 and 100 The indicator works on all timeframes from the 1 minute to the monthly timeframe the indicator is non repaint the indicator has 3 entry settings 1 color change on zero cross 2 color change on slope change 3 color change on signal line cross Orange line is your sell signal Blue line is your buy signal.
    Rainbow EA MT5
    Jamal El Alama
    Description : Rainbow EA MT5 is a simple Expert advisor based on   Rainbow MT5 indicator witch is based on Moving average with period 34. The indicator is incorporated in the EA, therefore, it is not required for the EA to operate, but if you wish, you can download it from   my product page . The Expert Advisor settings are as follows : Suitable for Timeframes up to H1 The parameters below can be set according to your trading rules. StopLoss ( Stop Loss in pips) TakeProfit ( Take Profit in pips
    To get access to MT4 version please click here . - This is the exact conversion from TradingView: "Stochastic Momentum Index" By "UCSgears". - This is a popular version of stochastic oscillator on tradingview. - This is a light-load processing and non-repaint indicator. - Buffers are available for the lines on chart. - You can message in private chat for further changes you need. Thanks for downloading
    This indicator is used to compare the relative strength of the trade on the chart against the other several selected symbols. By comparing the price movement of each traded variety based on the same base day, several trend lines of different directions can be seen, reflecting the strong and weak relationship between the several different traded varieties, so that we can have a clearer understanding of the market trend. For example, you can apply this indicator on a EurUSD chart and compare it w
    An indicator of pattern #31 ("Long Island") from Encyclopedia of Chart Patterns by Thomas N. Bulkowski. The second gap is in the opposite direction. Parameters: Alerts - show alert when an arrow appears   Push - send a push notification when an arrow appears (requires configuration in the terminal) GapSize - minimum gap size in points ArrowType - a symbol from 1 to 17 ArrowVShift - vertical shift of arrows in points   ShowLevels - show levels ColUp - color of an upward line ColDn - color of a d
    Your Trend Friend
    Luigi Nunes Labigalini
    5 (1)
    A tendência é sua amiga! Veja a cor do indicador e faça suas operações nessa direção. Ele não repinta. Ou seja, depois que cada candle se fecha, a cor dele é definitiva e não irá se alterar. Você pode focar em movimentos mais curtos e rápidos ou tendências mais longas, basta testar o que melhor se encaixa no seu operacional de acordo com o ativo e tempo gráfico usado. Altere o parâmetro de entrada "Length" e o indicador irá se adaptar automaticamente (quanto maior ele for, maior a tendência an
    The Riko Trend indicator is a revolutionary trend trading and filtering solution with all the important features of a trend tool built into one tool! The Riko Trend indicator is good for any trader, suitable for any trader for both forex and binary options. You don’t need to configure anything, everything is perfected by time and experience, it works great during a flat and in a trend. The Riko Trend indicator is a technical analysis tool for financial markets that reflects the current price f
    STRICTLY FOR BOOM INDEX ONLY!!!!! Here I bring the Maximum Trend Arrows OT1.0 MT5 indicator. This indicator is made up of a combination of different trend indicators for entries and exits, for entries an orange arrow will paint on the chart below the current market and a red flag for closing of trades and it produces buy arrows only. When the orange arrow appears, it will appear along with it's sound to notify you. The 1H timeframe is recommended, don't use it anywhere else than on the 1H timefr
    Cumulative delta indicator As most traders believe, the price moves under the pressure of market buying or selling. When someone redeems an offer standing in the cup, the deal is a "buy". If someone pours into the bid standing in the cup - the deal goes with the direction of "sale". The delta is the difference between purchases and sales. A cumulative delta - the difference between the cumulative sum of purchases and sales for a certain period of time. It allows you to see who is currently contr
    The Penta-O is a 6-point retracement harmonacci pattern which usually precedes big market movements. Penta-O patterns can expand and repaint quite a bit. To make things easier this indicator implements a twist: it waits for a donchian breakout in the right direction before signaling the trade. The end result is an otherwise repainting indicator with a very reliable trading signal. The donchian breakout period is entered as an input. [ Installation Guide | Update Guide | Troubleshooting | FAQ | A
    This indicator uses a mathematical calculation algorithm . This algorithm calculates the remainder between the updated model and the actual values and produces the possible progress of the graph on the graph. It is not a super prophet in trading, but it is very good for the trader when entering the market and to analyze it before entering. Applicable for all currencies. Данный индикатор использует алгоритм математических вычислений . Данный алгоритм вычисляет остаток между обновленной моделью и
    Uma das sequências numéricas é chamada de "Forest Fire Sequence". Foi reconhecida como uma das mais belas novas sequências. Sua principal característica é que essa sequência evita tendências lineares, mesmo as mais curtas. É esta propriedade que formou a base deste indicador. Ao analisar uma série temporal financeira, este indicador tenta rejeitar todas as opções de tendência possíveis. E somente se ele falhar, ele reconhece a presença de uma tendência e dá o sinal apropriado. Esta abordagem pe
    Moving line
    Jun Chao Jiang
    The one minute chart has a bug, but the one-day chart can still be used after deleting the bug and reloading the indicators, This indicator can be used to determine how far the indicator goes up to place an order to buy, how far it goes down to place an order to sell, and not placing an order until it reaches this distance, which is considered oscillation, open an account gift index
    FREE
    Volume Delta Candle
    Muhammad Muzaffar Hussan
    Volume Delta Candles: A Comprehensive Tool for In-Depth Trading Analysis Unlock a seamless way to interpret trading experience within each candle. With Volume Delta Candles, there's no need for additional volume indicators—everything you need is built in. This advanced tool utilizes lower timeframes or live market data to present the percentage of buying versus selling volume within each candle as an intuitive color-coded bar. Before diving in, ensure you’re familiar with Volume and Volume Delta
    Os compradores deste produto também adquirem
    Trend Screener Pro MT5
    STE S.S.COMPANY
    4.88 (68)
    Desbloqueie o poder da negociação de tendências com o indicador Trend Screener: sua solução definitiva de negociação de tendências, alimentada por lógica difusa e sistema de múltiplas moedas! Eleve sua negociação de tendências com o Trend Screener, o revolucionário indicador de tendências alimentado por lógica difusa. É um poderoso indicador de acompanhamento de tendências que combina mais de 13 ferramentas e recursos premium e 3 estratégias de negociação, tornando-o uma escolha versátil para to
    TPSproTREND PrO MT5
    Roman Podpora
    4.54 (13)
    TPSpro TREND PRO  - is a trend indicator that automatically analyzes the market and provides information about the trend and each of its changes, as well as giving signals for entering trades without redrawing! The indicator uses each candle, analyzing them separately. referring to different impulses - up or down impulse. Exact entry points into transactions for currencies, crypto, metals, stocks, indices!  ИНСТРУКЦИЯ RUS         INSTRUCTIONS  ENG       R ecommended to use with an indicator   -
    TPSpro RFI Levels MT5
    Roman Podpora
    4.71 (17)
    INSTRUÇÕES         Russo   -        ENG       R   ecomendado para uso com um indicador       -       TPSpro   TREND PRO -   Versão MT4         Um elemento-chave na negociação são as zonas ou níveis a partir dos quais as decisões de comprar ou vender um instrumento de negociação são tomadas. Apesar das tentativas dos principais participantes de esconder sua presença no mercado, eles inevitavelmente deixam rastros. Nossa tarefa era aprender como identificar esses rastros e interpretá-los corretame
    FX Volume MT5
    Daniel Stein
    4.93 (15)
    FX Volume: Vivencie o Verdadeiro Sentimento de Mercado sob a Perspectiva de um Corretor Visão Geral Rápida Quer aprimorar sua abordagem de trading? FX Volume fornece insights em tempo real sobre como traders de varejo e corretores estão posicionados—bem antes de relatórios atrasados como o COT. Seja para buscar ganhos consistentes ou simplesmente ter uma vantagem mais clara no mercado, FX Volume ajuda você a detectar grandes desequilíbrios, confirmar rompimentos e aperfeiçoar sua gestão de ris
    FX Levels: Suporte e Resistência com Precisão Excepcional para Todos os Mercados Visão Geral Rápida Procurando um meio confiável de identificar níveis de suporte e resistência em qualquer mercado—incluindo pares de moedas, índices, ações ou commodities? FX Levels combina o método “Lighthouse” tradicional com uma abordagem dinâmica de vanguarda, fornecendo uma precisão quase universal. Baseado em nossa experiência real com corretores e em atualizações automáticas diárias mais as de tempo real,
    Golden Trend Indicator MT5
    Noha Mohamed Fathy Younes Badr
    4.86 (14)
    Golden Trend indicator  is The best indicator for predicting trend movement this indicator never lags and never repaints and never back paints    and give  arrow buy and sell    before the candle appear  and it will help you and  will make your trading decisions clearer its work on all currencies and  gold and crypto and all time frame This unique  indicator uses very secret algorithms to catch the  trends, so you can trade using this indicator and see the trend clear on charts  manual guide and
    Este é um indicador para MT5 que fornece sinais precisos para entrar em uma negociação sem redesenhar. Ele pode ser aplicado a qualquer ativo financeiro: forex, criptomoedas, metais, ações, índices. Ele fornecerá estimativas bastante precisas e informará quando é melhor abrir e fechar um negócio. Assista o vídeo (6:22) com um exemplo de processamento de apenas um sinal que compensou o indicador! A maioria dos traders melhora seus resultados de negociação durante a primeira semana de negociação c
    FX Dynamic: Leve Sua Análise de Mercado a Outro Patamar com Precisão Adaptativa Visão Geral Rápida Procurando aprimorar sua vantagem no trading? FX Dynamic oferece insights em tempo real e se adapta aos movimentos do mercado, reagindo instantaneamente a cada novo tick de dados do MetaTrader. Seja para buscar desempenho consistente ou sinais mais confiáveis, FX Dynamic ajuda você a identificar oportunidades-chave, refinar entradas e saídas, além de gerenciar o risco com maior precisão. Comece a
    Antes de tudo, vale ressaltar que esta Ferramenta de Negociação é um Indicador Não Repintante, Não Redesenhante e Não Atrasado, o que a torna ideal para negociação profissional. Curso online, manual do utilizador e demonstração. O Indicador de Conceitos de Ação de Preço Inteligente é uma ferramenta muito poderosa tanto para traders novos quanto experientes. Ele combina mais de 20 indicadores úteis em um único, combinando ideias avançadas de negociação como Análise do Trader do Círculo Interno
    Agora US $ 147 (aumentando para US $ 499 após algumas atualizações) - Contas ilimitadas (PCs ou Macs) Manual do usuário do RelicusRoad + vídeos de treinamento + acesso ao grupo de discórdia privado + status VIP UMA NOVA FORMA DE OLHAR PARA O MERCADO O RelicusRoad é o indicador de negociação mais poderoso do mundo para forex, futuros, criptomoedas, ações e índices, oferecendo aos traders todas as informações e ferramentas necessárias para se manterem rentáveis. Fornecemos análises técnicas e
    Quantum TrendPulse
    Bogdan Ion Puscasu
    5 (7)
    Apresentando   Quantum TrendPulse   , a ferramenta de negociação definitiva que combina o poder do   SuperTrend   ,   RSI   e   Stochastic   em um indicador abrangente para maximizar seu potencial de negociação. Projetado para traders que buscam precisão e eficiência, este indicador ajuda você a identificar tendências de mercado, mudanças de momentum e pontos de entrada e saída ideais com confiança. Principais características: Integração SuperTrend:   siga facilmente a tendência predominante do
    FX Power MT5 NG
    Daniel Stein
    5 (8)
    FX Power: Analise a Força das Moedas para Decisões de Negociação Mais Inteligentes Visão Geral FX Power é a sua ferramenta essencial para compreender a força real das principais moedas e do ouro em quaisquer condições de mercado. Identificando moedas fortes para comprar e fracas para vender, FX Power simplifica as decisões de negociação e revela oportunidades de alta probabilidade. Quer você prefira seguir tendências ou antecipar reversões usando valores extremos de Delta, esta ferramenta adap
    O Support And Resistance Screener está em um indicador de nível para MetaTrader que fornece várias ferramentas dentro de um indicador. As ferramentas disponíveis são: 1. Screener de estrutura de mercado. 2. Zona de retração de alta. 3. Zona de retração de baixa. 4. Pontos de Pivô Diários 5. Pontos Pivot semanais 6. Pontos Pivot mensais 7. Forte suporte e resistência com base no padrão harmônico e volume. 8. Zonas de nível de banco. OFERTA POR TEMPO LIMITADO: O indicador de suporte e resistência
    Gold Stuff mt5
    Vasiliy Strukov
    4.92 (173)
    Gold Stuff mt5-um indicador de tendência projetado especificamente para o ouro, também pode ser usado em qualquer instrumento financeiro. O indicador não é redesenhado ou atrasado. O timeframe recomendado é H1. Importante! Entre em contato comigo imediatamente após a compra para obter instruções e bônus!  Você pode obter uma cópia gratuita do nosso indicador Strong Support e Trend Scanner, envie uma mensagem privada. a mim! PARÂMETRO Draw Arrow-incl.desligado. desenhar setas no gráfico. Aler
    Gold Venamax MT5
    Sergei Linskii
    2.67 (3)
    Gold Venamax - este é o melhor indicador técnico de ações. O algoritmo do indicador analisa o movimento do preço de um ativo e reflete a volatilidade e as zonas de entrada potenciais. Recursos do indicador: Este é um super indicador com Magic e dois blocos de setas de tendência para uma negociação confortável e lucrativa. O botão vermelho para alternar blocos é exibido no gráfico. Magic é definido nas configurações do indicador, para que você possa instalar o indicador em dois gráficos exibin
    Primeiramente, vale ressaltar que este Sistema de Trading é um Indicador Não Repintado, Não Redesenho e Não Atrasado, o que o torna ideal tanto para o trading manual quanto para o automatizado. Curso online, manual e download de predefinições. O "Sistema de Trading Inteligente MT5" é uma solução completa de trading projetada para traders novos e experientes. Ele combina mais de 10 indicadores premium e apresenta mais de 7 estratégias de trading robustas, tornando-o uma escolha versátil para dive
    Easy Breakout MT5
    Mohamed Hassan
    5 (1)
    Enjoy a   50% OFF   Christmas holiday sale!   After your purchase, feel free to contact me for more details on how to receive a bonus indicator called VFI, which pairs perfectly with Easy Breakout for enhanced confluence!     Easy Breakout MT5   is a powerful price action trading system built on one of the most popular and widely trusted strategies among traders: the   Breakout strategy ! This indicator delivers crystal-clear Buy and Sell signals based on breakouts from key support and resis
    ATrend
    Zaha Feiz
    4.73 (11)
    ATREND: Como Funciona e Como Usá-lo #### Como Funciona O indicador "ATREND" para a plataforma MT5 é projetado para fornecer aos traders sinais robustos de compra e venda, utilizando uma combinação de metodologias de análise técnica. Este indicador aproveita principalmente o Intervalo Verdadeiro Médio (ATR) para medir a volatilidade, juntamente com algoritmos de detecção de tendências para identificar possíveis movimentos de mercado. Deixe uma mensagem após a compra e receba um brinde especial.
    IX Power MT5
    Daniel Stein
    4.17 (6)
    IX Power: Descubra informações de mercado para índices, commodities, criptomoedas e forex Visão Geral IX Power é uma ferramenta versátil projetada para analisar a força de índices, commodities, criptomoedas e símbolos de forex. Enquanto o FX Power oferece a máxima precisão para pares de moedas ao utilizar dados de todos os pares disponíveis, o IX Power foca exclusivamente nos dados do mercado do símbolo subjacente. Isso torna o IX Power uma excelente escolha para mercados fora do forex e uma o
    TrendMaestro5
    Stefano Frisetti
    note: this indicator is for METATRADER4, if you want the version for METATRADER5 this is the link:  https://www.mql5.com/it/market/product/108106 TRENDMAESTRO ver 2.4 TRENDMAESTRO recognizes a new TREND in the bud, he never makes mistakes. The certainty of identifying a new TREND is priceless. DESCRIPTION TRENDMAESTRO identifies a new TREND in the bud, this indicator examines the volatility, volumes and momentum to identify the moment in which there is an explosion of one or more of these data a
    Este painel mostra os últimos   padrões harmónicos   disponíveis para os símbolos seleccionados, pelo que poupará tempo e será mais eficiente /   versão MT4 . Indicador gratuito:   Basic Harmonic Pattern Colunas do indicador Symbol :   aparecem os símbolos seleccionados Trend :   de alta ou de baixa Pattern :   tipo de padrão (gartley, borboleta, morcego, caranguejo, tubarão, cifra ou ABCD) Entry :   preço de entrada SL:   preço de paragem de perda TP1:   preço do 1º take profit TP2:   preço
    Apresentando       Quantum Breakout PRO   , o inovador Indicador MQL5 que está transformando a maneira como você negocia Breakout Zones! Desenvolvido por uma equipe de traders experientes com experiência comercial de mais de 13 anos,       Quantum Breakout PRO       foi projetado para impulsionar sua jornada comercial a novos patamares com sua estratégia de zona de fuga inovadora e dinâmica. O Quantum Breakout Indicator lhe dará setas de sinal em zonas de breakout com 5 zonas-alvo de lucro e su
    Matrix Arrow Indicator MT5
    Juvenille Emperor Limited
    5 (13)
    O   Matrix Arrow Indicator MT5   é uma tendência única 10 em 1 seguindo um indicador multi-timeframe   100% sem repintura   que pode ser usado em todos os símbolos/instrumentos:   forex ,   commodities ,   criptomoedas ,   índices ,   ações .  O  Matrix Arrow Indicator MT5  determinará a tendência atual em seus estágios iniciais, reunindo informações e dados de até 10 indicadores padrão, que são: Índice de movimento direcional médio (ADX) Índice de canal de commodities (CCI) Velas clássicas de
    Blahtech Supply Demand MT5
    Blahtech Limited
    4.54 (13)
    Was: $299  Now: $149  Supply Demand uses previous price action to identify potential imbalances between buyers and sellers. The key is to identify the better odds zones, not just the untouched ones. Blahtech Supply Demand indicator delivers functionality previously unavailable on any trading platform. This 4-in-1 indicator not only highlights the higher probability zones using a multi-criteria strength engine, but also combines it with multi-timeframe trend analysis, previously confirmed swings
    DESCRIÇÃO ICSM (Impulse-Correction SCOB Mapper) é o indicador que analisa o movimento do preço e identifica impulsos válidos, correções e SCOBs (Single Candle Order Block). É uma ferramenta poderosa que pode ser usada com qualquer tipo de análise técnica porque é flexível, informativa, fácil de usar e melhora substancialmente a consciência do trader sobre as zonas de interesse mais líquidas. CONFIGURAÇÕES Geral | Visuais Tema de cor — define o tema de cor do ICSM. SCOB | Visuais Mostrar S
    - Lifetime update free -   Real price is 80$   - 25% Discount ( It is 59$ now ) Contact me for instruction, any questions! Related Product:  Gold Trade Expert MT5 - Non-repaint Introduction The breakout and retest strategy is traded support and resistance levels. it involves price breaking through a previous level.  The break and retest strategy is designed to help traders do two main things, the first is to avoid false breakouts. Many false breakouts start with a candlestick that breaks out o
    Trend Line Map Pro MT5
    STE S.S.COMPANY
    4.09 (11)
    O indicador Trend Line Map é um complemento do Trend Screener Indicator. Ele funciona como um scanner para todos os sinais gerados pelo Trend screener (Trend Line Signals). É um Trend Line Scanner baseado no Trend Screener Indicator. Se você não tiver o Trend Screener Pro Indicator, o Trend Line Map Pro não funcionará. It's a Trend Line Scanner based on Trend Screener Indicator. If you don't have Trend Screener Pro Indicator,     the Trend Line Map Pro will not work . Acessando nosso Blog MQ
    Atomic Analyst MT5
    Issam Kassas
    4.32 (19)
    Primeiramente, vale ressaltar que este Indicador de Negociação não repinta, não redesenha e não apresenta atrasos, tornando-o ideal tanto para negociação manual quanto automatizada. Manual do utilizador: configurações, entradas e estratégia. O Analista Atômico é um Indicador de Ação de Preço PA que utiliza a força e o momentum do preço para encontrar uma vantagem melhor no mercado. Equipado com filtros avançados que ajudam a remover ruídos e sinais falsos, e aumentam o potencial de negociação.
    Trend Forecaster
    Alexey Minkov
    5 (6)
    !SPECIAL SALE!  The Trend Forecaster indicator utilizes a unique proprietary algorithm to determine entry points for a breakout trading strategy. The indicator identifies price clusters, analyzes price movement near levels, and provides a signal when the price breaks through a level. The Trend Forecaster indicator is suitable for all financial assets, including currencies (Forex), metals, stocks, indices, and cryptocurrencies. You can also adjust the indicator to work on any time frames, althoug
    Gold Trend 5
    Sergei Linskii
    5 (1)
    Tendência do ouro - este é um bom indicador técnico de acções. O algoritmo do indicador analisa o movimento do preço de um ativo e reflecte a volatilidade e as potenciais zonas de entrada. Os melhores sinais do indicador: - Para VENDER = histograma vermelho + ponteiro SHORT vermelho + seta de sinal amarelo na mesma direção. - Para COMPRAR = histograma azul + ponteiro LONGO azul + seta de sinal aqua na mesma direção. Vantagens do indicador: 1. O indicador produz sinais com elevada precisão
    Mais do autor
    Antes de tudo, vale ressaltar que esta Ferramenta de Negociação é um Indicador Não Repintante, Não Redesenhante e Não Atrasado, o que a torna ideal para negociação profissional. Curso online, manual do utilizador e demonstração. O Indicador de Conceitos de Ação de Preço Inteligente é uma ferramenta muito poderosa tanto para traders novos quanto experientes. Ele combina mais de 20 indicadores úteis em um único, combinando ideias avançadas de negociação como Análise do Trader do Círculo Interno
    O Captador de Tendências: A Estratégia do Captador de Tendências com Indicador de Alerta é uma ferramenta versátil de análise técnica que auxilia os traders na identificação de tendências de mercado e potenciais pontos de entrada e saída. Apresenta uma Estratégia dinâmica do Captador de Tendências, adaptando-se às condições do mercado para uma representação visual clara da direção da tendência. Os traders podem personalizar os parâmetros de acordo com suas preferências e tolerância ao risco. O
    FREE
    Primeiramente, vale ressaltar que este Sistema de Trading é um Indicador Não Repintado, Não Redesenho e Não Atrasado, o que o torna ideal tanto para o trading manual quanto para o automatizado. Curso online, manual e download de predefinições. O "Sistema de Trading Inteligente MT5" é uma solução completa de trading projetada para traders novos e experientes. Ele combina mais de 10 indicadores premium e apresenta mais de 7 estratégias de trading robustas, tornando-o uma escolha versátil para dive
    O Localizador de Níveis de Suporte e Resistência: O Localizador de Níveis de Suporte e Resistência é uma ferramenta avançada projetada para aprimorar a análise técnica no trading. Com níveis dinâmicos de suporte e resistência, ele se adapta em tempo real conforme novos pontos-chave se desdobram no gráfico, fornecendo uma análise dinâmica e responsiva. Sua capacidade única de múltiplos intervalos de tempo permite aos usuários exibir níveis de suporte e resistência de diferentes intervalos de te
    FREE
    Ferramenta de Posição de Negociação e Backtesting: A "Ferramenta de Posição de Negociação e Backtesting", também conhecida como "Ferramenta de Risco e Recompensa", é um indicador abrangente e inovador projetado para aprimorar sua análise técnica e estratégias de negociação. A Ferramenta de Risco é uma solução completa e fácil de usar para gestão eficaz de riscos na negociação forex. Com a capacidade de visualizar posições de negociação, incluindo preço de entrada, stop-loss (SL) e take-profit
    FREE
    O Indicador de Tempo das Sessões de Negociação: O "Indicador de Tempo das Sessões de Negociação" é uma poderosa ferramenta de análise técnica projetada para aprimorar sua compreensão das diferentes sessões de negociação no mercado Forex. Este indicador integrado de forma transparente fornece informações cruciais sobre os horários de abertura e fechamento das principais sessões, incluindo Tóquio, Londres e Nova York. Com o ajuste automático do fuso horário, ele atende aos traders globalmente, a
    FREE
    O Localizador de Níveis de Suporte e Resistência: O Localizador de Níveis de Suporte e Resistência é uma ferramenta avançada projetada para aprimorar a análise técnica no trading. Com níveis dinâmicos de suporte e resistência, ele se adapta em tempo real conforme novos pontos-chave se desdobram no gráfico, fornecendo uma análise dinâmica e responsiva. Sua capacidade única de múltiplos intervalos de tempo permite aos usuários exibir níveis de suporte e resistência de diferentes intervalos de te
    FREE
    O Indicador de Tempo das Sessões de Negociação: O "Indicador de Tempo das Sessões de Negociação" é uma poderosa ferramenta de análise técnica projetada para aprimorar sua compreensão das diferentes sessões de negociação no mercado Forex. Este indicador integrado de forma transparente fornece informações cruciais sobre os horários de abertura e fechamento das principais sessões, incluindo Tóquio, Londres e Nova York. Com o ajuste automático do fuso horário, ele atende aos traders globalmente, a
    FREE
    Ferramenta de Posição de Negociação e Backtesting: A "Ferramenta de Posição de Negociação e Backtesting", também conhecida como "Ferramenta de Risco e Recompensa", é um indicador abrangente e inovador projetado para aprimorar sua análise técnica e estratégias de negociação. A Ferramenta de Risco é uma solução completa e fácil de usar para gestão eficaz de riscos na negociação forex. Com a capacidade de visualizar posições de negociação, incluindo preço de entrada, stop-loss (SL) e take-profit
    FREE
    Get FREE Advanced Online Course and Learn About Our Advanced Trading System, Link in the Bio!  Click Here.  Our Mission and Vision:   Why Am I Even Here?    Here is The Deal Brother, We Offer:Premium Quality Indicators: The Highest Quality Possible Algorithms. Unlimited Activations: Can be used on Unlimited number of Computers, MT4s and MT5s for lifetime. Inexpensive Prices: 30$ is the lowest price possible, Knowing that more than 50% of our Indicators are 100% FREE. But Why Am I telling You th
    Description:  For a comprehensive understanding of our indicators, we invite you to explore the entire Q&A section within this MQL5 blog post   here . The "Currency Strength Meter Strategy" Indicator is a cutting-edge technical analysis tool that offers traders a unique perspective on the forex market. By analyzing the relative strength of different currencies, this indicator provides valuable insights into the market's dynamics, allowing traders to make informed decisions. Understanding Curren
    Description:  The Range Breakout Catcher Indicator is a powerful tool known for its non-repainting, non-redrawing, and non-lagging capabilities, making it suitable for both manual and robot trading. This indicator utilizes a smart algorithm to calculate ranges and generate early signals for Buy and Sell positions at the breakout of these ranges, facilitating the capture of trends during ranging consolidations. The range calculation involves a comprehensive system based on various elements, prov
    Description:  The "Trend Finder Multi Time Frames multi pairs" indicator is a new technical analysis tool designed to assist traders in identifying and confirming trends across multiple timeframes and multiple pairs at the same time. By combining the strengths of various timeframes, this indicator offers a comprehensive view of the market's direction, helping traders make more informed decisions. Features: Multi-Timeframe Analysis: The indicator analyzes trends on different timeframes (e.g., M1
    Description:  For a comprehensive understanding of our indicators, we invite you to explore the entire Q&A section within this MQL5 blog post   here . The "VWAP Indicator Strategy" is a cutting-edge technical analysis tool designed to provide traders with a competitive advantage in the financial markets. By incorporating the Volume Weighted Average Price (VWAP) indicator, this tool offers valuable insights into market trends, price levels, and potential turning points. Understanding the VWAP Ind
    Description:  The "ABC Pattern Strategy With Fibonacci" Indicator is a sophisticated technical analysis tool meticulously designed to recognize and leverage the power of the ABC chart patterns in combination with Fibonacci levels. This cutting-edge strategy empowers traders to make well-informed decisions in the dynamic forex market. By making spotting ABC patterns on price charts an easy task, the indicator offers insights into potential trend reversals or continuations. It seamlessly incorpora
    Description:  For a comprehensive understanding of our indicators, we invite you to explore the entire Q&A section within this MQL5 blog post   here . The "Moving Average Lines Crossover with Alert" is a valuable technical analysis tool designed to help traders identify potential trend reversals and trading opportunities. Seamlessly integrated into your trading platform, this indicator empowers you with essential data to make well-informed trading decisions. Spot Trend Reversals: Utilize the pow
    FREE
    Show TP and SL Values
    Issam Kassas
    4.56 (9)
    Description:  For a comprehensive understanding of our indicators, we invite you to explore the entire Q&A section within this MQL5 blog post   here . The "Show TP and SL Values" Indicator is a valuable technical analysis tool designed to enhance your trading experience by displaying the  (TP) and  (SL) levels directly on your chart. This simple yet effective tool provides traders with crucial information, allowing for better decision-making and risk management. Key Features: TP and SL Display:
    FREE
    Price Alert Panel MT4
    Issam Kassas
    4.75 (12)
    Get FREE Advanced Online Course and Learn About Our Advanced Trading System, Link in the Bio!  Click Here.  Our Mission and Vision: Why Am I Even Here?Here is The Deal Brother, We Offer: Premium Quality Indicators: The Highest Quality Possible Algorithms. Unlimited Activations: Can be used on Unlimited number of Computers, MT4s and MT5s for lifetime. Inexpensive Prices: 30$ is the lowest price possible, Knowing that more than 50% of our Indicators are 100% FREE. But Why Am I telling You this?
    FREE
    Description:  For a comprehensive understanding of our indicators, we invite you to explore the entire Q&A section within this MQL5 blog post   here . The Moving Average 5EMA Indicator is a valuable tool designed to provide comprehensive insights into market trends and potential entry and exit points. It incorporates five exponential moving average (EMA) lines, each representing the average price over different periods. This powerful combination offers a deeper understanding of price movements a
    FREE
    Description:  For a comprehensive understanding of our indicators, we invite you to explore the entire Q&A section within this MQL5 blog post   here . The "High Spread Alert" Indicator is a valuable tool for traders, providing real-time information about spread fluctuations in the forex market. As a technical analysis tool, it helps traders make informed decisions by alerting them to periods of high spread, which can impact trading conditions and execution. Key Features: Spread Monitoring: The
    FREE
    Description:  For a comprehensive understanding of our indicators, we invite you to explore the entire Q&A section within this MQL5 blog post   here . The "VWAP Indicator Strategy" is a cutting-edge technical analysis tool designed to provide traders with a competitive advantage in the financial markets. By incorporating the Volume Weighted Average Price (VWAP) indicator, this tool offers valuable insights into market trends, price levels, and potential turning points. Understanding the VWAP Ind
    Description:  For a comprehensive understanding of our indicators, we invite you to explore the entire Q&A section within this MQL5 blog post   here . The "Live Account Statistics" Indicator is a powerful technical analysis tool that provides real-time insights into the performance of your trading account. With this indispensable tool, you can access crucial account statistics, such as balance, equity, drawdown, and more, allowing you to make data-driven trading decisions. Key Features: Real-Ti
    FREE
    Description:  For a comprehensive understanding of our indicators, we invite you to explore the entire Q&A section within this MQL5 blog post   here . The "High Spread Alert" Indicator is a valuable tool for traders, providing real-time information about spread fluctuations in the forex market. As a technical analysis tool, it helps traders make informed decisions by alerting them to periods of high spread, which can impact trading conditions and execution. Key Features: Spread Monitoring: The i
    FREE
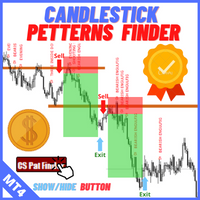
    Description:  For a comprehensive understanding of our indicators, we invite you to explore the entire Q&A section within this MQL5 blog post   here . The "Candlestick Pattern Finder with Alerts and Hide Button" is a sophisticated technical analysis tool designed to elevate your trading experience by identifying key candlestick patterns in the market. This powerful indicator offers valuable insights into price action, enabling you to make well-informed trading decisions. Unlock Candlestick Insi
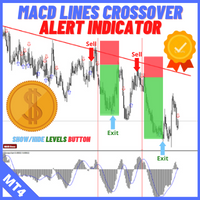
    Description:  For a comprehensive understanding of our indicators, we invite you to explore the entire Q&A section within this MQL5 blog post   here . The "MACD Crossover with Alert and Button" is a valuable technical analysis tool designed to help traders spot potential trend changes and trading opportunities in the market. This indicator provides essential insights into the market's momentum, enabling you to make well-informed trading decisions. Master the MACD Indicator: The Moving Average Co
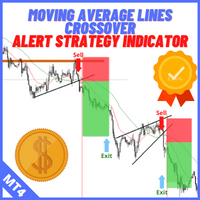
    Description:  For a comprehensive understanding of our indicators, we invite you to explore the entire Q&A section within this MQL5 blog post   here . The "Moving Average Lines Crossover with Alert" is a valuable technical analysis tool designed to help traders identify potential trend reversals and trading opportunities. Seamlessly integrated into your trading platform, this indicator empowers you with essential data to make well-informed trading decisions. Spot Trend Reversals: Utilize the po
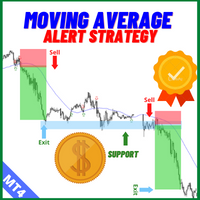
    Description:  For a comprehensive understanding of our indicators, we invite you to explore the entire Q&A section within this MQL5 blog post   here . The Moving Average Cross Price Alert Indicator is a technical tool designed to simplify your trading decisions. With a single moving average line, this indicator effectively identifies trend changes and potential trade opportunities. Its core function is to provide real-time alerts when the price crosses above or below the moving average line, sig
    Description:  The "Trend Finder Multi Time Frames multi pairs" indicator is a new technical analysis tool designed to assist traders in identifying and confirming trends across multiple timeframes and multiple pairs at the same time. By combining the strengths of various timeframes, this indicator offers a comprehensive view of the market's direction, helping traders make more informed decisions. Features: Multi-Timeframe Analysis: The indicator analyzes trends on different timeframes (e.g., M1
    Description:  For a comprehensive understanding of our indicators, we invite you to explore the entire Q&A section within this MQL5 blog post   here . The RSI Cross Alert Indicator is a powerful technical analysis tool designed to assist traders in identifying potential trend reversals and generating timely buy or sell signals. This user-friendly indicator is suitable for both novice and experienced traders, providing valuable insights into market trends and price movements. Key Features: - RSI
    Filtro:
    Sheereen Taweel
    360
    Sheereen Taweel 2023.08.07 04:22 
     

    Good Indicator

    marcofi
    96
    marcofi 2023.01.11 15:15 
     

    O usuário não deixou nenhum comentário para sua avaliação

    Issam Kassas
    332232
    Resposta do desenvolvedor Issam Kassas 2023.01.11 17:31
    I would say it gas to do with your computer power, Analysing the chart and looking for such kind of data and drawing the whole set ups will definitely take a lot of processing power from ur computer. So I would suggest that u use it on much powerful computer.
    Or decrease the number of bars scanned at least to get it Analyse less data and make it faster.
    On my computer even with 10000 bars it's working fast with no issues whatsoever!
    nolimitzfx
    148
    nolimitzfx 2022.12.18 20:06 
     

    Based on what I see on my charts it looks very solid. Remember it does what it is supposed to do - find the 123 pattern - NOW how much knowledge in general you have about trading, chart reading, support - resistance, candle patterns, chart patterns ect will determine if you can use this (or any indicator) to profitability. There is no win all trades indicator. I bought this and it does work. If you have experience with the 123 pattern and are well versed at trading you will like this indicator as well. Good job to the creator!

    faithdefender
    1736
    faithdefender 2022.12.17 01:27 
     

    Very dissapointed in this indicator so far. I give it a three only because the price was fair. However, trying to find trades on the MT5 was (so far) not prosperous and beneficial. For example, looking back at a past opportunity provided by the indicator, the trade was WAY out of control. The entry was @ 3978.-the stop was at 3948. and the T1 was at 3991. While the indicator did pull it off, that seems a bit too risky for R and R. . My second complaint at the moment is the indicator does not always remove from the screen. When try to remove it. The indicator is removed, but the Hide/Show 123 box is not removed. I have sent a pic to the Vendor in the comments section so he is aware. It always sucks to be the first to buy an indicator b/c you are the experiment. If things change I will update my review. To be fair, this is my 3rd 123 indicator from MQL and the other 2 were nothing to write home about. But as I said, this was priced fairly. (sort of)

    Issam Kassas
    332232
    Resposta do desenvolvedor Issam Kassas 2022.12.17 08:01
    First of all!
    Thank you so much for the review It means a lot for me, and thro these reviews we work together and create a better Indicators that will hopefully serve a lot of people.
    Pls Give me time to address your two Concerns:
    1. The Late Entry Signal.
    2. The Button Removal from the chart.
    -------------------------------------------------------------------------------------------------------------
    1. The Late Entry Signal: I will mention here 4 important points: A. This Strategy based on the original 123 and Fibos levels: I can not by any means deviate from the original strategy, and one of the rules are Enter at the Close of the Candle after the breaking below or above point 2, with that being said I replicate the same exact scenario of real manual trading style, So if the Entery is far from the point 2 OFC the Stop loss is going to be huge, Again in a typical manual trading scenario the pro traders will just skip that one Because the RRR (Risk to Reward Ratio) is not worth it! I have mentioned this in my videos and also in the description under the Tips. B. This is not a Robot but Its an indicator: This point is very much related to the above mentioned point, the Idea of this indicator is to replicate a pro trader chart scanning (unbiased analysis) and provide it to the user on a silver plate! Just to Explain Further This is no different than any other indicator like MACD RSI MAs... It Provide you with data and its up to you to Decide to take it or not, We dont Promise Treasures and holly grills, Part of it is the bad entries that you should Simply Avoid-Skip-Ignore, Well in a Robot trading the Robot does not understand whether Its bad entry or not, In that case that would be problematic, but In our case we do know bad entry and all we have to do again is just Ignore It! C. The Take Profits Placements: The Take Profit levels By default are based on max 1:1.5 RRR (Risk to reward Ratio), this Strategy is able to Provide more than that, that's why I left the choice in the settings for the user to choose their suitable Take Profit Levels. D. This is a manual trading strategy: I cant emphasis enough on this Point, In the MACD strategies you are using the macd data to look for entries, so you dont blame the creator of the macd for the losing trades or the late signals, but instead what you do is you ignore the late signals and you take the loses in good faith, The indicator is no different, Its a tool that provide you with data, this data is exactly how a pro trader find trades using the 123 strategy+Fibos.
    -------------------------------------------------------------------------------------------------------------------------------------------------------------
    2. The Button removal from the chart:
    This one is on me, Its my Fault and Pls Accept my apologies for that from my heart and i promise it will be solved in the next update! (this issue is only for the MT5 users, this issues does not exist in the MT4 version).
    ---------------------------------------------------------------------------------------------------------------------------------------------------------------- Conclusion:
    As creators not only me, we are trying to provide value we have no bad intentions, totally the opposite we are trying to help you have a better trading experience, and we work really hard for that, sometimes we dont even sleep! we are honest and geniun, and we are not greedy we try to provide high quality value at the lowest Price Possible! So Pls Help us Help you But at least:
    1. Understand our Products before you review us.
    2. when you review us be Fair with us Pls.
    Thank you!
    Responder ao comentário