PivotHighLow
- Indicadores
- Petr Plechac
- Versão: 1.2
- Atualizado: 22 novembro 2021
- Ativações: 5
PivotHighLow.
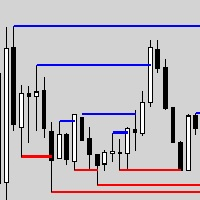
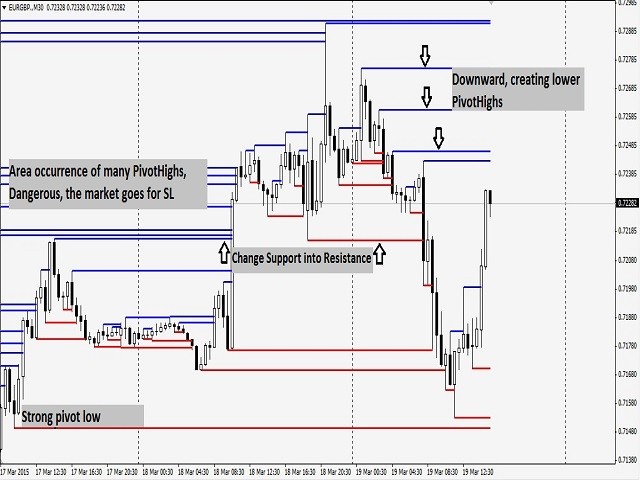
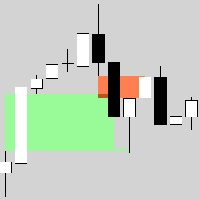
Universal business tool from professional traders that helps to visualize interest market situations. It previews markets using a price action and sentiment in the market. Tool is necessary to understand the market situation and the anticipation of further movement. Finally, you will see how traders estimate the market.
With this tool, you will see important supports and resistances. It shows you the entry of big players on the market.
The indicator works on all timeframes. You are not limited by use of different timeframes, the indicator is able to adapt. On the screenshots, you can see different views of the PivotHighLow indicator and entrances to the market. The indicator contains basic settings. Please keep in mind that the use of more bars for calculation may lead to the program slowdown.
Finally, you will see the entry of big players in the market!
It is not possible to manually draw all PivotHighLow on all markets you trade!
Settings:
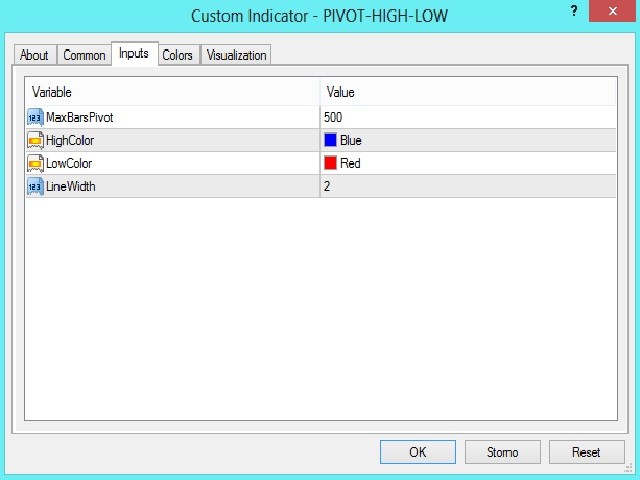
- MaxBarsPivot=500 – indicator shows PivotHigh/Low 500 bars back
- HighColor – color of high Pivot
- LowColor – color of low Pivot
- LineWidth=2 – line width












I bought this indicator and looks like its perfect. But then i notice that it doesn't refresh or update the lines every candle, you have to refresh it manually!!!, also if you cancel your indicator from the screen it leaves all lines on the chart. You need to start a new chart!!! to clean the mess. Very dissapointing because i think the idea of this indicator is great!, but the coding is very bad. I am hoping the seller will give us a better version.