• Visão global
  • Comentários
  • Discussão

How the day starts

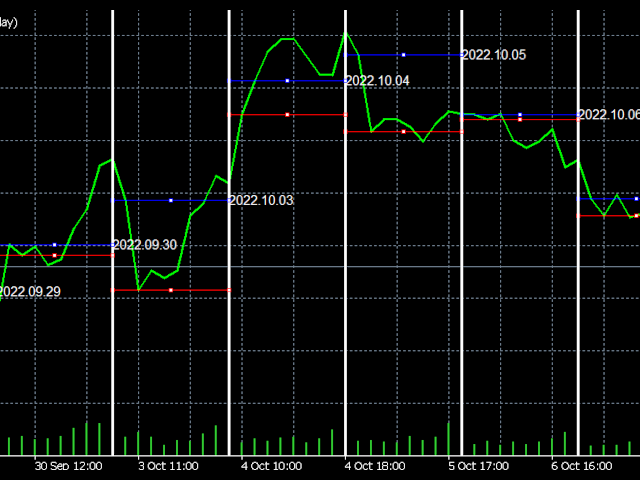
This indicator draws the high intraday price and the low intraday price of the first n minutes of the day. The chart shows the days with vertical lines and two horizontal lines to indicate the max and the min close price of the n first minutes of the day. The max/min lines start and end with the day calculated.
With this indicator you can see how starts the day compared with the previous days.
It is valid for any market inasmuch as the start time is calculated with the data received.

Parameters 

  • offsetMinutes:  Amount of first minutes of the day to calculate. It must be under 60*4 minutes
  • InpStyle: Day Line style. Style of the vertical line intra days
  • InpWidth: Day Line width. Width of the vertical line intra days
  • InpLineDayColor: Day Line color. Colour of the vertical line intra days
  • InpLineMaxColor: Max Line color. Colour of the max line
  • InpLineMinColor: Min Line color. Colour of the min line
  • InpFont: Font. Date Font
  • InpFontSize: Font size. Date Font Size
Produtos recomendados
Auto Fib Retracements
Ross Adam Langlands Nelson
4.33 (6)
Automatic Fibonacci Retracement Line Indicator. This indicator takes the current trend and if possible draws Fibonacci retracement lines from the swing until the current price. The Fibonacci levels used are: 0%, 23.6%, 38.2%, 50%, 61.8%, 76.4%, 100%. This indicator works for all charts over all timeframes. The Fibonacci levels are also recorded in buffers for use by other trading bots. Any comments, concerns or additional feature requirements are welcome and will be addressed promptly. 
FREE
Este é sem dúvida o indicador de reconhecimento automático de formação de preço harmônico mais completo que você pode encontrar para a MetaTrader Platform. Ele detecta 19 padrões diferentes, leva as projeções de Fibonacci tão a sério quanto você, exibe a Zona de Reversão Potencial (PRZ) e encontra níveis adequados de stop loss e take-profit. [ Guia de instalação | Guia de atualização | Solução de problemas | FAQ | Todos os produtos ] Detecta 19 formações harmônicas de preços diferentes Tr
Automatic fibonacci with alerts is an indicator that automatically plots a fibonacci retracement based on the number of bars you select on the BarsToScan setting in the indicator. The fibonacci is automatically updated in real time as new highest and lowest values appear amongst the selected bars. You can select which level values to be displayed in the indicator settings. You can also select the color of the levels thus enabling the trader to be able to attach the indicator several times with d
Construção automática e acompanhamento dos níveis de Fibonacci para a compra e venda com qualquer instrumento (símbolo), e em qualquer período do gráfico. FiboPlus mostra: níveis de Fibonacci de movimentos prováveis de preços para cima ou para baixo. pontos de entrada são mostrados com ícones "seta para cima", "seta para baixo", a informação está duplicada nos botões SELL, BUY. área retangular delimitada pelos níveis de 0 a 100. Comércio de um nível para outro (sem tendência). Características
O Captador de Tendências: A Estratégia do Captador de Tendências com Indicador de Alerta é uma ferramenta versátil de análise técnica que auxilia os traders na identificação de tendências de mercado e potenciais pontos de entrada e saída. Apresenta uma Estratégia dinâmica do Captador de Tendências, adaptando-se às condições do mercado para uma representação visual clara da direção da tendência. Os traders podem personalizar os parâmetros de acordo com suas preferências e tolerância ao risco.
FREE
ICT Kill zone and Macros Indicator mark and display the following zone times on the chart: Kill zones   Kill zone Forex Asian London Open New York Open London Close Central Bank Dealing range Kill zone Indices Asian London Open New York AM New York Lunch New York PM Power Hour Macros London 1 London 2 New York Am 1 New York AM 2 New York Lunch New York PM 1 New York PM 2 Silver bullet London Open New York AM New York PM Sessions Asian London New York Chart The display of  Kill zone ,
The indicator detects and displays М. Gartley's Butterfly pattern. The pattern is plotted by the extreme values of the ZigZag indicator (included in the resources, no need to install). After detecting the pattern, the indicator notifies of that by the pop-up window, a mobile notification and an email. The pattern and wave parameters are displayed on the screenshots. The default parameters are used for demonstration purposes only in order to increase the amount of detected patterns. Parameters
O nível Premium é um indicador único com mais de 80% de precisão nas previsões corretas! Este indicador foi testado pelos melhores Especialistas em Negociação por mais de dois meses! O indicador do autor você não encontrará em nenhum outro lugar! A partir das imagens você pode ver por si mesmo a precisão desta ferramenta! 1 é ótimo para negociar opções binárias com um tempo de expiração de 1 vela. 2 funciona em todos os pares de moedas, ações, commodities, criptomoedas Instruções:
Ultimate Supply Demand MT5
Ramon Sobrevals Arce
5 (4)
After working during many months, with the help of Neural Networks, we have perfected the ultimate tool you are going to need for identifying key price levels (Supports and Resistances) and Supply and Demand zones. Perfectly suitable to trigger your trades, set up your future actions, decide your Take Profit and Stop Loss levels, and confirm the market direction. Price will always move between those levels, bouncing or breaking; from one zone to another, all the remaining movements are just mark
Mine Farm
Maryna Kauzova
5 (1)
Mine Farm is one of the most classic and time-tested scalping strategies based on the breakdown of strong price levels. Mine Farm is the author's modification of the system for determining entry and exit points into the market... Mine Farm - is the combination of great potential with reliability and safety. Why Mine Farm?! - each order has a short dynamic Stop Loss - the advisor does not use any risky methods (averaging, martingale, grid, locking, etc.) - the advisor tries to get
Magnetic levels for MT5 is a great addition to your trading strategy if you use support and resistance levels, supply and demand zones. The price very often gives good entry points to the position exactly at the round levels and near them. The indicator is fully customizable and easy to use: -Choose the number of levels to be displayed -Choose the distance Between The levels -Choose the color of the levels. Can be added to your trading system for more confluence. Works very well when combin
Free automatic Fibonacci is an indicator that automatically plots a Fibonacci retracement based on the number of bars you select on the BarsToScan setting in the indicator. The Fibonacci is automatically updated in real time as new highest and lowest values appears amongst the selected bars. You can select which level values to be displayed in the indicator settings. You can also select the color of the levels thus enabling the trader to be able to attach the indicator several times with differe
FREE
Camarilla Swing Trade
Chayakorn Rakwongthai
Camarilla Swing Trade is an Expert Advisor. It has a Swing Trade trading strategy using entry and exit points from Camarilla Pivot Points, trading when there is an advantage in buying or selling. And there is a system to prevent damage to the investment portfolio by not trading in cases where the price on TF week is very volatile. Support and resistance points are calculated from the High Low Close of the previous TF Week's price. Testing from testing EURUSD on TF for 1 hour during 01.01.2021 to
Introduction to X3 Chart Pattern Scanner X3 Cherart Pattern Scanner is the non-repainting and non-lagging indicator detecting X3 chart patterns including Harmonic pattern, Elliott Wave pattern, X3 patterns, and Japanese Candlestick patterns. Historical patterns match with signal patterns. Hence, you can readily develop the solid trading strategy in your chart. More importantly, this superb pattern scanner can detect the optimal pattern of its kind. In addition, you can switch on and off individu
Welcome to the Ultimate Harmonic Patterns recognition indicator that is focused to detect advanced patterns. The Gartley pattern, Bat pattern, and Cypher pattern  are popular technical analysis tools used by traders to identify potential reversal points in the market. Our Ultimate Harmonic Patterns recognition Indicator is a powerful tool that uses advanced algorithms to scan the markets and identify these patterns in real-time. With our Ultimate Harmonic Patterns recognition Indicator, you
Fibonacci theft is an ultrascalping system that uses Fibonacci levels to launch a scalping system that allows theft   a few pips from the market. This system allows the use of fibonacci levels, predetermined levels or a level chosen by the user. It also presents the option of using or not volume and impulse filters. Being a very aggressive scalping system, it should only be used in pairs with a low spread and low commissions. This system is suitable for small accounts and can be used with onl
This Automatic support/resistance indicator calculates various peaks and troughs of the price action, identifies relevant levels and draws support and resistance automatically. It uses the built-in "ZigZag" indicator in Metatrader as a data source hence, very much accurate indicator.  The support and resistance lines are contineusely updated as new levels and formed. The indicator has only 5 parameters to set, and mostly it can be used with the default values:  The description of the settings is
MultSet
Amani Fungo
3 (2)
Multset  This is inte_plays indicator, which helps the trader to enter the trades appropriately it plots an arrow when there is appropriate environment which permits trading Features 1. Sends push notification on mobile devices  2. Plots arrow on chart when the setting is found TimeFrame Is suggested to be used on higher time frames only, especially starting 15min and above for proper moves For more informations please  Visit:  https://t.me/Tz_Fx_Lab Subscribe to our Youtube channel:  htt
FREE
Noize Absorption Index - is the manual trading system that measures the difference of pressure between bears forces and bulls forces. Green line - is a noize free index that showing curent situation. Zero value of index shows totally choppy/flat market.Values above zero level shows how powerfull bullish wave is and values below zero measures bearish forces.Up arrow appears on bearish market when it's ready to reverse, dn arrow appears on weak bullish market, as a result of reverse expectation.
MSnR Lines
Pierre Paul Amoussou
MSnR Lines é um indicador personalizado projetado para exibir níveis de suporte e resistência em um gráfico. Esses níveis são baseados na teoria de Suporte e Resistência da Malásia, que define os níveis não como áreas, mas como níveis de preço específicos derivados de picos e vales de gráficos de linha. Recursos: Três tipos de níveis: A-Level, V-Level e Nível de lacuna. Indicação de frescor para níveis: Os níveis frescos são mais significativos do que os níveis não frescos. Cor e estilo personal
Este é um indicador MTF dos níveis de suporte e resistência com base nos   extremos do indicador Advanced ZigZag Dynamic   e / ou   Extended Fractals   com etiquetas de preço (pode ser desativado). TFs mais altos podem ser selecionados para o modo MTF. Por padrão, os níveis são gerados com base nos pontos do indicador ZigZag. Os pontos indicadores fractais também podem ser usados em conjunto com o ZigZag ou em vez dele. Para simplificar o uso e economizar tempo de CPU, o cálculo é realizado uma
Fibo Expertt
Ignacio Agustin Mene Franco
Fibo expert! It is an automatic fibonacci indicator. adapting to any temporality, to catch those rebounds, or the path of that trend, special to make longs in H1 or H4 clear the trend, but it also works for scalp in m1 up to m15 works for all forex pairs and for all pairs of synthetic indices, ideal for volatility 75 in synthetics no more to enjoy good profit World Investor.
QM Pattern Scanner MT5
Reza Aghajanpour
5 (4)
QM (Quasimodo) Pattern is based on Read The Market(RTM) concepts. The purpose of this model is to face the big players of the market (financial institutions and banks), As you know in financial markets, big traders try to fool small traders, but RTM prevent traders from getting trapped. This style is formed in terms of price candles and presented according to market supply and demand areas and no price oscillator is used in it. RTM concepts are very suitable for all kinds of investments, includi
This indicator is based on the classical indicators: RSI (Relative Strangth Index) and CCI (Commodity Channel Index) and will be helpful for those who love and know how to use not a visual but digital representation of the indicators. The indicator shows values from each timeframe. You will be able to change the main input parameters for each RSI and CCI for every TF. Parameters OverboughtLevel_R = 70; OversoldLevel_R = 30; OverboughtLevel_C = 100; OversoldLevel_C = -100; Example for M1: sTF1 =
What was IFM created for Our goal in creating IFM was to provide the tool to manage your Fibonacci Retrecements and other Fibo tools in MetaTrader 5. This indicator allows you to edit all of the settings without getting into it by right click on the tool. That is faster and easiest way to manage objects on your chart. Inputs Font size - change font size of texts on the IFM panel. This is necessary, because some of users change font size in Windows settings Description of the Fibo levels (varia
Price Breakout pattern Scanner is the automatic scanner for traders and investors. It can detect following patterns automatically from your chart. Head and Shoulder - Common tradable pattern. Reverse Head and Shoulder - This pattern is the reverse formation of the Head and Shoulder. Double Top - When the price hits resistance level twice and decline toward the support level, the trader can anticipate sudden bearish breakout through the support level. Double Bottom - The double bottom pattern is
Construção automática e acompanhamento dos níveis de Fibonacci para a compra e venda com qualquer instrumento (símbolo), e em qualquer período do gráfico. FiboPlus Trend mostra: a tendência em todos os prazos e valores indicadores. níveis de Fibonacci de movimentos prováveis de preços para cima ou para baixo. pontos de entrada são mostrados com ícones "seta para cima", "seta para baixo", a informação está duplicada nos botões SELL, BUY. área retangular delimitada pelos níveis de 0 a 100. Comér
Fibonacci sequence is defined by integer sequence: 0, 1, 1, 2, 3, 5, 8, 13, 21, 34, 55, 89, 144, ... By definition, it starts from 0 and 1, the next number is calculated as a sum of two previous numbers. Instead of the standard moving average, the indicator uses the following calculation of average price: Bar0 + Bar1 + Bar2 + Bar3 + Bar5 + Bar8 + Bar13 + Bar21 + ... This indicator shows 2 moving Fibonacci lines and arrows when 2 these lines crossing each other. If an Aqua line is crossing a Yell
O indicador mostra padrões harmônicos no gráfico   sem repintar   com o mínimo de atraso possível. A busca por topos de indicadores é baseada no princípio de onda de análise de preços. As configurações avançadas permitem que você escolha parâmetros para seu estilo de negociação. Na abertura de uma vela (barra), quando um novo padrão é formado, uma seta da direção provável do movimento do preço é fixada, a qual permanece inalterada. O indicador reconhece os seguintes padrões e suas variedades: AB
Os compradores deste produto também adquirem
Atomic Analyst MT5
Issam Kassas
5 (14)
Primeiramente, vale ressaltar que este Indicador de Negociação não repinta, não redesenha e não apresenta atrasos, tornando-o ideal tanto para negociação manual quanto automatizada. Manual do utilizador: configurações, entradas e estratégia. O Analista Atômico é um Indicador de Ação de Preço PA que utiliza a força e o momentum do preço para encontrar uma vantagem melhor no mercado. Equipado com filtros avançados que ajudam a remover ruídos e sinais falsos, e aumentam o potencial de negociação.
Primeiramente, vale ressaltar que este Sistema de Trading é um Indicador Não Repintado, Não Redesenho e Não Atrasado, o que o torna ideal tanto para o trading manual quanto para o automatizado. Curso online, manual e download de predefinições. O "Sistema de Trading Inteligente MT5" é uma solução completa de trading projetada para traders novos e experientes. Ele combina mais de 10 indicadores premium e apresenta mais de 7 estratégias de trading robustas, tornando-o uma escolha versátil para dive
Quantum Trend Sniper
Bogdan Ion Puscasu
4.91 (43)
Apresentando       Quantum Trend Sniper Indicator   , o inovador Indicador MQL5 que está transformando a maneira como você identifica e negocia as reversões de tendência! Desenvolvido por uma equipe de traders experientes com experiência comercial de mais de 13 anos,       Indicador de Atirador de Tendência Quântica       foi projetado para impulsionar sua jornada de negociação a novos patamares com sua forma inovadora de identificar reversões de tendência com precisão extremamente alta. ***C
FX Power MT5 NG
Daniel Stein
5 (5)
Receba a sua atualização diária do mercado com detalhes e screenshots através do nosso Morning Briefing aqui no mql5 e no Telegram ! O FX Power MT5 NG é a próxima geração do nosso medidor de força de moeda muito popular de longa data, o FX Power. E o que é que este medidor de força da próxima geração oferece? Tudo o que adorou no FX Power original MAIS Análise de força GOLD/XAU Resultados de cálculo ainda mais precisos Períodos de análise configuráveis individualmente Limite de cálculo personal
Trend Screener Pro MT5
STE S.S.COMPANY
4.88 (64)
Desbloqueie o poder da negociação de tendências com o indicador Trend Screener: sua solução definitiva de negociação de tendências, alimentada por lógica difusa e sistema de múltiplas moedas! Eleve sua negociação de tendências com o Trend Screener, o revolucionário indicador de tendências alimentado por lógica difusa. É um poderoso indicador de acompanhamento de tendências que combina mais de 13 ferramentas e recursos premium e 3 estratégias de negociação, tornando-o uma escolha versátil para to
Antes de tudo, vale ressaltar que esta Ferramenta de Negociação é um Indicador Não Repintante, Não Redesenhante e Não Atrasado, o que a torna ideal para negociação profissional. Curso online, manual do utilizador e demonstração. O Indicador de Conceitos de Ação de Preço Inteligente é uma ferramenta muito poderosa tanto para traders novos quanto experientes. Ele combina mais de 20 indicadores úteis em um único, combinando ideias avançadas de negociação como Análise do Trader do Círculo Intern
FX Volume MT5
Daniel Stein
4.94 (17)
Receba a sua atualização diária do mercado com detalhes e screenshots através do nosso Morning Briefing aqui no mql5 e no Telegram ! O Volume FX é o PRIMEIRO e ÚNICO indicador de volume que fornece uma visão REAL do sentimento do mercado do ponto de vista de um corretor. Ele fornece uma visão incrível de como os participantes do mercado institucional, como corretores, estão posicionados no mercado Forex, muito mais rápido do que os relatórios COT. Ver essas informações diretamente no seu gráfi
Reversal First Impulse levels (RFI)      INSTRUCTIONS        RUS       -       ENG              R ecommended to use with an indicator   -   TREND PRO -  Version MT4                 A key element in trading is zones or levels from which decisions to buy or sell a trading instrument are made. Despite attempts by major players to conceal their presence in the market, they inevitably leave traces. Our task was to learn how to identify these traces and interpret them correctly. Main functions:: Di
Bill Williams Advanced
Siarhei Vashchylka
5 (5)
Bill Williams Advanced is designed for automatic chart analysis using Bill Williams' "Profitunity" system. The indicator analyzes four timeframes at once. Manual (Be sure to read before purchasing) Advantages 1. Automatically analyzes the chart using the "Profitunity" system of Bill Williams. The found signals are placed in a table in the corner of the screen. 2. Equipped with a trend filter based on the Alligator indicator. Most of the system signals are recommended to be used only accordi
TPSproTREND PrO MT5
Roman Podpora
4.88 (8)
TPSpro TRENDPRO  - is a trend indicator that automatically analyzes the market and provides information about the trend and each of its changes, as well as giving signals for entering trades without redrawing! The indicator uses each candle, analyzing them separately. referring to different impulses - up or down impulse. Exact entry points into transactions for currencies, crypto, metals, stocks, indices!  -  Version MT4               DETAILED DESCRIPTION               R ecommended to use with
AW Trend Predictor MT5
AW Trading Software Limited
4.78 (58)
A combinação de níveis de tendência e quebra em um sistema. Um algoritmo de indicador avançado filtra o ruído do mercado, determina a tendência, os pontos de entrada e os possíveis níveis de saída. Os sinais indicadores são registrados em um módulo estatístico, que permite selecionar as ferramentas mais adequadas, mostrando a eficácia do histórico do sinal. O indicador calcula as marcas Take Profit e Stop Loss. Manual e instruções ->   AQUI   / versão MT4 ->   AQUI Como negociar com o indicador
ICT, SMC, SMART MONEY CONCEPTS, SMART MONEY, Smart Money Concept, Support and Resistance, Trend Analysis, Price Action, Market Structure, Order Blocks, BOS/CHoCH,   Breaker Blocks ,  Momentum Shift,   Supply&Demand Zone/Order Blocks , Strong Imbalance,   HH/LL/HL/LH,    Fair Value Gap, FVG,  Premium  &   Discount   Zones, Fibonacci Retracement, OTE, Buy Side Liquidity, Sell Side Liquidity, BSL/SSL Taken, Equal Highs & Lows, MTF Dashboard, Multiple Time Frame, BigBar, HTF OB, HTF Market Structure
Easy By Sell is a market indicator for opening and closing positions. It becomes easy to track market entries with alerts. It indicates trend reversal points when a price reaches extreme values ​​and the most favorable time to enter the market. it is as effective as a Fibonacci to find a level but it uses different tools such as an algorithm based on ATR indicators and Stochastic Oscillator. You can modify these two parameters as you wish to adapt the settings to the desired period. My othe
Torne-se um Negociador Breaker e lucre com as mudanças na estrutura do mercado à medida que o preço reverte. O indicador de quebra de bloco de pedidos identifica quando uma tendência ou movimento de preço está chegando à exaustão e pronto para reverter. Ele o alerta sobre mudanças na estrutura do mercado, que normalmente ocorrem quando uma reversão ou uma grande retração está prestes a ocorrer. O indicador usa um cálculo proprietário que identifica rupturas e momento do preço. Toda vez que
The Volume by Price Indicator for MetaTrader 5 features Volume Profile and Market Profile TPO (Time Price Opportunity). Volume and TPO histogram bar and line charts. Volume Footprint charts. TPO letter and block marker collapsed and split structure charts. Session filtering and grouping. Static, dynamic and flexible range segmentation and compositing methods with relative and absolute visualizations. Graphical layering, positioning and styling options to suit the user's analytic and aesthetic n
Este é um indicador para MT5 que fornece sinais precisos para entrar em uma negociação sem redesenhar. Ele pode ser aplicado a qualquer ativo financeiro: forex, criptomoedas, metais, ações, índices. Ele fornecerá estimativas bastante precisas e informará quando é melhor abrir e fechar um negócio. Assista o vídeo (6:22) com um exemplo de processamento de apenas um sinal que compensou o indicador! A maioria dos traders melhora seus resultados de negociação durante a primeira semana de negociação c
"Piranha" - an autonomous trading system that determines overbought and oversold levels on the chart. Red and blue zones represent overbought and oversold levels respectively. Entry points are marked with arrows: a downward arrow in the red zone for "sell" and an upward arrow in the blue zone for "buy". The Take profit level is indicated by the green moving average. Key features: Adjusting the Take profit level as the green moving average changes position. Averaging ability when a new market e
Quantum Heiken Ashi PRO MT5
Bogdan Ion Puscasu
4.5 (8)
Apresentando o   Quantum Heiken Ashi PRO Projetadas para fornecer informações claras sobre as tendências do mercado, as velas Heiken Ashi são conhecidas por sua capacidade de filtrar o ruído e eliminar sinais falsos. Diga adeus às confusas flutuações de preços e olá para uma representação gráfica mais suave e confiável. O que torna o Quantum Heiken Ashi PRO verdadeiramente único é sua fórmula inovadora, que transforma os dados tradicionais de velas em barras coloridas fáceis de ler. As barras ve
Legacy of Gann for MT5
Pavel Zamoshnikov
5 (6)
The indicator very accurately determines the levels of the possible end of the trend and profit fixing. The method of determining levels is based on the ideas of W.D.Gann, using an algorithm developed by his follower Kirill Borovsky. Extremely high reliability of reaching levels (according to K. Borovsky  - 80-90%) Indispensable for any trading strategy – every trader needs to determine the exit point from the market! Precisely determines targets on any timeframes and any instruments (forex, met
** All Symbols x All Timeframes scan just by pressing scanner button ** ***Contact me after purchase to send you instructions and add you in "123 scanner group" for sharing or seeing experiences with other users. After 17 years of experience in the markets and programming, Winner indicator is ready. I would like to share with you! Introduction The 123 Pattern Scanner indicator with a special enhanced algorithm is a very repetitive common pattern finder with a high success rate . Interestingly,
Advanced Supply Demand MT5
Bernhard Schweigert
4.53 (15)
Atualmente com 33% de desconto! A melhor solução para qualquer Trader Novato ou especialista! Este indicador é uma ferramenta de negociação exclusiva, de alta qualidade e acessível porque incorporamos uma série de recursos proprietários e uma nova fórmula. Com esta atualização, você poderá mostrar fusos horários duplos. Você não só será capaz de mostrar um TF mais alto, mas também mostrar ambos, o TF do gráfico, MAIS o TF mais alto: MOSTRANDO ZONAS ANINHADAS. Todos os traders de Oferta e Demanda
IX Power MT5
Daniel Stein
5 (3)
O   IX Power   traz finalmente a precisão imbatível do FX Power para símbolos não-Forex. Determina com exatidão a intensidade das tendências a curto, médio e longo prazo nos seus índices, acções, mercadorias, ETFs e até criptomoedas favoritos. Pode   analisar tudo o que   o seu terminal tem para oferecer. Experimente e veja como   o seu timing melhora significativamente   quando negoceia. Características principais do IX Power Resultados de cálculo 100% precisos e sem repintura - para tod
O Indicador de Reversão ADR mostra rapidamente onde o preço está sendo negociado atualmente em relação ao seu intervalo médio diário normal. Você receberá alertas instantâneos via pop-up, e-mail ou push quando o preço exceder seu intervalo médio e níveis acima dele de sua escolha, para que você possa saltar rapidamente para retrocessos e reversões. O indicador desenha linhas horizontais no gráfico nos extremos médios do intervalo diário e também extensões acima daqueles níveis que têm probabili
Gartley Hunter Multi
Siarhei Vashchylka
5 (7)
Gartley Hunter Multi - An indicator for searching for harmonic patterns simultaneously on dozens of trading instruments and on all possible timeframes. Manual (Be sure to read before purchasing) | Version for MT4 Advantages 1. Patterns: Gartley, Butterfly, Shark, Crab. Bat, Alternate Bat, Deep Crab, Cypher 2. Simultaneous search for patterns on dozens of trading instruments and on all possible timeframes 3. Search for patterns of all possible sizes. From the smallest to the largest 4. A
A melhor solução para qualquer novato ou comerciante especializado! Este Indicador é uma ferramenta comercial única, de alta qualidade e acessível, porque incorporámos uma série de características proprietárias e uma nova fórmula. Com apenas UM gráfico, pode ler a força da moeda para 28 pares de Forex! Imagine como a sua negociação irá melhorar porque é capaz de apontar o ponto exacto do gatilho de uma nova tendência ou oportunidade de escalada? Manual do utilizador:   clique aqui Este é
Fractal Advanced MT5
Siarhei Vashchylka
5 (3)
Fractal Advanced - displays Fractal and Alligator indicators on the price chart. Has wide options for settings and customization. It is also equipped with alerts and a hotkey system. Manual (Be sure to read before purchasing) | Version for MT4 Advantages 1. The indicator does not fill the entire chart with fractals, but allows you to display only relevant signals. 2. The number of fractals is adjusted by scrolling the mouse while holding down the Shift key. 3. Instantly show/hide the Alligator
FxaccurateLS
Shiv Raj Kumawat
WHY IS OUR FXACCCURATE LS MT5 THE PROFITABLE ? PROTECT YOUR CAPITAL WITH RISK MANAGEMENT Gives entry, stop and target levels from time to time. It finds Trading opportunities by analyzing what the price is doing during established trends. POWERFUL INDICATOR FOR A RELIABLE STRATEGIES We have made these indicators with a lot of years of hard work. It is made at a very advanced level. Established trends provide dozens of trading opportunities, but most trend indicators completely ignore them!
TPA True Price Action indicator reveals the true price action of the market makers through 100% non-repainting signals strictly at the close of a candle! TPA shows entries and re-entries, every time the bulls are definitely stronger than the bears and vice versa. Not to confuse with red/green candles. The shift of power gets confirmed at the earliest stage and is ONE exit strategy of several. There are available now two free parts of the TPA User Guide for our customers. The first "The Basics"
Este painel mostra os últimos   padrões harmónicos   disponíveis para os símbolos seleccionados, pelo que poupará tempo e será mais eficiente /   versão MT4 . Indicador gratuito:   Basic Harmonic Pattern Colunas do indicador Symbol :   aparecem os símbolos seleccionados Trend :   de alta ou de baixa Pattern :   tipo de padrão (gartley, borboleta, morcego, caranguejo, tubarão, cifra ou ABCD) Entry :   preço de entrada SL:   preço de paragem de perda TP1:   preço do 1º take profit TP2:   preç
Próxima geração de zonas automatizadas de oferta e demanda. Algoritmo novo e inovador que funciona em qualquer gráfico. Todas as zonas estão sendo criadas dinamicamente de acordo com a ação do preço do mercado. DOIS TIPOS DE ALERTAS --> 1) QUANDO O PREÇO ATINGE UMA ZONA 2) QUANDO UMA NOVA ZONA É FORMADA Você não recebe mais um indicador inútil. Você obtém uma estratégia de negociação completa com resultados comprovados.     Novas características:     Alertas quando o preço ati
Mais do autor
Missing Time
Sergio Antoni Escudero Tirado
An easy indicator that simply shows the moment we connect to the market. We can easily see what has happened while we were gone because the line has two different colors that show the start time. It is only that, a visualization aid that allow us to mark the market behavior while it was night time in our country, or if we have stopped several hours. Input: Server start working date: Day of month Month Year Hour Minutes
FREE
Mini One for All Trend Scanner
Sergio Antoni Escudero Tirado
Mini One for All Trend Scanner is a trend following multi-symbol indicator that can be used with any input: forex, stocks, commodities,... The panel shows   three indicators and six symbols with the trend for every pair (symbol/indicator): up, down or no trend. The indicators are: Average Directional Movement Index (ADX) Moving Average Convergence Divergence (MACD) Relative Strength Index (RSI) You can change quickly the chart by clicking any one of the symbol button in the panel. This feature
FREE
Volume Day Before
Sergio Antoni Escudero Tirado
This indicator draws a price area in which the volume percentage was traded the day before. The chart shows the days with vertical lines and two horizontal lines to indicate the upper price and the lower price of the percentage of volume was traded the day before. The upper/lower lines start and end with the day calculated. But they are referred with the values of the day before. NOT the day in which are. With this indicator you can see where the volume moved in the day before. It uses percenti
One for All Trend Scanner
Sergio Antoni Escudero Tirado
One for All Trend Scanner is a trend following multi-symbol indicator that can be used with any input: forex, stocks, commodities,... The panel shows three indicators and six symbols with the trend for every pair (symbol/indicator): up, down or no trend. The indicators are: Average Directional Movement Index (ADX) Moving Average Convergence Divergence (MACD) Relative Strength Index (RSI) You can choose which indicators will use for entry/exit and can adjust the parameters of each indicator sepa
Filtro:
Sem comentários
Responder ao comentário