Meco Ultimate Channel
- Indicadores
- Thapelo Kapwe
- Versão: 1.0
- Ativações: 5
This indicator belongs to the family of channel indicators. These channel indicator was created based on the principle that the market will always trade in a swinging like pattern. The swinging like pattern is caused by the existence of both the bulls and bears in a market. This causes a market to trade in a dynamic channel. it is designed to help the buyer to identify the levels at which the bulls are buying and the bear are selling. The bulls are buying when the Market is cheap and the bears are selling when the Market is expensive.
It is designed to help the trader practice a principles of "Buy THE LOW, SELL THE HIGH". This indicator can be used to trade Ranging markets and Trending Markets.in Ranging markets, Reversal strategies can be used along with this indicator and in Trending Markets , Trend trading Strategies can be used along side with this indicator.
In Trend Reversing strategies , it can be used with Oscillators like RSI, STOCHASTIC, MACD, ATR, VOLUMES, Divergence indicators , harmonic Patterns, ICT and smart Money strategies. for Trend Followings strategies the channel can be used with indicators like Pullback indicators , Oscillator Convergences , Continuation Patterns like Triangle , Flags, Market imbalances etc
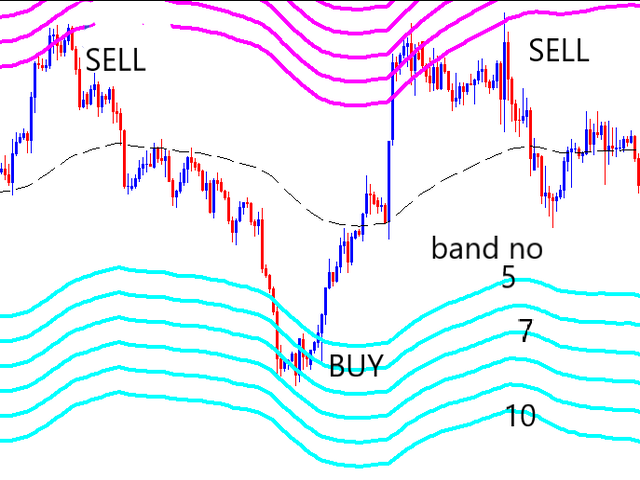
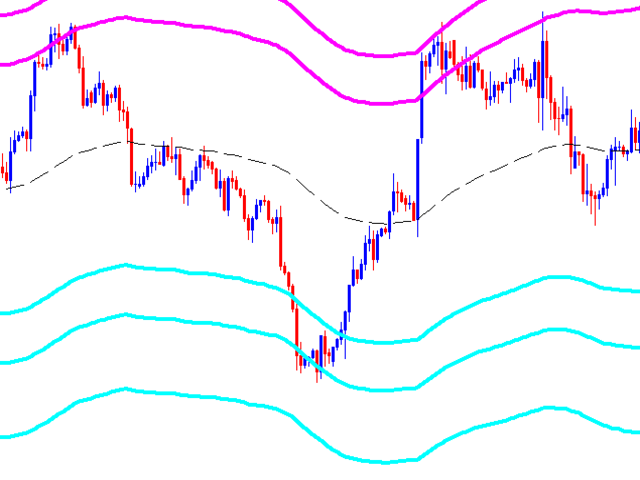
in trend reversing the orders are executed when the prices reaches the upper and lower bands of the channel as shown on the screenshots. In trade following the orders are executed when reaching the mid line of the channel which is dotted line in the default setting as shown on the screenshots. The indicator can be used in any time-frame from scalping , swing trading and investing. it can be used in all market from Forex, stock and Synthetics.
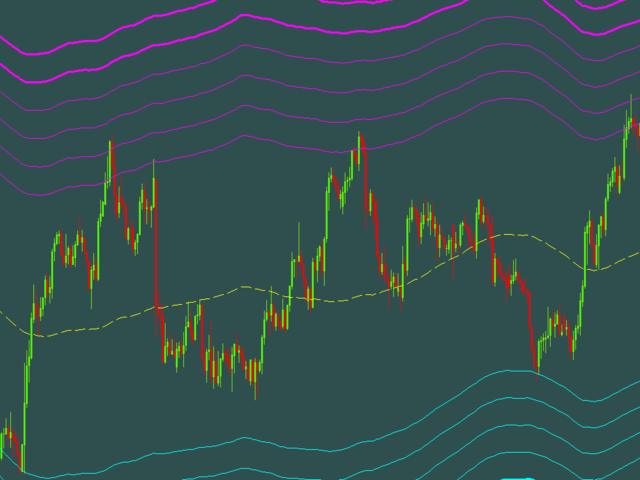
The channel can be modified to suit the market you are trading, by changing the bands of the channel or the averaging method of the channel.Also the colour of the bands can be changed to suit the background of your choice. by default the indicator comes with 3 upper bands and 3 lower bands , hence you can add it twice in a chart to have 6 upper bands and 6 lower bands. the bands can be stepped by 5, 6,7,8,9,10. You will also need to zoom in your charts to see all the channel bands.









This software product is great. But there is a question to ask the author:in my chart, only three lines are shown above and only three lines are shown below. How can we achieve the six lines above and six lines below? Please give me a solution! Thanks a lot!