• Visão global
  • Comentários
  • Discussão (12)
  • O que há de novo

Fractal breakout level

Purpose and functions of the indicator

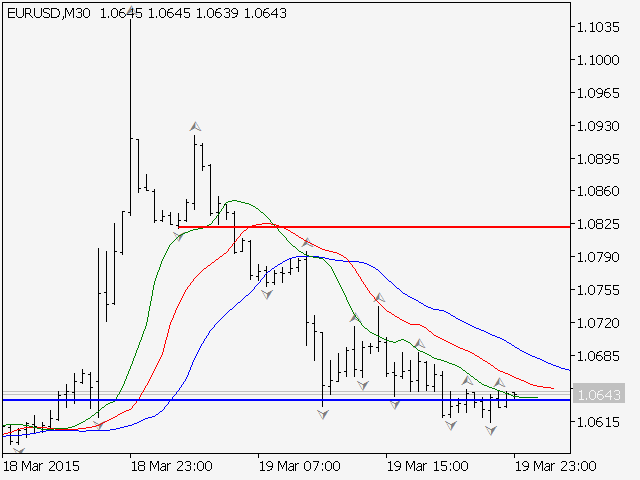
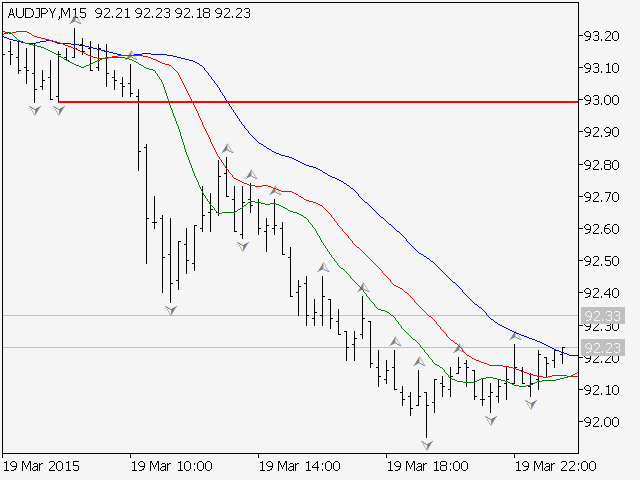
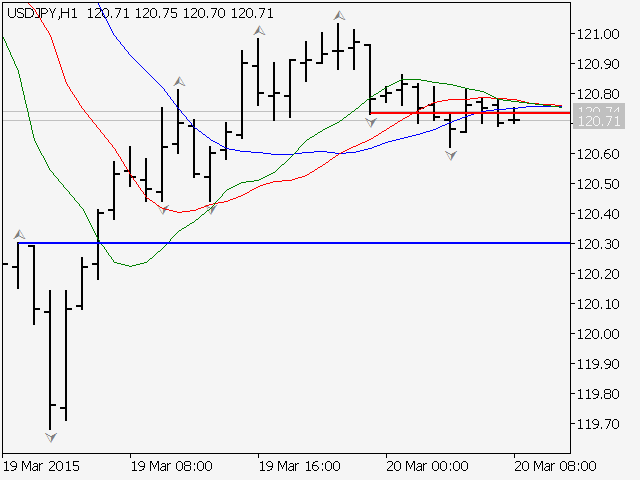
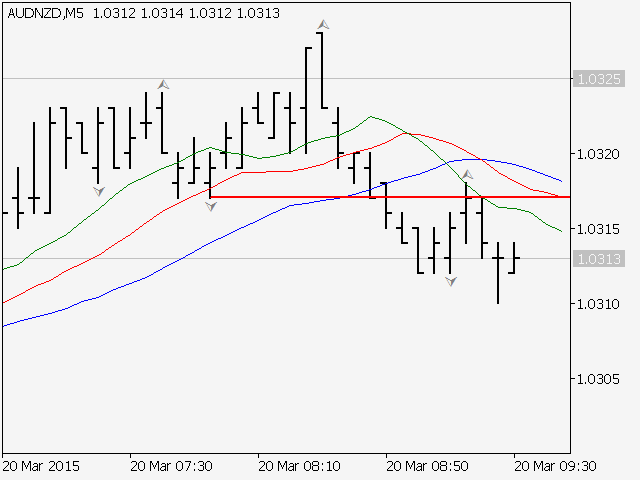
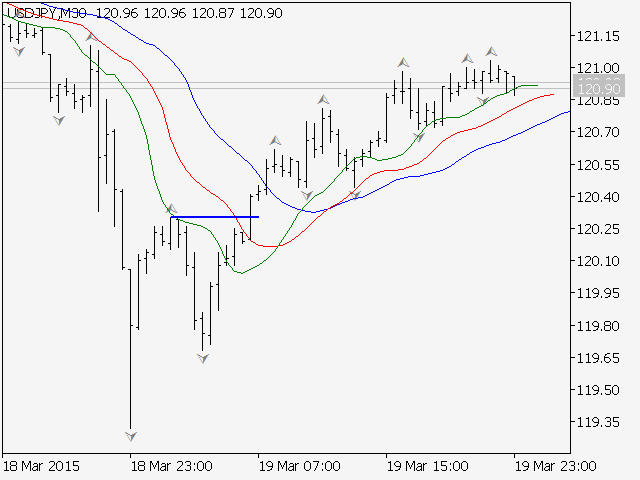
The indicator determines and marks the moments of trend change on the chart based on the theory of fractal levels breakout on any of the analyzed timeframes. If a breakout based on all rules is valid, a horizontal line with corresponding color will appear on the chart. If there is an uptrend, the line will be blue. In the descending trend, the line will be red. The blue line is a strong support level, the trader should look for buying opportunities above this line. The red line is a resistance level, the trader should sell below it.

Stop loss with a buy trade should be set under the lowest low below the blue line. Stop loss for a sell trade should be set on the highest high above the red line. The color change of the line notifies the trader about a trend change. All the fractals and their breakouts that are located between these lines do not represent the change of trend. If the line appears on a larger timeframe, it has a higher priority than the smaller ones. When the line is formed on the daily chart, the trader should look for buying/selling opportunities on the smaller timeframes.


Indicator parameters

  • Draw history levels = false\true — method to display the support and resistance levels in the history. False - display only the last 2 lines of a trend change. True - all changes in history.
  • Labels size=2 — thickness of support or resistance lines.
  • Color of UP signals=Blue — color of line in the ascending trend. Blue color is default.
  • Color of DN signals=Red — color of line in the descending trend. Red color is default.
  • UP - size and color of a dot, which displays the period when there is an uptrend.
  • DN - size and color of a dot, which displays the period when there is a downtrend.

The indicator is self-sufficient trading system. It is recommended to use it as a filter of trading signals in a software package consisting of the following products:

Produtos recomendados
Title: Advanced Trend Lines   Supports and Resistances Levels Overview: Enhance your trading decisions with this powerful Trend Lines Supports and Resistances Levels Indicator . This tool identifies key market structures such as trend lines, pivot points, and support/resistance zones, providing traders with actionable insights to spot potential breakout or reversal opportunities. Tailored for technical analysts, this indicator offers customizability and real-time alerts to match any trading str
This is a well-known ZigZag indicator. But it differs by the fact that its plot is based on values of the middle line which is set by a user. It can display Andrews’ Pitchfork and standard or Bobokus Fibo levels. NO REPAINTING. Parameters Period МА — middle line period. Default value is 34. Minimum value is 4. Maximum value is set at your discretion. Used to calculate price — type of price used for the midline calculations. The averaging method — type of smoothing for the middle line. Turning p
KDJ Index 4   交易实用必备工具指标 波浪自动计算指标,通道趋势交易 完美的趋势-波浪自动计算通道计算 , MT4版本 完美的趋势-波浪自动计算通道计算 , MT5版本 本地跟单复制交易 Easy And Fast Copy , MT4版本 Easy And Fast Copy , MT5版本 本地跟单复制交易 模拟试用 Easy And Fast Copy , MT4 模拟账号运行 Easy And Fast Copy , MT5 模拟账号运行 "Cooperative QQ:556024  "  "Cooperation wechat:556024"  "Cooperative email:556024@qq.com" 强烈推荐趋势指标, 波浪的标准自动计算   和   波浪的标准自动计算MT5版本     KDJ指标又叫 随机指标 ,是一种相当新颖、实用的技术分析指标,它起先用于期货市场的分析,后被广泛用于股市的中短期趋势分析,是期货和股票市场上最常用的技术分析工具。 随机指标KDJ一般是用于股票分析的统计体系,根据统计学原理,通过一个特定的周期(常为9日、9周等)
ATrend
Zaha Feiz
4.73 (11)
ATREND: Como Funciona e Como Usá-lo #### Como Funciona O indicador "ATREND" para a plataforma MT5 é projetado para fornecer aos traders sinais robustos de compra e venda, utilizando uma combinação de metodologias de análise técnica. Este indicador aproveita principalmente o Intervalo Verdadeiro Médio (ATR) para medir a volatilidade, juntamente com algoritmos de detecção de tendências para identificar possíveis movimentos de mercado. Deixe uma mensagem após a compra e receba um brinde especial.
Price Channel Premium
Ignacio Agustin Mene Franco
PriceChannel! It is an indicator programmed to capture floor entries and ceiling sales! gives multiple inputs according to the temporality that you use it works for support and resistance too! It works in any temporality, works for forex currency markets ! for the pairs of synthetic indices ! Ideal for volatility and jumps! It also works for crash and boom! Good Profit, World Investor.
It's a indicators that computes volatility-adjusted momentum. The problem with the  momentum indicator  is that it's absolute and it's hard to interpret its value. For example, if you'll change the timeframe or instrument value of Momentum will be very different. We tried to solve that by expressing momentum in  volatility  . This way you can easier spot overbought/oversold values. You can choose to use Standard Deviation or ATR for adjustments. Our method is base on Momentum and the Cross-secti
The Envelopes indicator determines the presence of a trend or flat. It has 3 types of signals, shows the probable retracement levels and levels of the possible targets. The Fibonacci coefficients are used in the indicator's calculations. Signals   (generated when touching the lines or rebounding from lines): Trend   - the middle line of the Envelopes has a distinct inclination; the lines below the channel's middle line are used for buy trades, the lines above the middle line and the middle line
Fifth dimension
Gennadiy Stanilevych
5 (1)
The indicator looks for the "Fifth dimension" trade signals and marks them on the chart. A detailed description of the chart patterns that generate the trade signals can be found in Chapter 8 "The Balance Line Trades" in the book Williams' "New Trading Dimensions". Signal levels with indication of the position entry or stop loss placement price are indicated directly on the chart. This feature creates additional convenience for the trader when placing pending orders. A solid horizontal line is d
Linear Regressions Convergence Divergence is an oscillator indicator of a directional movement plotted as a difference of two linear regressions with lesser and greater periods. This is a further development of the ideas implemented in the standard MACD oscillator. It has a number of advantages due to the use of linear regressions instead of moving averages. The indicator is displayed in a separate window as a histogram. The signal line is a simple average of the histogram. The histogram value a
With this easy to set up indicator you can display and set alerts for the following candlestick formations: Bull Breakout, Bear Breakout, Hammer, Pin, Bullish Engulfing, Bearish Engulfing. Input parameters: ShortArrowColor: The color of the Arrows, displaying a Bearish candle formation LongArrowColor: The color of the Arrows displaying a Bullish candle formation BullishEngulfing: Disabled/Enabled/EnabledwithAlert BearishEngulfing: Disabled/Enabled/EnabledwithAlert Pin:  Disabled/Enabled/Enabledw
FREE
Enhance your price action strategy: inside bar breakouts at your fingertips This indicator detects inside bars of several ranges, making it very easy for price action traders to spot and act on inside bar breakouts. [ Installation Guide | Update Guide | Troubleshooting | FAQ | All Products ] Easy to use and understand Customizable color selections The indicator implements visual/mail/push/sound alerts The indicator does not repaint or backpaint An inside bar is a bar or series of bars which is/a
Fractals
Mikhail Nazarenko
The Fractals indicator displays on the chart only fractals with the specified parameters in the indicator settings. This allows you to more accurately record a trend reversal, excluding false reversals. According to the classical definition of a fractal, it is a candlestick - an extremum on the chart, which was not crossed by the price of 2 candles before and 2 candles after the appearance of a fractal candle. This indicator provides the ability to adjust the number of candles before and after t
TrendDetect
Pavel Gotkevitch
The Trend Detect indicator combines the features of both trend indicators and oscillators. This indicator is a convenient tool for detecting short-term market cycles and identifying overbought and oversold levels. A long position can be opened when the indicator starts leaving the oversold area and breaks the zero level from below. A short position can be opened when the indicator starts leaving the overbought area and breaks the zero level from above. An opposite signal of the indicator can b
This indicator is based on the classical indicator Parabolic SAR and will be helpful for those who love and know how to use not a visual but digital representation of the indicator. All MT5 TimeFrames PSAR indicator shows values from each time frames: M1, M2, M3, M4, M5, M6, M10, M12, M15, M20, M30, H1, H2, H3, H4, H6, H8, H12, D1, W1, AND MN1. You will be able to change the main input parameters for each CCI for every TF. Example for M1 sTF1___ = "M1"; pStep1 = 0.02; pMax1 = 0.2; Input parame
Point Black
Ignacio Agustin Mene Franco
Black Card Pack indicator 5/1 point black It has the strategy of professional bollingers where each arrow gives you a different entry signal. It is used to operate in m1 and in d1 It is used for scalping and intraday, modified for forex markets ! suitable for all pairs modified for synthetic index markets suitable for all pairs! Ideal for volatility and jumps!
Estratégia do Setup 9.1 criado pelo trader norte-americano Larry Williams . Setup SIMPLES, efetivo, com bom nível de acerto e excelente retorno. Atenção : A versão Demo só funciona no testador, se estiver interessado em executar em tempo real, por favor, entre em contato que estarei providenciando outra versão . Sinal de Compra: Média móvel exponencial de 9 (MME9) caindo, esperar que ela VIRE PARA CIMA (em candle fechado). Lançar uma ordem stop 1 tick acima da MÁXIMA do candle que fez a virada o
Description The base of this indicator is an ZigZag algorithm based on ATR and Fibo retracement. The ZigZag can be drawn like a classic ZigZag or like Arrows or needn't be drawn at all. This indicator is not redrawing in sense that the ZigZag's last shoulder is formed right after the appropriate conditions occur on the market. The shoulder doesn't change its direction afterwards (can only continue). There are some other possibilities to show advanced information in this indicator: Auto Fibo on
Ticks ADX
Andrej Nikitin
The Average Directional Movement Index indicator drawn using a tick chart. After launching it, wait for enough ticks to come. Parameters: Period - period of averaging. Сalculated bar - number of bars on the chart for the indicator calculation. Buffer indexes: 0 - MAIN_LINE, 1 - PLUSDI_LINE, 2 - MINUSDI_LINE.
Permita-me apresentar o Golden Sniper Indicator , uma poderosa ferramenta MQL5 meticulosamente desenvolvida para traders que desejam aprimorar sua experiência de negociação. Desenvolvido por uma equipe de traders experientes com mais de 6 anos de expertise , este indicador oferece um método confiável para identificar oportunidades de negociação com notável precisão. Principais Características : Alertas e Setas de Sinal : O Golden Sniper Indicator fornece alertas oportunos e setas visuais de sin
Fractals true extremums is a modification of the Fractals indicator. The indicator sorts out weak fractals leaving only the ones that are significant for searching the chart extreme points. The sorting is performed during fractals construction. The old data does not change. Only the last value can change (just like in the standard Fractals indicator). The indicator can show lines indicating Fractals from higher timeframes. The product can be used by EAs for comparing price extreme points on char
Indicator and Expert Adviser  EA Available in the comments section of this product. Download with Indicator must have indicator installed for EA to work. Mt5 indicator alerts for bollinger band and envelope extremes occurring at the same time. Buy signal alerts occur when A bullish candle has formed below both the lower bollinger band and the lower envelope  Bar must open and close below both these indicators. Sell signal occur when A bear bar is formed above the upper bollinger band and upper
Power Reserve MT5
Sergey Batudayev
3 (1)
Lógica de trabalho A importância deste indicador reside no fato de que ele permite que você entenda quanto “ainda resta combustível no instrumento”. Imagine a situação, você saiu de um carro com a bateria meio descarregada, em média, essa quantidade de energia costuma ser suficiente para um carro por 250 km, então se você quiser não pode ultrapassar uma distância de 700 km. Assim, para cada instrumento, existe um certo movimento diário de preço e, como resultado de observações estatísticas, foi
This indicator is based on a classic Moving Average indicator. Moving averages help us to first define the trend and second, to recognize changes in the trend. Multi TimeFrame indicator MTF-MA shows MA data from the 4 timeframes by your choice. By default this indicator has external parameters: TF1 = 1; TimeFrame2b = true; TF2 = 5; TimeFrame3b = true; TF3 = 15; TimeFrame4b = true; TF4 = 60; InpPSARStep = 0.02; InpPSARMaximum = 0.2; You can change TF1-TF4 in the next limits: TF1 from M1 (1) to H4
The indicator is similar to https://www.mql5.com/en/market/product/12330 . However, it considers the MQL5 platform features. Peaks and bottoms are calculated based solely on external bars. After a swing is formed, the indicator does not redraw providing opportunities for traders working on horizontal level breakthroughs. Traffic can be reduced by changing the amount of calculated bars in the MinBars variable (default value is 500). All you need is to select the output options, so that you can se
Features All Ichimoku Signals (Selectable) : Display all reliable signals generated by the Ichimoku indicator. You can choose which signals to view based on your preferences. Filter by Signal Strength : Sort signals by their strength—whether they are weak, neutral, or strong. Live Notifications : Receive real-time notifications for Ichimoku signals. Transparent Cloud : Visualize the Ichimoku cloud in a transparent manner. Available Signals Tenkensen-Kijunsen Cross Price-Kijunsen Cross Price-C
Necessary for traders: tools and indicators Waves automatically calculate indicators, channel trend trading Perfect trend-wave automatic calculation channel calculation , MT4 Perfect trend-wave automatic calculation channel calculation , MT5 Local Trading copying Easy And Fast Copy , MT4 Easy And Fast Copy , MT5 Local Trading copying For DEMO Easy And Fast Copy , MT4 DEMO Easy And Fast Copy , MT5 DEMO Bandas de Bollinger Avançadas: 1. O trilho Bollinger mudará de cor com a direção " 2. A expa
FREE
Golden Spikes Detector
Batsirayi L Marango
3.25 (4)
Golden Spikes Detector Este indicador é baseado em uma estratégia avançada principalmente para picos de negociação nos índices Boom e Crash. Algoritmos complexos foram implementados para detectar apenas entradas de alta probabilidade. Ele alerta sobre possíveis entradas de compra e venda. Para negociar picos na corretora Deriv ou Binária, receba apenas os alertas Buy Boom e Sell Cash. Ele foi otimizado para ser carregado em um período de 5 minutos, embora a análise de vários períodos de tempo se
Trend Levels Indicator Elevate your trading strategy with the Trend Levels Indicator , a sophisticated tool designed to detect market trends and highlight critical price levels. This cutting-edge indicator is packed with features to simplify trend analysis and empower your decision-making process. Key Features: Dynamic Trend Levels : Accurately plots high, mid, and low levels based on market dynamics. Custom Alerts & Notifications : Get real-time alerts and notifications when trends change, ensu
The ADX indicator (average directional index) is a technical tool designed to measure the strength of a market trend. The ADX indicator is used for various purposes such as measuring the strength of a trend, finding a trend and a trading range, and as a filter for various Forex trading strategies. Some of the best trading strategies are based on following the market trend. There are also strategies through which traders make profit by trading against the trend. In any case, if you can identify
The indicator builds a graphical analysis based on the Fibonacci theory. Fibo Fan is used for the analysis of the impulses and corrections of the movement. Reversal lines (2 lines at the base of the Fibonacci fan) are used to analyze the direction of movements. The indicator displays the of 4 the target line in each direction. The indicator takes into account market volatility. If the price is above the reversal lines, it makes sense to consider buying, if lower, then selling. You can open posi
Os compradores deste produto também adquirem
Trend Screener Pro MT5
STE S.S.COMPANY
4.88 (68)
Desbloqueie o poder da negociação de tendências com o indicador Trend Screener: sua solução definitiva de negociação de tendências, alimentada por lógica difusa e sistema de múltiplas moedas! Eleve sua negociação de tendências com o Trend Screener, o revolucionário indicador de tendências alimentado por lógica difusa. É um poderoso indicador de acompanhamento de tendências que combina mais de 13 ferramentas e recursos premium e 3 estratégias de negociação, tornando-o uma escolha versátil para to
TPSproTREND PrO MT5
Roman Podpora
4.54 (13)
TPSpro TREND PRO  - is a trend indicator that automatically analyzes the market and provides information about the trend and each of its changes, as well as giving signals for entering trades without redrawing! The indicator uses each candle, analyzing them separately. referring to different impulses - up or down impulse. Exact entry points into transactions for currencies, crypto, metals, stocks, indices!  ИНСТРУКЦИЯ RUS         INSTRUCTIONS  ENG       R ecommended to use with an indicator   -
Quantum TrendPulse
Bogdan Ion Puscasu
5 (6)
Apresentando   Quantum TrendPulse   , a ferramenta de negociação definitiva que combina o poder do   SuperTrend   ,   RSI   e   Stochastic   em um indicador abrangente para maximizar seu potencial de negociação. Projetado para traders que buscam precisão e eficiência, este indicador ajuda você a identificar tendências de mercado, mudanças de momentum e pontos de entrada e saída ideais com confiança. Principais características: Integração SuperTrend:   siga facilmente a tendência predominante do
TPSpro RFI Levels MT5
Roman Podpora
4.67 (15)
INSTRUÇÕES         Russo   -        ENG       R   ecomendado para uso com um indicador       -       TPSpro   TREND PRO -   Versão MT4         Um elemento-chave na negociação são as zonas ou níveis a partir dos quais as decisões de comprar ou vender um instrumento de negociação são tomadas. Apesar das tentativas dos principais participantes de esconder sua presença no mercado, eles inevitavelmente deixam rastros. Nossa tarefa era aprender como identificar esses rastros e interpretá-los corretame
Primeiramente, vale ressaltar que este Sistema de Trading é um Indicador Não Repintado, Não Redesenho e Não Atrasado, o que o torna ideal tanto para o trading manual quanto para o automatizado. Curso online, manual e download de predefinições. O "Sistema de Trading Inteligente MT5" é uma solução completa de trading projetada para traders novos e experientes. Ele combina mais de 10 indicadores premium e apresenta mais de 7 estratégias de trading robustas, tornando-o uma escolha versátil para dive
Golden Trend Indicator MT5
Noha Mohamed Fathy Younes Badr
4.85 (13)
Golden Trend indicator  is The best indicator for predicting trend movement this indicator never lags and never repaints and never back paints    and give  arrow buy and sell    before the candle appear  and it will help you and  will make your trading decisions clearer its work on all currencies and  gold and crypto and all time frame This unique  indicator uses very secret algorithms to catch the  trends, so you can trade using this indicator and see the trend clear on charts  manual guide and
FX Volume MT5
Daniel Stein
4.93 (14)
FX Volume: Experimente a Verdadeira Perspectiva de Mercado de um Corretor 1. Por que o FX Volume é Extremamente Benéfico para os Traders Sinais Antecipados com Precisão Incomparável • Receba informações quase instantâneas sobre quantos traders estão comprando ou vendendo um par de moedas — muito antes de relatórios atrasados como o COT estarem disponíveis. • FX Volume é a única ferramenta que obtém esses dados reais de vários corretores de varejo e os apresenta de forma concisa. Gestão de Ris
O Support And Resistance Screener está em um indicador de nível para MetaTrader que fornece várias ferramentas dentro de um indicador. As ferramentas disponíveis são: 1. Screener de estrutura de mercado. 2. Zona de retração de alta. 3. Zona de retração de baixa. 4. Pontos de Pivô Diários 5. Pontos Pivot semanais 6. Pontos Pivot mensais 7. Forte suporte e resistência com base no padrão harmônico e volume. 8. Zonas de nível de banco. OFERTA POR TEMPO LIMITADO: O indicador de suporte e resistência
Antes de tudo, vale ressaltar que esta Ferramenta de Negociação é um Indicador Não Repintante, Não Redesenhante e Não Atrasado, o que a torna ideal para negociação profissional. Curso online, manual do utilizador e demonstração. O Indicador de Conceitos de Ação de Preço Inteligente é uma ferramenta muito poderosa tanto para traders novos quanto experientes. Ele combina mais de 20 indicadores úteis em um único, combinando ideias avançadas de negociação como Análise do Trader do Círculo Interno
Este é um indicador para MT5 que fornece sinais precisos para entrar em uma negociação sem redesenhar. Ele pode ser aplicado a qualquer ativo financeiro: forex, criptomoedas, metais, ações, índices. Ele fornecerá estimativas bastante precisas e informará quando é melhor abrir e fechar um negócio. Assista o vídeo (6:22) com um exemplo de processamento de apenas um sinal que compensou o indicador! A maioria dos traders melhora seus resultados de negociação durante a primeira semana de negociação c
Gold Stuff mt5
Vasiliy Strukov
4.92 (173)
Gold Stuff mt5-um indicador de tendência projetado especificamente para o ouro, também pode ser usado em qualquer instrumento financeiro. O indicador não é redesenhado ou atrasado. O timeframe recomendado é H1. Importante! Entre em contato comigo imediatamente após a compra para obter instruções e bônus!  Você pode obter uma cópia gratuita do nosso indicador Strong Support e Trend Scanner, envie uma mensagem privada. a mim! PARÂMETRO Draw Arrow-incl.desligado. desenhar setas no gráfico. Aler
Gold Trend 5
Sergei Linskii
5 (1)
Tendência do ouro - este é um bom indicador técnico de acções. O algoritmo do indicador analisa o movimento do preço de um ativo e reflecte a volatilidade e as potenciais zonas de entrada. Os melhores sinais do indicador: - Para VENDER = histograma vermelho + ponteiro SHORT vermelho + seta de sinal amarelo na mesma direção. - Para COMPRAR = histograma azul + ponteiro LONGO azul + seta de sinal aqua na mesma direção. Vantagens do indicador: 1. O indicador produz sinais com elevada precisão
IX Power MT5
Daniel Stein
4.17 (6)
Apresentamos o IX Power - a ferramenta definitiva para aumentar a sua precisão de negociação! Concebido com a mesma precisão imbatível do FX Power, o IX Power permite-lhe dominar qualquer símbolo de negociação, desde índices e acções a mercadorias, ETFs e até criptomoedas. Prepare-se para elevar a sua negociação com informações precisas sobre tendências de curto, médio e longo prazo em todos os seus activos favoritos. Porquê escolher a IX Power? Com o IX Power, seu tempo se torna nítido, ajuda
Agora US $ 147 (aumentando para US $ 499 após algumas atualizações) - Contas ilimitadas (PCs ou Macs) Manual do usuário do RelicusRoad + vídeos de treinamento + acesso ao grupo de discórdia privado + status VIP UMA NOVA FORMA DE OLHAR PARA O MERCADO O RelicusRoad é o indicador de negociação mais poderoso do mundo para forex, futuros, criptomoedas, ações e índices, oferecendo aos traders todas as informações e ferramentas necessárias para se manterem rentáveis. Fornecemos análises técnicas e
Descubra os níveis de FX: O seu melhor indicador de suporte e resistência para o sucesso da negociação O FX Levels é mais do que apenas um indicador de suporte e resistência; é um divisor de águas para traders sérios que desejam precisão, confiabilidade e funcionalidade contínua em todos os símbolos de negociação - sejam pares de moedas, índices, ações ou commodities. Construído com base no comprovado método Lighthouse e aprimorado com adaptabilidade dinâmica e em tempo real, o FX Levels traz p
FX Power MT5 NG
Daniel Stein
5 (7)
Desbloquear todo o poder do FX Power NG: o derradeiro medidor de força da moeda Durante mais de oito anos, o FX Power capacitou os operadores de todo o mundo com uma análise fiável e precisa da força da moeda. Agora, o FX Power NG leva esta ferramenta de confiança para o próximo nível, oferecendo funcionalidades avançadas que proporcionam uma precisão, personalização e conhecimentos inigualáveis à sua negociação. O que faz do FX Power NG uma ferramenta indispensável para os operadores sérios?
Atomic Analyst MT5
Issam Kassas
4.32 (19)
Primeiramente, vale ressaltar que este Indicador de Negociação não repinta, não redesenha e não apresenta atrasos, tornando-o ideal tanto para negociação manual quanto automatizada. Manual do utilizador: configurações, entradas e estratégia. O Analista Atômico é um Indicador de Ação de Preço PA que utiliza a força e o momentum do preço para encontrar uma vantagem melhor no mercado. Equipado com filtros avançados que ajudam a remover ruídos e sinais falsos, e aumentam o potencial de negociação.
The latest version of Indicator is fully integrated into an all-in-one package, including: Fair Value Gaps (FVG). See more =>  How to trade with FVG Implied Fair Value Gap (IFVG). See more =>   How to trade with IFVG OrderBlock (OB). See more =>   How to trade with OrderBlock The options in the settings section are relatively easy to navigate, and you can even use them right away upon activation without encountering difficulties when using the default configuration. The indicator utilizes an alg
Trend Forecaster
Alexey Minkov
5 (6)
!SPECIAL SALE!  The Trend Forecaster indicator utilizes a unique proprietary algorithm to determine entry points for a breakout trading strategy. The indicator identifies price clusters, analyzes price movement near levels, and provides a signal when the price breaks through a level. The Trend Forecaster indicator is suitable for all financial assets, including currencies (Forex), metals, stocks, indices, and cryptocurrencies. You can also adjust the indicator to work on any time frames, althoug
Atbot
Zaha Feiz
4.76 (45)
AtBot: Como funciona e como usá-lo ### Como funciona O indicador "AtBot" para a plataforma MT5 gera sinais de compra e venda usando uma combinação de ferramentas de análise técnica. Ele integra a Média Móvel Simples (SMA), a Média Móvel Exponencial (EMA) e o índice de Faixa Verdadeira Média (ATR) para identificar oportunidades de negociação. Além disso, pode utilizar velas Heikin Ashi para melhorar a precisão dos sinais. Deixe uma avaliação após a compra e receba um presente especial. ### Princ
FX Dynamic - O único indicador ATR de que você sempre precisará Pronto para turbinar suas estratégias de negociação com precisão e perceção incomparáveis? Conheça o FX Dynamic , o primeiro e único indicador ATR projetado para análise baseada em moeda e o ajuste automático para mudanças de GMT dos corretores . Diga adeus às ferramentas ultrapassadas e abrace a solução definitiva para dominar a volatilidade do mercado. Por que o FX Dynamic é um divisor de águas Análise ATR baseada em moeda - Li
Auto Order Block with break of structure based on ICT and Smart Money Concepts (SMC) Futures Break of Structure ( BoS )             Order block ( OB )            Higher time frame Order block / Point of Interest ( POI )    shown on current chart           Fair value Gap ( FVG ) / Imbalance   -  MTF      ( Multi Time Frame )    HH/LL/HL/LH  -  MTF      ( Multi Time Frame )  Choch  MTF      ( Multi Time Frame )  Volume Imbalance     ,  MTF          vIMB Gap’s Power of 3 Equal High / Low’s  
-   Real price is 80$   - 25% Discount ( It is 59$ now ) Contact me for instruction, any questions! Related Product:  Gold Trade Expert MT5 Non-repaint Introduction The breakout and retest strategy is traded support and resistance levels. it involves price breaking through a previous level.  The break and retest strategy is designed to help traders do two main things, the first is to avoid false breakouts. Many false breakouts start with a candlestick that breaks out of a level but ends with an
Seconds Charts
Aleksandr Goryachev
Micro  ******************* Секундные графики MT5 ********************** Более точного инструмента для входа в сделку вы не найдёте. Входные параметры: Timeframe, sek - период построения графика, секунды Displayed bars - отображаемые бары Step of price levels, pp, 0-off - шаг отрисовки ценовых уровней, пункты Scale points per bar, 0-off - масштаб в пунктах на бар Show lines - отображение текущих уровней Show comment - отображение комментария Standard color scheme - стандартная цветовая сх
FxaccurateLS
Shiv Raj Kumawat
WHY IS OUR FXACCCURATE LS MT5 THE PROFITABLE ? PROTECT YOUR CAPITAL WITH RISK MANAGEMENT Gives entry, stop and target levels from time to time. It finds Trading opportunities by analyzing what the price is doing during established trends. POWERFUL INDICATOR FOR A RELIABLE STRATEGIES We have made these indicators with a lot of years of hard work. It is made at a very advanced level. Established trends provide dozens of trading opportunities, but most trend indicators completely ignore them! The
Este painel mostra os últimos   padrões harmónicos   disponíveis para os símbolos seleccionados, pelo que poupará tempo e será mais eficiente /   versão MT4 . Indicador gratuito:   Basic Harmonic Pattern Colunas do indicador Symbol :   aparecem os símbolos seleccionados Trend :   de alta ou de baixa Pattern :   tipo de padrão (gartley, borboleta, morcego, caranguejo, tubarão, cifra ou ABCD) Entry :   preço de entrada SL:   preço de paragem de perda TP1:   preço do 1º take profit TP2:   preço
Matrix Arrow Indicator MT5
Juvenille Emperor Limited
5 (13)
O   Matrix Arrow Indicator MT5   é uma tendência única 10 em 1 seguindo um indicador multi-timeframe   100% sem repintura   que pode ser usado em todos os símbolos/instrumentos:   forex ,   commodities ,   criptomoedas ,   índices ,   ações .  O  Matrix Arrow Indicator MT5  determinará a tendência atual em seus estágios iniciais, reunindo informações e dados de até 10 indicadores padrão, que são: Índice de movimento direcional médio (ADX) Índice de canal de commodities (CCI) Velas clássicas de
Enjoy a   50% OFF   Christmas holiday sale!   After your purchase, feel free to contact me for more details on how to receive a bonus indicator called VFI, which pairs perfectly with Easy Breakout for enhanced confluence!     Easy Breakout MT5   is a powerful price action trading system built on one of the most popular and widely trusted strategies among traders: the   Breakout strategy ! This indicator delivers crystal-clear Buy and Sell signals based on breakouts from key support and resis
Claro, aqui está a tradução para o português: Apresentando o Indicador de Astronomia para   MT4 / MT5 : Seu Companheiro Celestial Definitivo no Trading Você está pronto para elevar sua experiência de trading a alturas celestiais? Não procure mais do que o nosso revolucionário Indicador de Astronomia para MT4. Essa ferramenta inovadora transcende os indicadores de trading tradicionais, aproveitando o poder de algoritmos complexos para fornecer insights astronômicos incomparáveis e cálculos de pre
Suleiman Levels
Suleiman Alhawamdah
5 (1)
Com base em inúmeros pedidos para uma promoção, estarei reduzindo o preço do indicador em 50% por 10 dias, começando em 05/01/2025 até 15/01/2025. O preço atual do indicador é $110, e com o desconto será $55. Sejam todos bem-vindos! Por favor, leia a explicação com atenção e entenda que o indicador foi projetado para analisar, compreender e estudar o gráfico. A decisão de abrir uma negociação é inteiramente sua. Desejo boa sorte a todos! Nota: Você pode testar uma versão limitada do indicador
Mais do autor
Trading Chaos Expert
Gennadiy Stanilevych
5 (10)
Não existe software igual no mundo e que represente um "console" universal de negociação informando sinais para operar, entrada automatizada do mercado, configurando o Stop Loss e o Take Profit, assim como o Trailling Profit para diversas negociações em apenas uma janela aberta. O controle intuitivo do Expert Advisor em "três cliques" garante um uso abrangente de todas as suas funções em diferentes computadores, incluindo tablets. Interagindo com indicadores de sinal adicionais que marcam o gráf
Trading Chaos Chart
Gennadiy Stanilevych
5 (1)
O principal objetivo do indicador é detectar e marcar no gráfico os seguintes sinais de negociação descritos em "Trading Chaos (2-nd edition)": Divergência nas barras de alta e baixa com angulação (incluindo o squat). Barras nas zonas em vermelho e verde de acordo com a cor do histograma Awesome Oscillator. Barras Squat no gráfico são independente da cor do histograma Awesome Oscillator. Níveis de fractais "importantes" em relação à "linha dos Dentes" do indicador Alligator. Desenha raios de ang
Short term extremum
Gennadiy Stanilevych
5 (1)
The indicator determines and marks the short-term lows and highs of the market on the chart according to Larry Williams` book "Long-term secrets to short-term trading". "Any time there is a daily low with higher lows on both sides of it, that low will be a short-term low. We know this because a study of market action will show that prices descended in the low day, then failed to make a new low, and thus turned up, marking that ultimate low as a short-term point. A short-term market high is just
Modified Awesome Oscillator
Gennadiy Stanilevych
5 (2)
O principal objetivo do indicador é detectar e marcar sinais de negociação no histograma do Awesome Oscillator de acordo com as estratégias de "Trading Chaos, second edition" e "New Trading Dimensions". O indicador detecta e marca os seguintes sinais de negociação: "Two peaks" (dois topos) - divergência. O sinal do "Second wise-man" (Segundo homem sábio) - terceiro barra consequente do indicador Awesome Oscillator após a sua cor ter sido alterada. O histograma cruza a linha zero. O sinal "Saucer
Alligator modified
Gennadiy Stanilevych
5 (4)
The MT5 platform indicator has standard settings and requires no modifications when connected to the chart. Modifying the indicator involves adding two functions: Marking the area when the indicator lines are in the correct sequence (green line above or below red and blue lines, and red above or below blue). This creates a confirmed cross marked by the closing price to avoid false signals during the Alligator lines' entanglement periods. Drawing horizontal rays from market structure break levels
Recognizer 1 2 3 Patterns
Gennadiy Stanilevych
5 (2)
tO indicador é destinado ao reconhecimento e marcação dos padrões 1-2-3 comprar e vende de um gráfico. O indicador vai ajudar um negócio para determinar o início e o sinal de fractais, e especificar os possíveis pontos de entrada em todos os tempos do МetaTrader 5. Linhas de Fibonacci são desenhados no gráfico para indicar supostos alvos de movimento sobre a base da teoria ondulatória. As formações 1-2-3 parecem ser especialmente importante como as divergências (convergências) são formados em to
Auto Format
Gennadiy Stanilevych
Este é um utilitário para o dimensionar automaticamente o gráfico com menos de 140 barras visíveis. Isso é necessário para uma análise correta de ondas de acordo com a estratégia "Negociação do Caos"de Bill Williams. O utilitário pode ser usado em qualquer período de tempo disponível no МetaТrader 5. Ele desenha uma linha vertical através da primeira barra iniciando o cálculo. Esta linha permite que você veja o ponto provável de partida da sequência da onda, juntamente com um número suficiente d
Spread and Swap monitor
Gennadiy Stanilevych
5 (1)
O indicador tem o objetivo de determinar o tamanho do spread e swap, a distância para configurar ordens pendentes, stop loss permitido com o preço atual e o risco por 1 ponto na moeda de depósito. O indicador informa ao trader sobre possíveis despesas e os lucros adicionais relacionados com a transferência de uma posição para a próxima sessão de negociação do instrumento financeiro. Ele também informa sobre o tamanho do spread, a distância das ordens pendentes, stop loss e o trailing stop a part
O principal objetivo do indicador é determinar e marcar sinais de negociação no histograma do Accelerator Oscillator, que foram descritos por Bill Williams em seu livro "New Trading Dimensions". A lista de sinais: O sinal de compra quando o histograma do indicador está abaixo da linha zero. O sinal de venda quando o histograma do indicador está abaixo da linha zero. O sinal de venda quando o histograma do indicador está acima da linha de zero. O sinal de compra quando o histograma do indicador e
Slider
Gennadiy Stanilevych
This is a utility created to ease charts watching on tablet PCs. The indicator allows you automatically alternately display "slide show" of all currency charts from "MarketWatch". The user can set the display time interval (in seconds) between charts in indicator settings. In addition, there is an option of selecting the angle of Start/Stop button which starts and stops the display of charts. This function is very useful if a trader noticed a trading signal and would like to study it in more det
Slider profy
Gennadiy Stanilevych
The idea of ​​enhancing the free Slider utility appeared after the release of a lite version of the EA trade panel Trading Chaos Expert Lite , which operates in the Current Chart mode without the possibility to maintain trades of several symbols in a single window. The purpose of Slider profy Ease search for trading signals by automatic display of charts of currency pairs from the "Market Watch" one by one at a specified interval of time in seconds. Automation of one-click placing of pending ord
Stairway
Gennadiy Stanilevych
The multi-timeframe indicator of the levels of the Pivot Points. Every closed daily period has its own so-called reference point - Pivot Point, which sets the levels for smaller intraday timeframes for the following day. The Pivot Points indicators existing in the codes have no method of showing the dynamics of the pivot point changes on the historical data of the price chart. Pivot Point calculation formula. Pivot=(High + Low + Close) /3 High — the maximum of the previous day; Low — the minimum
The standard Bollinger Bands indicator has been improved by integrating additional indications from the Standard Deviation indicator (StdDev), which gives an additional filter for confirming trading signals. In addition, the color of the indicator's lines shows the beginning of a trend, its development and exhaustion. This indicator has a signal block that notifies the trader of the beginning of the trend on any time frame to which it is attached. Settings Type of messages - select the type of
Fifth dimension
Gennadiy Stanilevych
5 (1)
The indicator looks for the "Fifth dimension" trade signals and marks them on the chart. A detailed description of the chart patterns that generate the trade signals can be found in Chapter 8 "The Balance Line Trades" in the book Williams' "New Trading Dimensions". Signal levels with indication of the position entry or stop loss placement price are indicated directly on the chart. This feature creates additional convenience for the trader when placing pending orders. A solid horizontal line is d
Stop close only
Gennadiy Stanilevych
The script in the form of an expert is created for the possibility of automatic installation of pending orders of the Stop Close Only type, which are not in MT5 by default. This type of order implies entering a long position in case the price closes above a given price level and opening a short position if the price closes below the price set by the trader. At the same time, level breakouts are not taken into account. The expert indicates the levels on the chart with lines, overcoming which will
Lifebuoy
Gennadiy Stanilevych
The script analyzes all trading instruments listed in the Market Watch of the MT5 platform to assess their suitability for trading on the timeframes specified in the settings. Based on the analysis, the script displays a table, where trading instruments deemed suitable and recommended for trading are marked in green, based on their compliance with the risk-to-reward ratio coefficient, including the spread (default 1:3). Instruments not recommended for trading are marked in red.
Iranger
Gennadiy Stanilevych
Description The indicator based on Average True Range (ATR) is designed to accurately determine the possible range of price fluctuations on a selected timeframe. This tool is ideal for both beginner traders and experienced professionals looking to effectively plan their trades. Key Features: Displays possible price fluctuation levels on the chart, simplifying visual analysis. Utilizes the power of the ATR algorithm to calculate precise volatility values. Adapts to any timeframe, providing releva
Filtro:
Sem comentários
Responder ao comentário
Versão 7.1 2023.02.08
The value and, accordingly, the price of the indicator increased. In the updated version, the indicator allows you to recognize fractal levels, the breakdown of which led to a change in the direction of the trend, and the built-in filter distinguishes the removal of liquidity from the real breakdown of the market structure.
Versão 6.961 2022.01.31
Индикатор скомпилирован в новой версии редактора МТ5 по рекомендации администрации Mql5.
Versão 6.96 2021.07.16
Обновление связано с необходимостью синхронизации кода индикатора с новыми версиями программы МТ5.
Versão 6.90 2019.03.18
Индикатор оптимизирован для работы с 2009 версией терминала МТ5 и выше.
Versão 6.71 2018.02.02
Added a filter to the fractal breakout trade signal in the form of the histogram of the AO indicator moving through the zero line.
Versão 6.61 2017.08.23
Improvement of the indicator. Fractal breakout confirmed by a candle closure above the fractal level.
Versão 6.55 2017.03.14
Changed the algorithm of searching for the broken fractal levels, which are the basic levels of resistance or support for a trend movement in the analyzed timeframe.
Versão 6.39 2016.07.20
Additional reliable filter has been integrated into the indicator which helps to sort out false price impulse signals within a change of a trend.
Versão 6.27 2016.01.29
Improved search of the previous fractal breakdown levels which are considered as support or resistance levels after a trend change.
Versão 6.22 2015.08.28
Improved algorithm of determining the breakdown of a fractal which indicates a possible change of trend.
Versão 6.13 2015.05.26
Code optimization. Acceleration with graphic objects on the chart.
Versão 6.12 2015.04.24
Fixed search feature breakdowns of fractals, relative to the red line of the Alligator indicator.
Versão 6.11 2015.04.20
Optimization.
Versão 6.2 2015.04.10
Optimization.