Smart Market Scanner and Dashboard
- Indicadores
- Elmira Memish
- Versão: 1.0
- Ativações: 5
Smart Market Scanner and Dashboard
The trend is very important when trading a financial instrument.
The trend can be identified by checking various of structures and indicators.
Trend shifts can be identified by trendline breakouts and horizontal support/resistance levels.
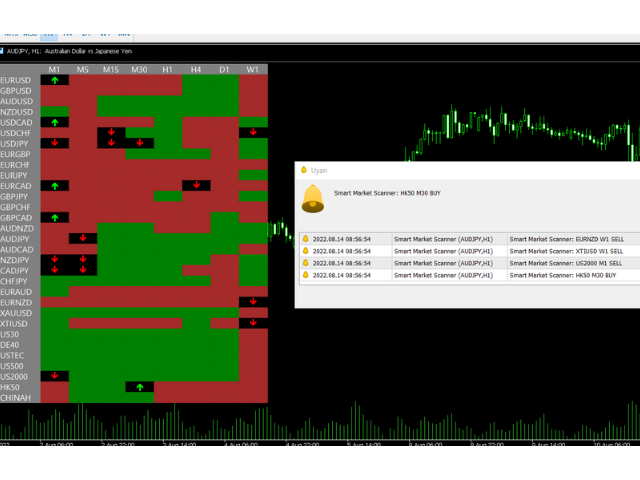
Scanner will scan the selected symbols and show you the direction/trend on selected timeframes.
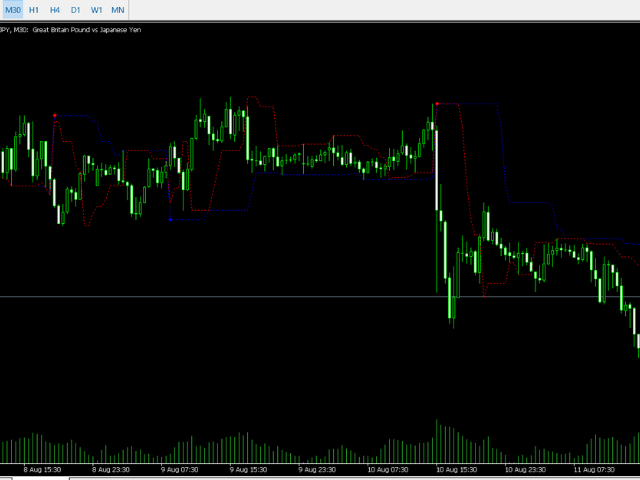
Algo is based on: Price Cycles, Fractals, Order Blocks, Hi-Lo
Advantages:
- Multi timeframe
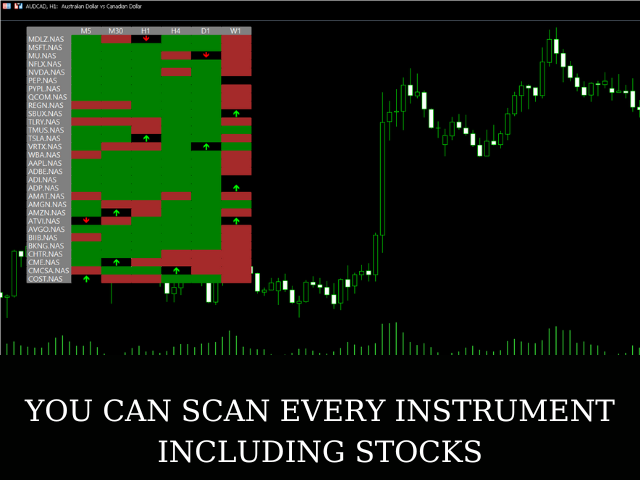
- Multi instruments including Currencies, Commodities ( Incl. Gold and Oil ), Indices, Cryptocurrencies, Stocks and ETFs.
- No Repaint
Inputs:
Use Market Watch: If "Enabled", all symbols in the market watch will be scanned and displayed.
If "Disabled", you need to enter the name of the symbols manually.
Symbols: Leave a blank between the symbols
Time Frames: Leave a blank between the timeframes.
Template to Apply: Write your template name which will be displayed on the chart that will be opened when you click on the cell. If you leave it empty,
empty chart will be opened.
Apply Indicator: If you "enable", when "template to apply" is empty, chart with the indicator will be opened.
Look Back, Bars: Number of the bars the buy/sell arrows will keep displaying on the chart after the signal. In other words, after the selected no. of bars, buy/sell arrow
will not be displayed on the cell but you will be able to see the direction / trend of the price. ( Color of the empty cell will guide you)
On Closed Candle: If "Enabled", indicator will wait for the candle close confirmation. If "Disabled" instant alert will be displayed as soon as the price breaks the structure.
Time Update Rate ( Miliseconds): Every xxxx miliseconds, scanner will re-scan the market.
Fast Lenght, Slow Lenght: Default is 7,16. For shorter trends it can be set to 3,7. For Major Trends it can be set 20,34 or 36,61
Color Buy( Background) . Choose and apply the bullish trend color which you like to be displayed when there is no buy/sell arrow on the cell.
Color Sell(Background). Choose and apply the bearish trend color which you like to be displayed when there is no buy/sell arrow on the cell.
Please contact us if you need further assistance.


