Chaos Indicator
- Indicadores
- Stefano Frisetti
- Versão: 1.0
- Ativações: 10
DESCRIPTION
The CHAOS INDICATOR has been developed to be used for the TRADING STRATEGY OF CHAOS, as described in the book. The book is in italian language only and can be obtained only on my website indicated below.
DATAS COLLECTED AND SHOWN ON GRAPHS
The CHAOS INDICATOR apply easily to any graph and any asset, and it is a TRADING FACILITATOR, as it identify immediately the following items on any graph:
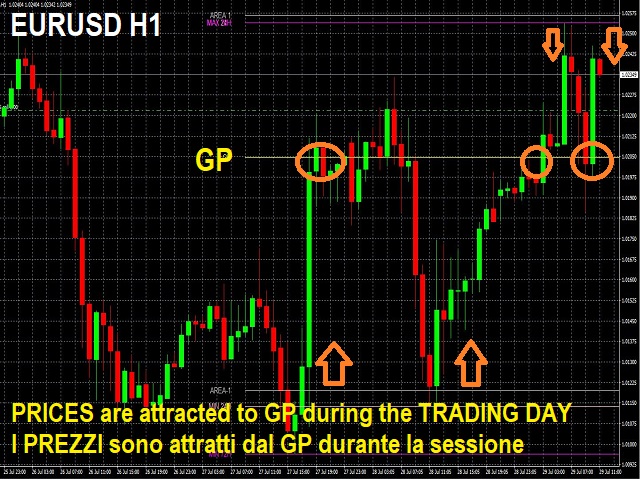
- The GP (= RIGHT PRICE) i.e. the price to which the asset should be attracted within 24 hours with a high statistic probability, as widely described in the above said book.
- Resistances areas such as 24 hours max price ; 72 hours max price and AREA1, a dynamic resistance found with proprietary calculation by the TRADING STRATEGY OF CHAOS.
- Supports areas such as 24 hours min price; 72 hours max price; and AREA-1, a dynamic support found with proprietary calculation by the TRADING STRATEGY OF CHAOS.
TRADING WITH CHAOS INDICATOR
The STRATEGY OF CHAOS high probability theory says that prices will be attracted by GP (=RIGHT PRICE) at least once within the day of trading.
Thus TRADING with THE CHAOS INDICATOR it is very easy as You can:
SELL when prices are above GP and slight above or close to RESISTANCES, and then wait for to reach GP to close TRADE.
BUY when prices are below GP and slight below or close to SUPPORTS, and then wato for price to reach again GP to close TRADE.
ADDITIONAL INFO
In order to learn and master trading with the CHAOS INDICATOR, You can access to extensive informations and several trading variants to use with indicators, by reading the book, currently available in italian language only, or following RECORDED OR LIVE TRADING SESSIONS, or getting in contact with developer.
My twitter: https://twitter.com/SFscalper
My YOUTUBE Channel: https://www.youtube.com/c/SFSCALPER

