Draw My Levels
- Utilitários
- Brian Derich
- Versão: 1.1
- Ativações: 5
If you like this product, please leave a 5 start review!
This script is fantastic! You need it. (note that it is a script, not an indicator)
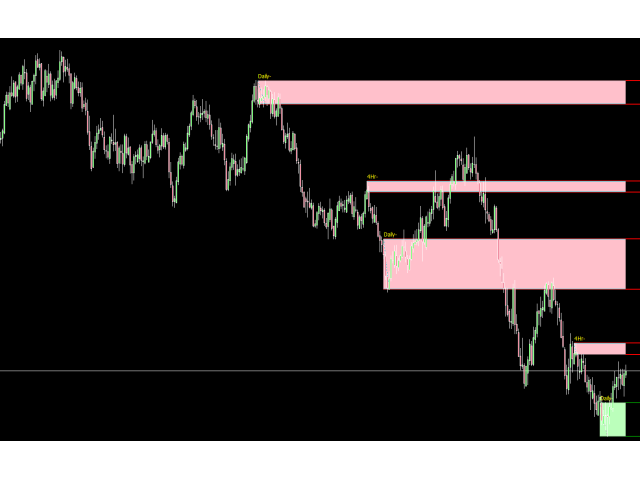
Drag and drop on the chart to mark your levels.
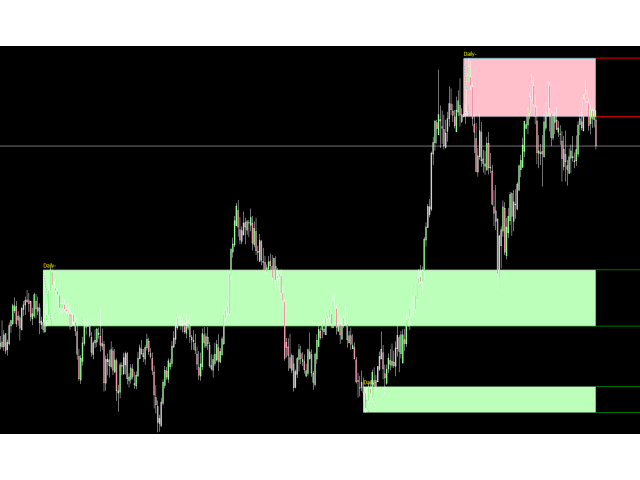
It adds two lines (top and bottom) for the level and then fills it in with color
Shows the timeframe of the chart that the level was drawn on.
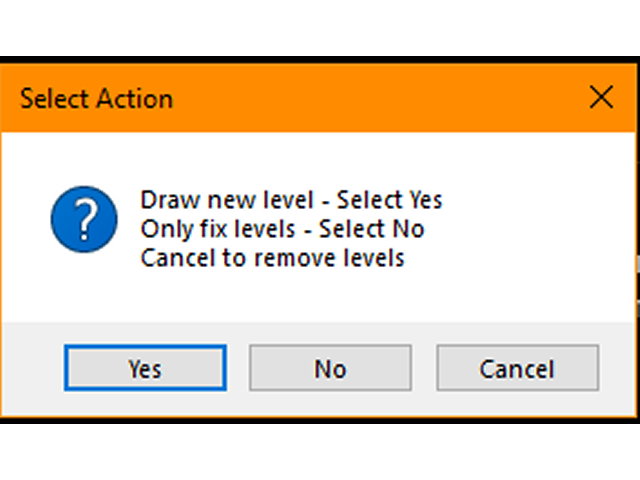
Each time you drop the script on the chart a message box pops up
- Press YES to draw the new level
- Press NO to redo the level drawings (in case you have moved the objects, it will realigns the color infill to the lines
- Press CANCEL to remove ALL level from the chart, and it will not remove other objects. It will only remove the level added by this script
When the level is drawn, the fill color will not update (this is on purpose). This tells you when you drew the level. To extend the fill to the current time, drag and drop the script onto the chart and select "No" (to automatically redraw the levels)
Pro tip: If you're looking at the daily chart and the level you draw is too wide, go to a lower timeframe such as a 4 hour and draw the level. Remember, the level is drawn using the candle you drop it on and the 3 previous candles. Try it! Pick the timeframe that suits best to draw the level.
Pro tip 2: If you need to adjust the levels, the upper and lower lines are actually the fib tool. Click on the top left of the object to select it, then move it as desired.
Put it in your favorites, even add a hot key to use it easily and effortlessly.
Once you find the levels to trade, use the Multi Anchored VWAP to help you understand if the buyers or sellers are in control. You can get it here https://www.mql5.com/en/market/product/82560
I also have a utility available to manually identify and moves stops, check it out, it is very helpful Click Here

































O usuário não deixou nenhum comentário para sua avaliação