SRL Edson Gould MT4
- Indicadores
- Grigorii Matsnev
- Versão: 1.0
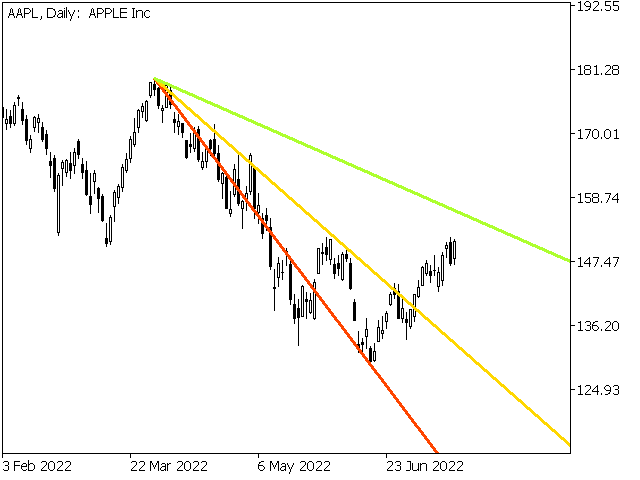
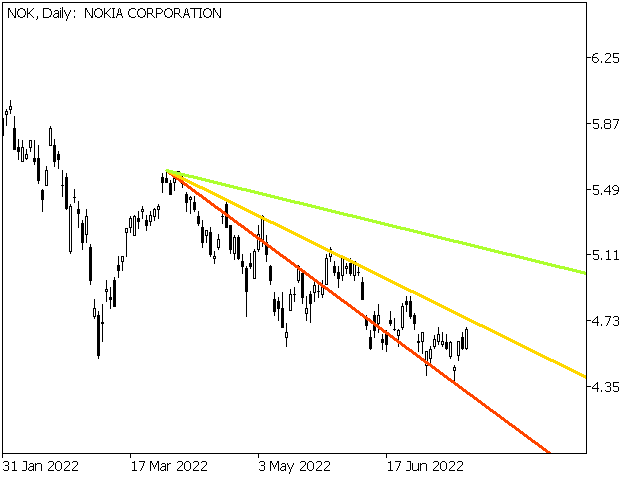
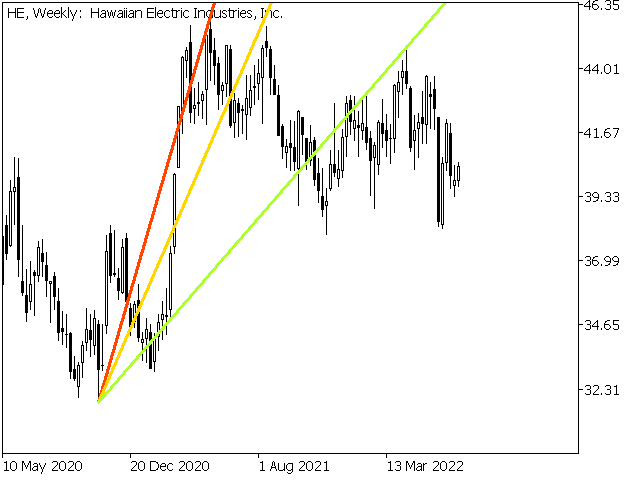
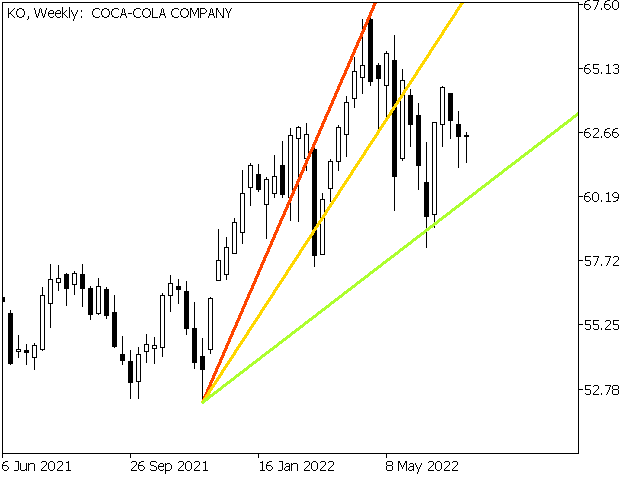
As linhas de resistência de velocidade são uma ferramenta poderosa para identificar linhas de tendência e resistência. O indicador traça linhas usando gráficos extremos e fórmulas matemáticas especiais. O indicador pode ser usado para determinar a direção da tendência e os pontos de reversão.
<---------------------------->
Parâmetros do indicador:
"Depth of search" - profundidade (em barras) da pesquisa de gráficos extremos
"Back step of search" - a distância mínima (em barras) entre os extremos
"Deviation of price" - a diferença de preço permitida entre extremos do mesmo tipo
"Line color" - a cor da linha com o índice correspondente
"Line style" - Estilo de linha com o índice correspondente
"Line width" - largura da linha com o índice correspondente
<---------------------------->
Você pode encontrar mais informações no livro "A Collection of Rare Writings by Edson Gould" ou entrando em contato comigo em Mensagens Privadas.
<---------------------------->
Agradeço antecipadamente a todos os interessados, boa sorte em conquistar o mercado!

Miglior indicatore al mondo,merita 100 stelle ed è gratuito