Correctness Complex Structure
- Indicadores
- Yvan Musatov
- Versão: 1.0
- Ativações: 5
The Correctness Complex Structure indicator displays the complex structure of the bar, taking into account tick volumes in digital terms. How to interpret the information provided by the indicator. It's very simple, it's enough to analyze the chart. We will explain the work using an example, take the EURUSD instrument on the D1 timeframe, install this indicator and analyze the information provided by the indicator. The indicator works in the bottom of the chart and gives the result in the form of a histogram, that is, each bar (when a bar appears on the zero bar) forms a digital value, a histogram column, by which we can analyze the correctness of the price chart presented on the chart. Let's start the analysis with an example.
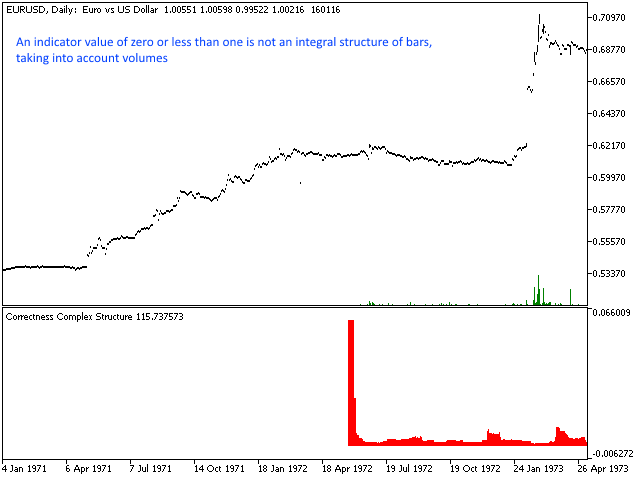
Consider picture #1. This is the beginning of the story for the EURUSD currency pair on the D1 timeframe. Here we see that the digital values given by the indicator in the form of a histogram at the beginning of the chart are zero, and in the second part of the chart it is greater than zero but much less than one. At the same time, on the price chart, we see (especially if you zoom in on the chart on your chart) poorly formed bars without a clear structure of the opening price, closing price and shadows, as well as volumes. Looking ahead, we can interpret these indicators as reflecting poorly formed bar bodies and tick volumes in the form of a low resulting value of this indicator. And with automated trading on such a history, it is better not to work at all, or switch to some other specific game strategy.
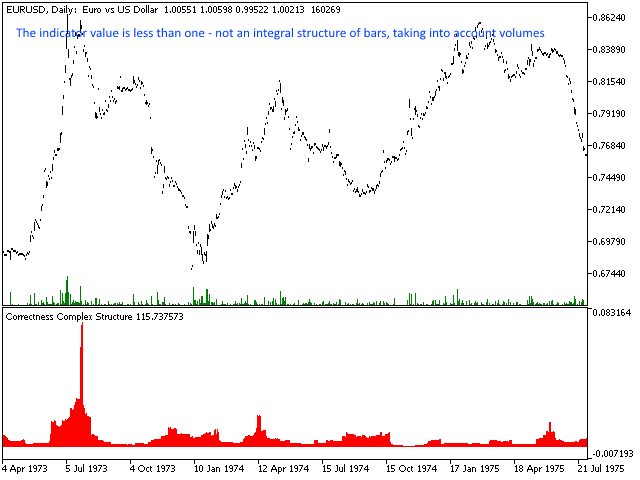
Consider picture #2. This screenshot immediately follows the previous one in history. Here you can see that the indicator indicator is changing, but still it is not more than one, at the same time the structure of the bars is not complete, as in the previous case.
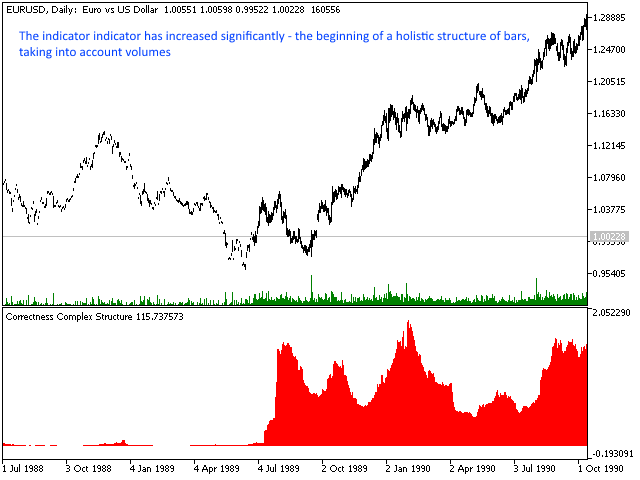
Consider picture #3. To do this, you need to scroll forward through history, because by now we will see a picture similar to the previous one (No. 1 and No. 2). In this screenshot, we see that in 1989 the indicators of the indicator changed dramatically and became higher than one, in some places the indicators were more than 2 (in comparison with the previous ones, it is significantly less than 1, indicative of 0.001-0.01). We also clearly see on the price chart that the structure of the bars has changed (if you zoom in, you can see it more clearly). Now, where the structure of the bars is more clearly expressed and correctly formed, there is a body of bars and shadows, as well as volumes, and the indicators of the indicator have also increased significantly. In this case, for automated systems, this will be a clear signal to change the trading strategy, or most often just start trading, and the entire history up to the present moment can simply be ignored due to its structural integrity. (The indicator has increased significantly - the beginning of a holistic structure of bars, taking into account volumes)
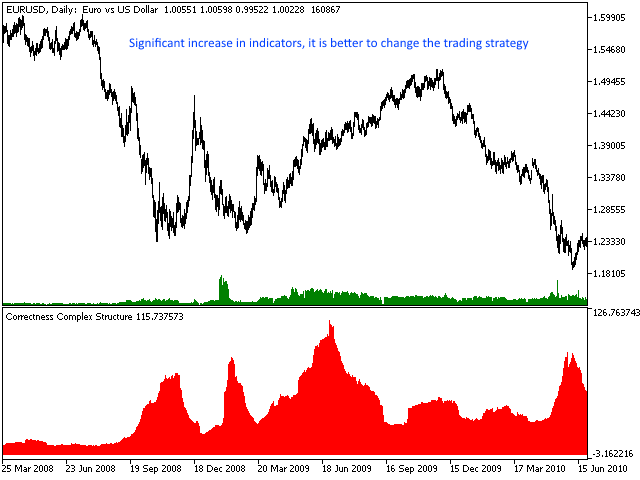
Consider picture number 4. To do this, you need to scroll forward through history, because by now we will see a picture similar to the previous one (No. 3). On this screenshot, we can see clearly defined changes where the indicator rises above 100, at the same time we see that the market was going through very significant changes in 2008 on EURUSD. In this case, you can change the rules of trade and adapt to the new state of affairs. (Significant increase in indicators, it is better to change the trading strategy)
The length indicator parameter is the number of the last bars to be analyzed (except for the zero bar). That is, the analysis of the last (length) formed bars is displayed on the zero bar, taking into account the volumes. This approach allows the indicator to provide clear indicators that do not change on the zero bar.
Conclusion. The indicator displays the structural integrity of the bars, taking into account volumes, as well as indirectly changing the behavior of price movements, from this we can conclude that using the readings of this indicator, you can switch approaches to trading or refrain from trading altogether. The indicator can be interpreted as a forecast indicator and used as a strategy switcher. Although it is possible to use the indicator for other trading purposes, it all depends on the creative thinking of the user.
