Technical Ruler
- Utilitários
- Kazusa Hase
- Versão: 2.0
- Ativações: 5
What is this indicator?
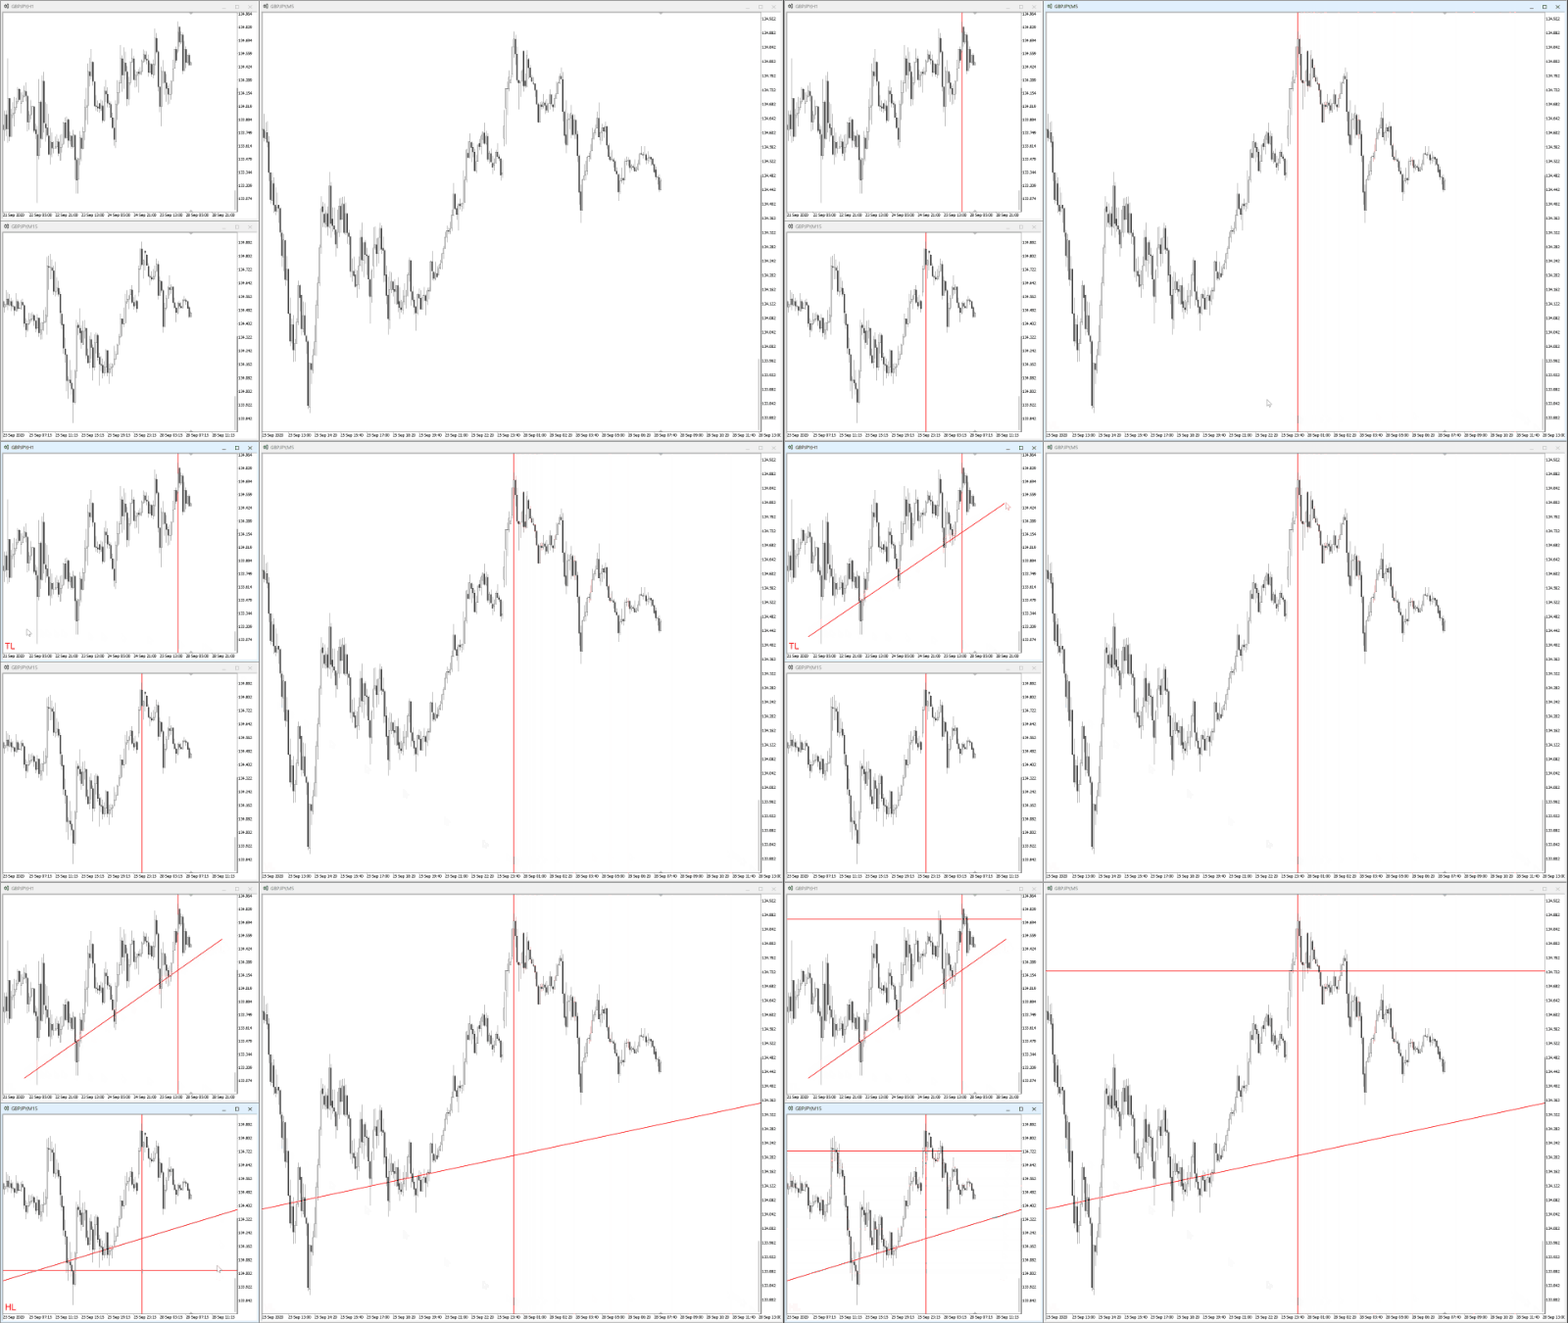
This indicator draws a customized vertical, horizontal, or trend line at any position on the chart.
To draw each line, press the hotkey and then click at any point on the chart.
Each drawn line is synchronized with other charts by timeframe. (Each chart requires this indicator to be installed)
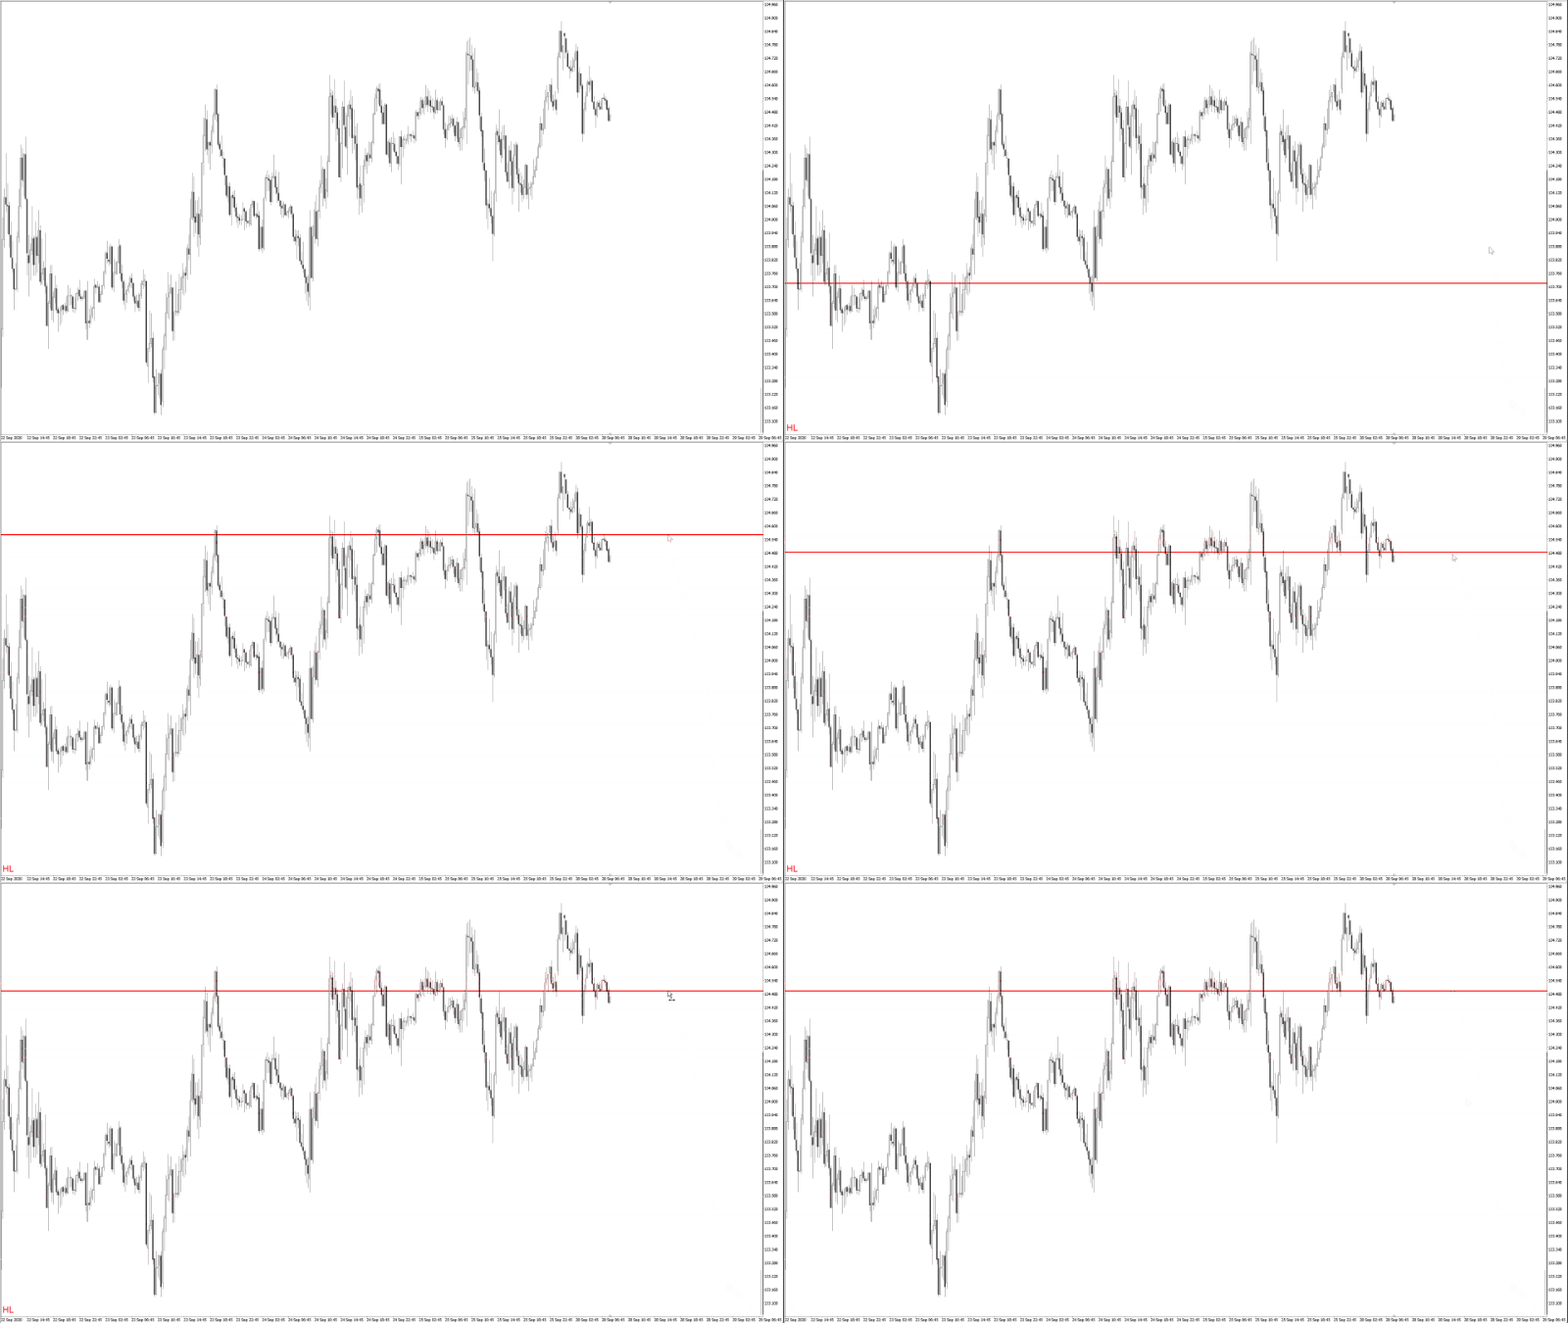
How to draw a vertical or horizontal line
1. Press the hotkey to enter drawing mode.
2. Move the mouse to any point.
3. Click to draw the line.
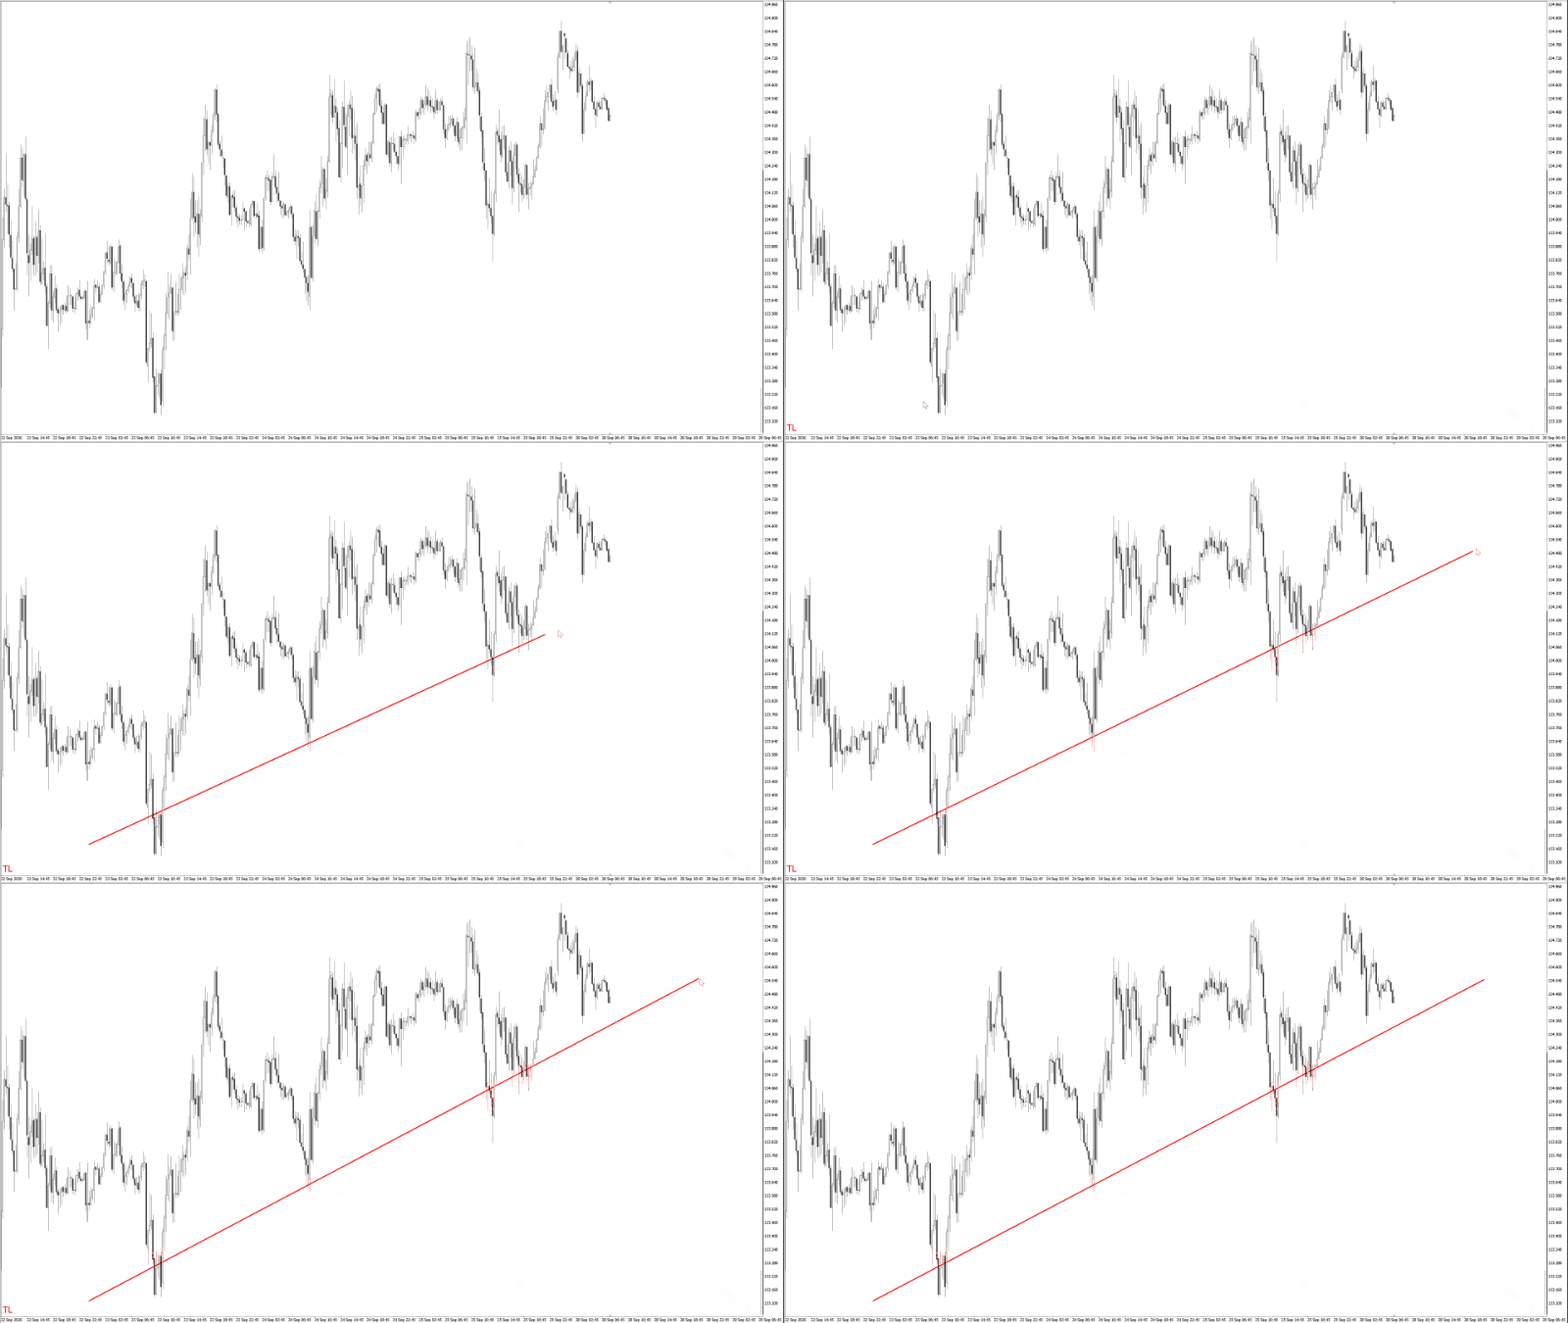
How to draw a trendline
1. Press the hotkey to enter drawing mode.
2. Click any point to decide the starting point.
3. Move the mouse to any point.
4. Adjust the starting point with the arrow keys if needed.
5. Click to draw the line.
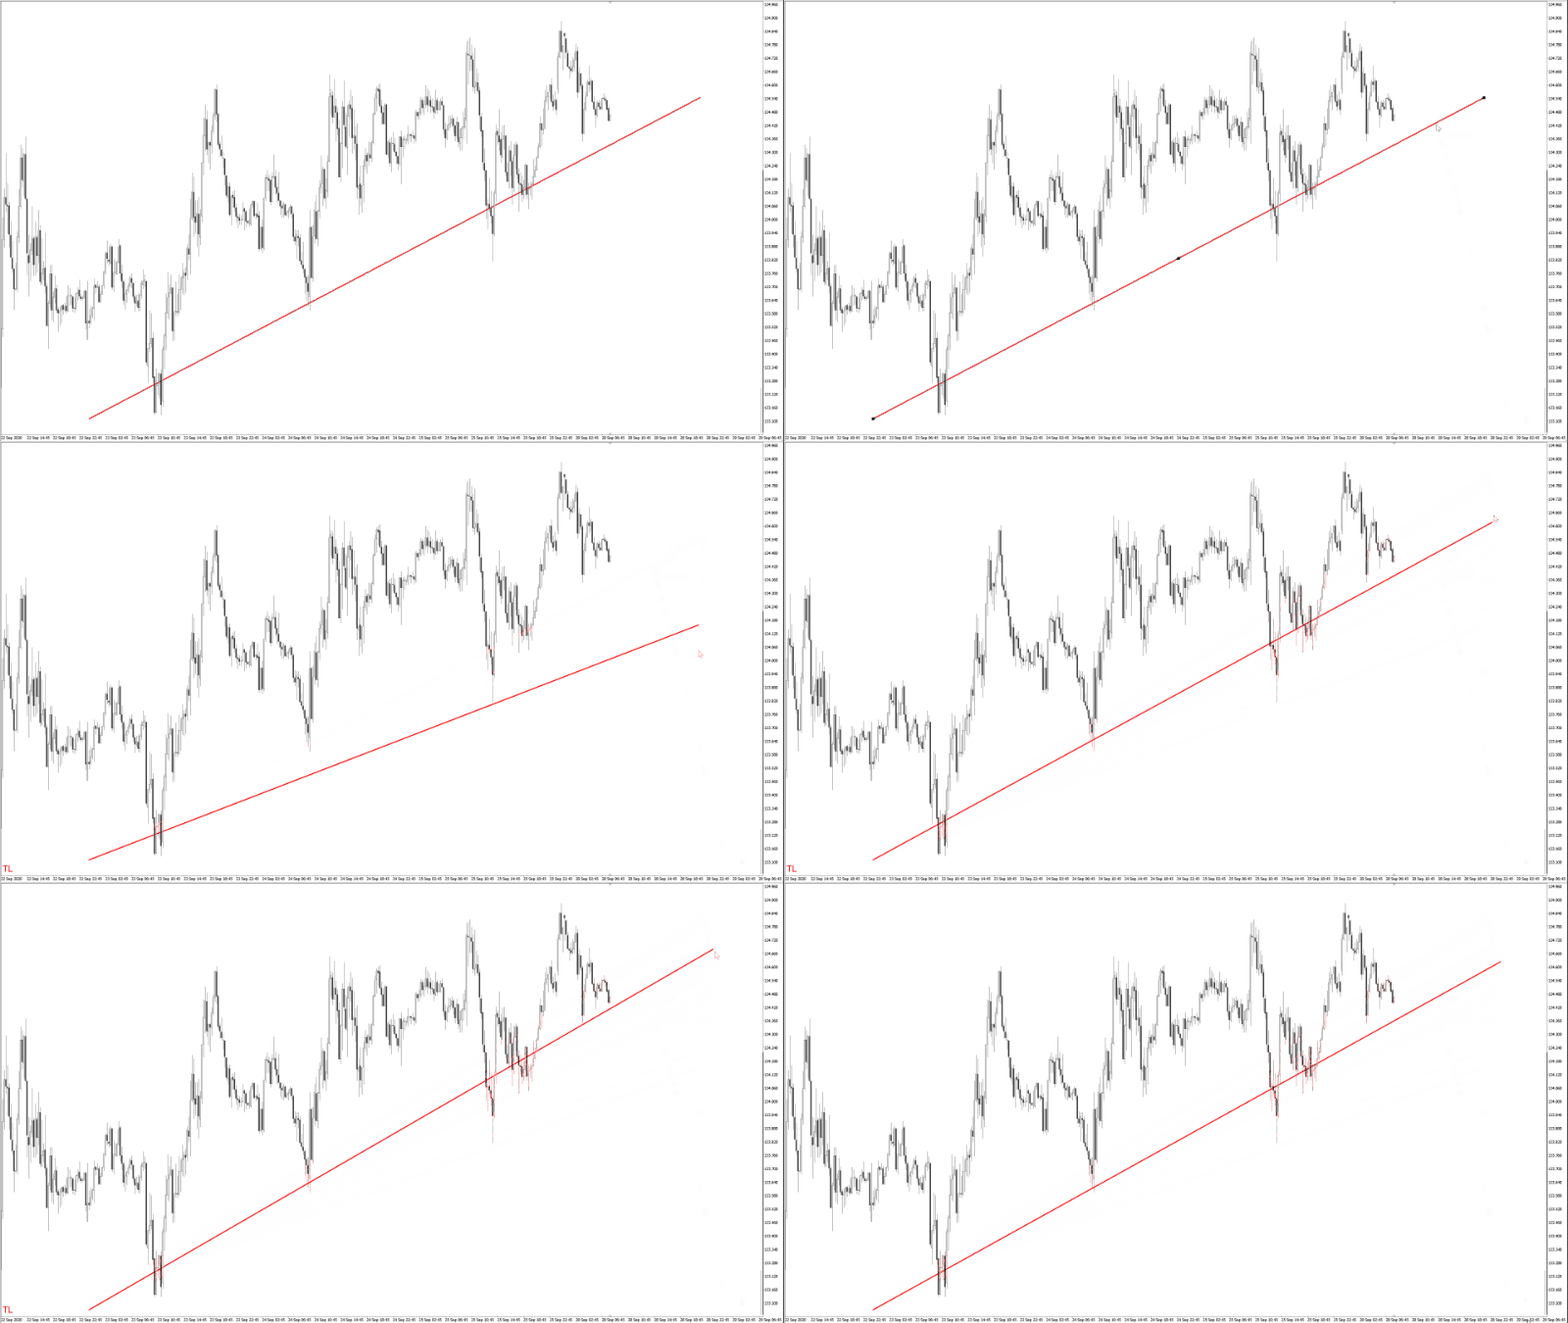
How to redraw a trendline
1. Click the starting or end point of the selected trendline to enter drawing mode.
2. The clicked point follows the mouse, so move the mouse to any point.
3. Adjust the opposite point with the arrow keys if needed.
4. Click to draw the line.
About drawing mode
This mode is for drawing each line.
If the hotkey is pressed, the status label will be shown.
Each time you press a hot key, this mode switches. (Primary -> Secondary -> Escape)
Hotkeys
- Draw a vertical line (default="V")
- Draw a horizontal line (default="H")
- Draw a trendline (default="T")
Tips
- You can extend the trendline at a horizontal angle by holding down the shift key and clicking the starting point of the trendline.
- You can delete each line by holding down the tab key and clicking.
- You can escape from the drawing mode by pressing the escape key.
