• Visão global
  • Comentários
  • Discussão
  • O que há de novo

CandleFilter

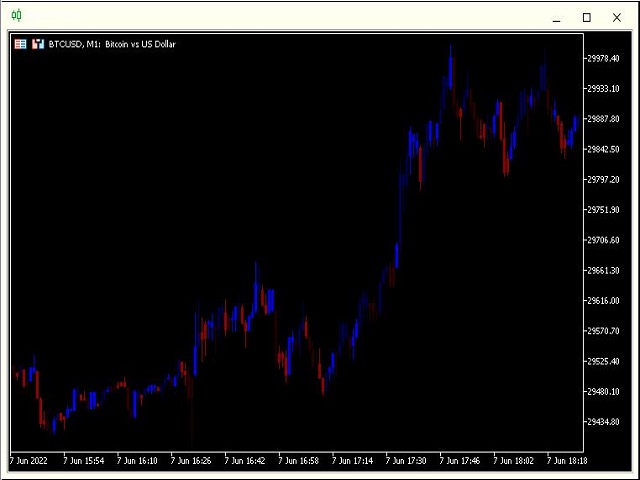
Este indicador exibe informações de preços filtradas
na forma de um gráfico de velas usando 64 faixas de cores.
Perfeitamente útil para determinar a força da direção do movimento dos preços.
Este indicador não possui configurações.
Todas as 64 cores já estão incluídas no programa,
quanto mais brilhante a cor azul, mais forte a força do movimento de compra,
e quanto mais brilhante a cor vermelha, mais forte a força do movimento de venda.
////////////////////////////////////////////////////////////////////////
Espero que este indicador seja muito útil para você na negociação bem-sucedida.
Boa sorte.
Produtos recomendados
Limitless MT5
Dmitriy Kashevich
Limitless MT5 is a universal indicator suitable for every beginner and experienced trader. works on all currency pairs, cryptocurrencies, raw stocks Limitless MT5 - already configured and does not require additional configuration And now the main thing Why Limitless MT5? 1 complete lack of redrawing 2 two years of testing by the best specialists in trading 3 the accuracy of correct signals exceeds 80% 4 performed well in trading during news releases Trading rules 1 buy signa
Apresentando o revolucionário indicador MT5, DARWIN Assistant   - sua porta de entrada definitiva para o mundo das negociações bem-sucedidas! Projetado com precisão e experiência, o DARWIN Assistant   opera em uma estratégia especial que aproveita o poder de indicadores técnicos avançados - RSI, Estocástico, CCI e Tendências - em todos os prazos. Prepare-se para uma extraordinária experiência de negociação, pois este indicador de ponta oferece os sinais mais precisos para entrada, permitindo qu
Introduction to X3 Chart Pattern Scanner X3 Cherart Pattern Scanner is the non-repainting and non-lagging indicator detecting X3 chart patterns including Harmonic pattern, Elliott Wave pattern, X3 patterns, and Japanese Candlestick patterns. Historical patterns match with signal patterns. Hence, you can readily develop the solid trading strategy in your chart. More importantly, this superb pattern scanner can detect the optimal pattern of its kind. In addition, you can switch on and off individu
Elliott Wave Trend was designed for the scientific wave counting. This tool focuses to get rid of the vagueness of the classic Elliott Wave Counting using the guideline from the template and pattern approach. In doing so, firstly Elliott Wave Trend offers the template for your wave counting. Secondly, it offers Wave Structural Score to assist to identify accurate wave formation. It offers both impulse wave Structural Score and corrective wave Structure Score. Structural Score is the rating to sh
Gartley Projections D
Oleksandr Medviediev
3 (2)
The indicator identifies the harmonic patterns (XABCD) according to developments of H.M.Gartley ( "Profits in the Stock Market" , 1935г). It projects D-point as a point in the perspective projection (specify ProjectionD_Mode = true in the settings). Does not redraw. When a bar of the working timeframe closes, if the identified pattern point has not moved during Patterns_Fractal_Bars bars, an arrow appears on the chart (in the direction of the expected price movement). From this moment on, the ar
Ferramentas para ganhar e pesquisar. O núcleo dos sinais de negociação e estratégia é baseado no algoritmo do autor para a formação de padrões de previsão de preços. Aplicável a qualquer instrumento! Complementado com um sistema de controle baseado no MA "Nine-Tailed Fox" , atualizando e ajustando o sinal com a maior precisão possível para o mercado, instrumento e período de trabalho. Elegíveis: Todos os instrumentos em todos os mercados (há exceções). Para quem é: fundos de hedge, gestores d
Smooth price for Monarch
Konstantin Gruzdev
5 (1)
The Smooth Price technical indicator is used for plotting a smoothed line as close to the price of the financial instrument as possible, and serves to eliminate its noise components. The indicator is part of the Monarch trading system, but here it is presented as an independent technical analysis tool. The indicator is based on the cluster digital filter , which, unlike the ClusterSMA , is applied directly to the price time series. Smooth Price does not redraw (except the very last, zero bar) an
Introduction to Harmonic Volatility Indicator Harmonic Volatility Indicator is the first technical analysis applying the Fibonacci analysis to the financial volatility. Harmonic volatility indicator is another level of price action trading tool, which combines robust Fibonacci ratios (0.618, 0.382, etc.) with volatility. Originally, Harmonic Volatility Indicator was developed to overcome the limitation and the weakness of Gann’s Angle, also known as Gann’s Fan. We have demonstrated that Harmonic
Price Action Scanner Pro is an indicator that identifies price behaviors and provides alerts, offering more features and customization compared to Price Action Scanner. This indicator can simultaneously detect signals for up to 15 symbols across different timeframes. You can configure it to detect signals during specific trading sessions such as Asian, European, and US sessions, using different timeframes. This allows you to use lower timeframes for active trading periods and higher timeframes
This indicator is based on the crossing of two Moving Average with the RSI It is intended for scalpers Specially designed for Boom and Crash syhtetic indices from Binary.com/Deriv.com It is easy to use and intuitive. We recommend its use on M1 and is equipped with three types of notification Email alert Sound notification Push notification these parameters can be activated and deactivated.
PZ Swing Trading MT5
PZ TRADING SLU
5 (4)
Swing Trading é o primeiro indicador projetado para detectar oscilações na direção da tendência e possíveis oscilações de reversão. Ele usa a abordagem de negociação de linha de base, amplamente descrita na literatura de negociação. O indicador estuda vários vetores de preço e tempo para rastrear a direção da tendência agregada e detecta situações nas quais o mercado está sobrevendido ou sobrecomprado em excesso e pronto para corrigir. [ Guia de instalação | Guia de atualização | Solução de prob
Win43 Scalper
Eadvisors Software Inc.
O novo s43 Scalper para Mini-Índice (WIN-IND) faz operações de curto prazo no timeframe 1min buscando pequenas variações do mercado, utiliza nova tecnologia de trade, os resultados no intraday são íncríveis, confira:      Após a instalação adicione no gráfico dos instrumentos win para visualizar os resultados no backteste. Recomendamos o timeframe de 1min.
QXS Market Scanner
Netlux Digital Kft.
QuantXMarketScanner is a multi assets indicator for MT5 - Mathematical model based on 7 custom moving averages indicators  - Adaptable on Currencies, Stocks and Crypto - Automatic setup, self optimized About QuantXsystem Products: –         Simple installation & integration into MT5   –         Unlimited License after purchase (for one user) –         Automatic pattern recognition to identify the best timing and price levels. –         Trading indicators are displayed directly and automatica
This is the spike indicator , determining the highest high and lowest lows of price in the given period ,  it is also a zigzag indicator , to it may recalculate the values  or repaint if a new higher high or lower low forms in that given period,so beware How ever the indicator can be very powerful when used with other technical indicators for entry confirmation  Be sure to check out some of my other premium products   
O nível Premium é um indicador único com mais de 80% de precisão nas previsões corretas! Este indicador foi testado pelos melhores Especialistas em Negociação por mais de dois meses! O indicador do autor você não encontrará em nenhum outro lugar! A partir das imagens você pode ver por si mesmo a precisão desta ferramenta! 1 é ótimo para negociar opções binárias com um tempo de expiração de 1 vela. 2 funciona em todos os pares de moedas, ações, commodities, criptomoedas Instruções:
Multi-currency, multi-timeframe, harmonic pattern indicator AB = CD. Supports sending push notifications about signals to a mobile device, messages on e-mail, as well as messages using alerts on all available currency pairs and timeframes. This indicator was based on the indicator Harmonic ABCD Universal. Version for MetaTrader 5:  https://www.mql5.com/en/market/product/44972 . See also: Harmonic ABCD Universal for MetaTrader 4 . Using modern software development methods has made the indicator a
WanaScalper
Isaac Wanasolo
1 (1)
A scalping indicator based on mathematical patterns, which on average gives signals with relatively small SL, and also occasionally helps to catch big moves in the markets (more information in the video) This indicator has three main types of notifications: The first type warns of a possible/upcoming signal on the next bar The second type indicates the presence of a ready signal to enter the market/open a position The third type is for SL and TP levels - you will be notified every time price r
How to use? • Buy Low and Sell High. • Brighter zones means strong Support or Resistance. • Weaker zones appear lighter. • Brighter zones are formed by overlapping of lines from multiple levels of support or resistance. Indicator Menu • The indicator can input 5 different Lengths. • The default settings uses 13, 21, 52, 100 & 200. • Every option are customizable.
MTF Stoch
Zhi Quan Xiao
This is a multi frame stochastic indicator, you can attach any time frame of stoch indicator on one chart. It is very useful if you like to check multi time frame stoch data. If you are interested in EA,click below links to take a look: https://www.mql5.com/en/market/product/80170 https://www.mql5.com/en/market/product/81136 How to use: > Atach the first time frame you want on to the currency pair's chart > Atach the second time frame you want on to the currency pair's   chart > Atach the thir
FREE
AW Candle Patterns
AW Trading Software Limited
O indicador AW Candle Patterns é uma combinação de um indicador de tendência avançado combinado com um poderoso scanner de padrão de vela. É uma ferramenta útil para reconhecer e destacar os trinta padrões de velas mais confiáveis. Além disso, é um analisador de tendências atual baseado em barras coloridas com       plug-in painel de tendência multi-timeframe que pode ser redimensionado e posicionado. Uma capacidade única de ajustar a exibição de padrões dependendo da filtragem de tendências. Va
Eazy Indicator
Isaac Agyei Poku
Forex BUY and SELL signals from the best Heiken Ashi Smoothed indicator. Draw bullish/bearish bars on the chart. Accurate trend detector. Heiken Ashi Smoothed is a simple MT5 indicator that draws bullish and bearish bars in the chart to reflect the direction of the trend. The indicator consists of orange bearish bars and green bullish bars. When the trend changes its direction, the indicator changes its color. The indicator is a modernization of the traditional Heiken Ashi indicator. Moving Aver
Welcome to the world of SMC (Smart Money Concepts) Trading, where we empower traders with the tools and knowledge to make smarter trading decisions. Our latest addition to our suite of trading tools is the SMC Trading Pro indicator, version 1.0. Key Features: Major Market Structure Identification with BODY break. Order Block must be in Major Swing ( not Small Swing ). Order Block with Fair Value Gap Detection. Order Block in Discount | Premium zone. Filter for only Bullish, Bearish or All Order
Time And Sales Delta
Evgeny Shevtsov
5 (2)
The indicator displays the delta and the cumulative delta based on the "Time & Sales" deals list data. In addition to the standard timeframes, the indicator displays data regarding the seconds timeframes (S5, S10, S15, S20, S30) to choose from. Using the rectangle, user can select an arbitrary area in the indicator subwindow to view the ratio of the volumes of deals of buyers and sellers within this area. Indicator features: The indicator works correctly only on those trading symbols for whi
Naked Forex Big Shadow indicator for MT5
Renaud Herve Francois Candel
5 (1)
Naked Forex Big Shadow Indicator Big Shadow Indicator is a pattern recognition indicator for Forex, Stocks, Indices, Futures, Commodities and Cryptos. When you have a Big Shadow on your chart then this is a strong signal meaning that you might be ahead of a reversal. You can take other elements (momentum, trend, volatility, price action, fundamentals) to build a complete strategy and confirm your entries. Beware that you might not make money just following the arrows generated by the pattern r
O 123 Pattern é um dos padrões de gráficos mais populares, poderosos e flexíveis. O padrão é composto por três pontos de preço: fundo, pico ou vale e retração de Fibonacci entre 38,2% e 71,8%. Um padrão é considerado válido quando as quebras de preços além do último pico ou vale, momento em que o indicador traça uma flecha, sobe um alerta, e o comércio pode ser colocado. [ Guia de instalação | Guia de atualização | Solução de problemas | FAQ | Todos os produtos ] Sinais de negociação claros
Introduction Harmonic Patterns are best used to predict potential turning point. Traditionally, Harmonic Pattern was identified manually connecting peaks and troughs points in the chart. Manual harmonic pattern detection is painfully tedious and not suitable for everyone. You are often exposed under subjective pattern identification with manual pattern detection. To avoid these limitations, Harmonic Pattern Plus was designed to automate your harmonic pattern detection process. The functionality
Introduction Excessive Momentum Indicator is the momentum indicator to measure the excessive momentum directly from raw price series. Hence, this is an extended price action and pattern trading. Excessive Momentum Indicator was originally developed by Young Ho Seo. This indicator demonstrates the concept of Equilibrium Fractal Wave and Practical Application at the same time. Excessive Momentum detects the market anomaly. Excessive momentum will give us a lot of clue about potential reversal and
IVISTscalp5
Vadym Zhukovskyi
5 (5)
Apresentamos a você o indicador iVISTscalp5, que não é apenas único, mas também eficaz em operações de negociação. Este indicador é baseado em dados de tempo e é o resultado de muitos anos de experiência e análise aprofundada dos mercados financeiros. O indicador iVISTscalp5 é uma excelente ferramenta para negociação manual. Conveniência, simplicidade e visualização - toda a complexidade está escondida dentro dele. Simplificamos as configurações e o uso do indicador iVISTscalp5 ao máximo. O indi
Matreshka
Dimitr Trifonov
5 (1)
Matreshka self-testing and self-optimizing indicator: 1. Is an interpretation of the Elliott Wave Analysis Theory. 2. Based on the principle of the indicator type ZigZag, and the waves are based on the principle of interpretation of the theory of DeMark. 3. Filters waves in length and height. 4. Draws up to six levels of ZigZag at the same time, tracking waves of different orders. 5. Marks Pulsed and Recoil Waves. 6. Draws arrows to open positions 7. Draws three channels. 8. Notes support and re
PTS - Buscador de Compras por Divergência da Precision Trading Systems O Buscador de Divergência de Precisão foi projetado para encontrar fundos de mercado com precisão milimétrica e frequentemente o faz. Na análise técnica, a arte de escolher fundos geralmente é muito mais fácil do que escolher topos; este item foi projetado precisamente para essa tarefa. Após a identificação de uma divergência de alta, é prudente esperar que a tendência se reverta antes de comprar. Você pode usar um mínim
Os compradores deste produto também adquirem
Bill Williams Advanced
Siarhei Vashchylka
5 (7)
Bill Williams Advanced is designed for automatic chart analysis using Bill Williams' "Profitunity" system. The indicator analyzes four timeframes at once. Manual (Be sure to read before purchasing) Advantages 1. Automatically analyzes the chart using the "Profitunity" system of Bill Williams. The found signals are placed in a table in the corner of the screen. 2. Equipped with a trend filter based on the Alligator indicator. Most of the system signals are recommended to be used only accordi
SMCpro
Arief
5 (1)
Currently Price  20% OFF  ( for unlimited use ) Indicator   USER MANUAL , trade setups, solving issues, etc :  Direct Download Here     (  for users only  ) Hello World! Introducing.. SMCpro tool and Indicator for  MetaTrader 5 , a cutting-edge feature designed to revolutionize your trading experience. With innovative ICT Smart Money Concept, you gain unparalleled insight into market dynamics, empowering you to make informed trading decisions like never before. SMC Indicator built on th
Go Way TREND
Ywsf Hsyn Hmad Alrsh
Siga a tendência. Sim, aguarde o sinal de entrada, seja de compra ou venda, num quadro de 15 minutos, e verifique o sinal se aparece num quadro de 30 minutos (por vezes demora uma hora ou mais para o sinal aparecer. Pode voltar para o quadro de 15 minutos e volte ao quadro de 30 minutos, e repita isto até que o sinal principal lhe apareça. Se o sinal aparecer no quadro de 30 minutos, introduza o preço e o lucro será obtido quando a linha de desenho mudar. , o lucro é contabilizado ou quando apa
TrendMaestro5
Stefano Frisetti
note: this indicator is for METATRADER4, if you want the version for METATRADER5 this is the link:  https://www.mql5.com/it/market/product/108106 TRENDMAESTRO ver 2.4 TRENDMAESTRO recognizes a new TREND in the bud, he never makes mistakes. The certainty of identifying a new TREND is priceless. DESCRIPTION TRENDMAESTRO identifies a new TREND in the bud, this indicator examines the volatility, volumes and momentum to identify the moment in which there is an explosion of one or more of these data a
Piranha version 2
Maria Strudov
5 (1)
"Piranha" - an autonomous trading system that determines overbought and oversold levels on the chart. Red and blue zones represent overbought and oversold levels respectively. Entry points are marked with arrows: a downward arrow in the red zone for "sell" and an upward arrow in the blue zone for "buy". The Take profit level is indicated by the green moving average. Key features: Adjusting the Take profit level as the green moving average changes position. Averaging ability when a new market e
FxaccurateLS
Shiv Raj Kumawat
WHY IS OUR FXACCCURATE LS MT5 THE PROFITABLE ? PROTECT YOUR CAPITAL WITH RISK MANAGEMENT Gives entry, stop and target levels from time to time. It finds Trading opportunities by analyzing what the price is doing during established trends. POWERFUL INDICATOR FOR A RELIABLE STRATEGIES We have made these indicators with a lot of years of hard work. It is made at a very advanced level. Established trends provide dozens of trading opportunities, but most trend indicators completely ignore them!
Introducing the South African Sniper indicator created by a small group of traders with a few years trading trading the financial market profitably . This is a plug and play indicator that provides you with  BUY and SELL (SNIPER ENTRY) signals with TARGET and trail stops. The indicator Works with all MT5 trading instruments. The indicator uses previous  chart data as receipt to speculate on future market moves.  "The South African Sniper indicator community are very happy with the indicator an
Scalping Tool for Deriv Description: This trading indicator is designed for traders specializing in scalping. It provides signals for trading in the direction of short-term price movements. The indicator is optimized for use on the M1 timeframe and supports Boom and Crash indices (300, 500, 1000). There are 3 copies left for $350 each The next price of 5 copies is 500$ The indicator will be sold in a limited quantity. Features: Trading direction: towards short-term price movements. Filters
ESTE INDICADOR, BASEADO EM INTELIGÊNCIA ARTIFICIAL, identifica possíveis pontos de reversão do mercado através da leitura da pegada e sinaliza ANTECIPADAMENTE pequenos movimentos de mercado antes que eles ocorram. Ao contrário dos indicadores de preço e volume, que geram entradas “tardias”, ou seja, quando já ocorreu uma confirmação de preço ou volume sobre uma mudança de direção e, portanto, muitas vezes o movimento já terminou, este indicador sinaliza, com base no que lê no pegada, “QUANDO O
O indicador gera sinais de entrada para OPÇÕES BINÁRIAS, desenhando uma seta no gráfico e emitindo um alerta sonoro. HORÁRIO DE FUNCIONAMENTO: 6.00 GMT/ 17.00 GMT (não recomendado após 17.00 GMT e durante a noite devido à volatilidade muito baixa e falta de volumes) PARES: EUR/USD (@EU6), GBP/USD (BP6). Prazos: 1,2,3,5,10,15 minutos Melhor tempo: 3 minutos VALIDADE: 1 vela O indicador precisa de volumes reais (sem volumes de ticks) para funcionar: ele não funciona em pares à vista EUR
Introducing the Power Trade Plus indicator designed by a small group of traders with a few years of experience trading the market profitably.  The Power Trade Plus is derived from the Power Trade indicator,  the indicator strive in powerful sniper entries and take profit levels,  with an algorithm that's can determine the markets volatility and Provides entries based on the current market volatility. This indicator is much more effective in stock ,currencies and indices.
EQ Cutrim Theory
Marco Aurelio Santos Costa
O Ronal Cutrim há 14 anos é um matemático dedicado e com mais de 10 anos de experiência no mercado financeiro. O conceito da teoria é simples, encontrar desequilíbrio entre compradores e vendedores. O que faz muito sentido, pois nada sobe para sempre, nada cai para sempre. Quando você encontra um ativo com probabilidade matemática de equilíbrio desequilibrado, é uma otima forma de entrar no trading, TUTORIAL  veja o video com atenção
Eng Gold
Ely Alkrar Xshkaky
ENG-GOLD Scalper It is an auxiliary indicator that identifies potential targets and determines the place of entry with a stop loss that works on Heiken Ashi candles  The green lines are usually the targets, the red lines are the stop loss, and the yellow lines are the entry location.  This file is recognized on small and medium frames, usually less than the watch frame I highly recommend using XAUUSD US100 US30 USOIL 
RAD CRITICAL LEVES RAD indicator tracks “Relevant Volume” in real time, identifying accumulation and distribution processes, projecting them in the chart as SUPPORT or RESISTANCE zones. Natural   support   and resistance levels are generated by Volume Accumulation and Distribution processes. As these processes evolve, levels at which the relevant volume in the market place is positioned, become difficult areas to cross upwards or downwards. By using this information, traders can identify very s
Weis Wave with Alert MT5
Trade The Volume Waves Single Member P.C.
4.93 (15)
Rental/Lifetime Package Options and Privileges  * For optimum results the yearly or lifetime package is suggested due to live training ! Rent Monthly Six Months   Yearly/Lifetime Weis Wave with Speed with Alert+Speed Index x x x Manual  x x x Quick Set up Video x x x Blog x x x Lifetime Updates x x x Setup and Training Material x x Free Rectangle Break Alert Tool      x Discord Access Channel "The SI traders" x 2-hour live methodology training x How to trade with it:    http://
VTrende Pro
Andrii Diachenko
5 (1)
VTrende Pro - MTF indicator for trend trading with a display panel for MT5 *** Videos can be translated into any language using subtitles (video language - Russian) Although the signals of the VTrende Pro indicator can be used as signals of a full-fledged trading system, it is recommended to use them in conjunction with the Bill Williams TS. VTrende Pro is an extended version of the VTrende indicator. Difference between Pro version and VTrende: - Time zones - Signal V - signal 1-2 waves
INDICADOR baseado em INTELIGÊNCIA ARTIFICIAL que gera possíveis entradas de chamada e venda para opções binárias. o indicador funciona em 3 estratégias diferentes: 1) ao ler volumes, envia um sinal quando o preço deve reverter 2) através da divergência entre preço e volume, envia um sinal quando a tendência deve continuar ou reverter 3) através da convergência entre preço e volume, envia um sinal de quando a tendência deve continuar. o indicador funciona em todos os prazos, mas os
Fibonacci Suavizado
Cesar Juan Flores Navarro
Indicador en MQL5, que obtiene el promedio de 10 EMAS, que son alineadas según Fibonacci, obteniendo un promedio, que sera suavizado.  Se puede ingresar un numero desde 2 a N, que multiplica a los EMA-Fibonacci. Funciona en cualquier criptomoneda, etc. etc... pudiendo calcular el futuro segun la tendencia de las EMAS. Funciona excelentemente en tramos largos, determinando exactamente el mejor inicio/salida. El precio inicial por apertura sera por un periodo de tiempo, luego aumentará.
TREND HARMONY MT5 – Multi Timeframe Trend and Phase and Pullback Level Visualizer indicator for Metatrader5 The TREND HARMONY indicator automates deep trend analysis and generates visualizations for you. Take control of your trades by eliminating uncertainty! Revolutionize your trading experience with precision and insight through the TREND HARMONY Multi Timeframe indicator – your ultimate MT5 trend visualization indicator. [  Features and Manual   | MT4 version |   All Products   ] Are you t
The indicator is designed to close positions on the market in time. For example: to take profits ahead of schedule if the price has not reached TakeProfit, and the market is turning around. The indicator analyzes the momentum, not the trend. He does not give any information about the trend. The indicator is well suited for finding divergence. The Ershov 38 Parrots indicator dynamically adjusts to the market and detects price movement impulses of medium and high amplitude. It almost does not rea
DOWN and UP trend
Ywsf Hsyn Hmad Alrsh
It makes it easier for you to trade by providing trend charts in all frames from bottom to top. If it touches the upward trend, it is a good opportunity to sell, and the target is the downward trend, and vice versa. If it touches the downward trend, it is a good opportunity to buy, and the target is the upward trend. It can automatically redraw the trend. You can monitor higher frames and trade on lower frames for speculation .
How to use Pair Trading Station Pair Trading Station is recommended for H1 time frame and you can use it for any currency pairs. To generate buy and sell signal, follow few steps below to apply Pair Trading Station to your MetaTrader terminal. When you load Pair Trading Station on your chart, Pair Trading station will assess available historical data in your MetaTrader platforms for each currency pair. On your chart, the amount of historical data available will be displayed for each currency pai
Классификатор силы тренда. Показания на истории не меняет. Изменяется классификация только незакрытого бара. По идее подобен полной системе ASCTrend, сигнальный модуль которой, точнее его аппроксимация в несколько "урезанном" виде, есть в свободном доступе, а также в терминале как сигнальный индикатор SilverTrend . Точной копией системы ASCTrend не является. Работает на всех инструментах и всех временных диапазонах. Индикатор использует несколько некоррелируемых между собой алгоритмов для класси
Currency Index Watcher is a simple and user-friendly tool for whoever wish to trade Forex using currencies indexes. Currency Index Watcher is configurable and usable directly from the panel. Indexes of 8 custom currencies EUR, USD, GBP, JPY, CHF, AUD, CAD, NZD (default) Any 3-chars symbol from your market watch could be used (BTC = bitcoin, RUB = ruble, CNH = yuan etc ...) : double click the symbol label  Ability to select which currencies and made-of pairs will be analyzed : check/uncheck want
SmartTrendMt5
Andrey Spiridonov
The SmartTrendMt5 trend indicator generates signals based on the principle of combined analysis of calculated reference points within the Keltner channel. The indicator plots the Keltner channel in a separate window (by default, red lines and a blue line - the middle of the channel), and also draws the histogram of calculated reference points for each candle (by default, the histogram bars are yellow). The should be attached to a chart of any timeframe and any trading symbol in the usual way.
If there is only one MT5 indicator you ever buy for trading forex – this has to be it. Your success as a forex trader depends on being able to identify when a currency or currency pair is oversold or overbought. If it is strong or weak. It is this concept which lies at the heart of forex trading. Without the Quantum Currency Strength indicator, it is almost impossible. There are simply too many currencies and too many pairs to do this quickly and easily yourself. You need help! The Quantum C
Forex Relative Performance indicator This indicator calculates the relative strength of major currencies against the US dollar. The basic idea behind this indicator is "to buy strong currency and to sell weak currency". This indicator allows you to quickly identify the best forex pair to trade according to your trading style (Intraday, Scalping, Swing, or Long Term)
The latest most requested Binary Options arrow indicator in the Garuda Signals product line is now on MT5! Binary options signal based on multiple time frame cross over analysis. Gets confirmation from the most consistent signals known to man; Ichimoku, SMA, Bollinger Bands; and also uses the 1 Hour time frame as trend confirmation , so you don't have to open up multiple chart and waste time. - Can be used for all time frames up to 1 hour, but is most POWERFUL for 1 and 5 min options. - Place yo
SuavizadorDePrecio
Cesar Juan Flores Navarro
Funciona identificando picos de máximos y mínimos, para luego eliminarlos haciendo una linea o curva, pudiendo el usuario ingresar el valor de que tanto puede suavizar. Nos facilita poder ver la tendencia así como ver el cruce que puede hacer con otros indicadores, mostrando a simple vista los inicios y salidas de una tendencia u operación. Así también facilita la visualización de subidas y bajadas.
Pendiente de Precio
Cesar Juan Flores Navarro
Indicador en base a la pendiente de la linea de precio, dibuja una línea de color cuando sube a base de los precios que previamente has sido procesados o linealizados, y cuando baja la pendiente la linea linealizada toma otro color. En este caso se a considerado 6 lineas de diferentes procesos desde pendientes largas hacia las cortas, observándose que cuando coincidan las pendientes se produce un máximo o mínimo, lo que a simple vista nos permitirá hacer una COMPRA O VENTA.
Mais do autor
Este é um gráfico de ticks no segundo formato. Há suporte para OpenCL. As configurações são muito simples - você pode selecionar os dias da semana para os quais o indicador será calculado: por exemplo, para esses instrumentos financeiros, cujas cotações não são atualizadas nos finais de semana, você deve selecionar qualquer outro dia da semana para o 6º e 7º dias, mas, por exemplo, para bitcoin, se o corretor atualizar as cotações, você pode especifique para o 6º dia - sábado e para o 7º dia -
//////////////////////////////////////////////// ////////////////////////////////// An improved version of the standard Bulls Power and Bears Power indicators. Now it's two in one. The setup is simple - you just need to specify the period. It is also very easy to understand the readings of this indicator, a signal above zero is a buy, and below it is a sell. //////////////////////////////////////////////// /////////////////////////////////// I hope this indicator will be very useful t
FREE
VScale Live Expert
Igor Gerasimov
4 (1)
O indicador agora inclui volumes verticais. !!!! O indicador agora inclui um módulo de previsão !!!! Se você quiser parar mensagens irritantes use este especialista em conjunto com o adquirido indicador pago "V-Scale Live Trainer". Negociação manual apenas. Um especialista simples torna os comerciantes mais fáceis. Nota: Para usá-lo, basta habilitar o comércio de um clique. E não se esqueça de desativar o AUTO_TRADE. A cada novo início do terminal, o metatrader 4, imediatamente, ce
FREE
Este especialista é projetado para trabalhar em pares com o mesmo indicador. https://www.mql5.com/ru/market/product/34834 O especialista não exibe nada na tela e não negocia. Ele só realiza cálculos para o indicador, isso é feito para salvar os recursos do seu computador. Como o especialista trabalha com símbolos do Market Watch, não há como testá-lo no testador. Instruções de uso: 0) Selecione os símbolos necessários no Market Watch, que serão exibidos no indicador. (Nota: !!! Antes de usar n
FREE
Este especialista é projetado para trabalhar em pares com o mesmo indicador. https://www.mql5.com/ru/market/product/34836 O especialista não exibe nada na tela e não negocia. Ele só realiza cálculos para o indicador, isso é feito para salvar os recursos do seu computador. Como o especialista trabalha com símbolos do Market Watch, não há como testá-lo no testador. Instruções de uso: 0) Selecione os símbolos necessários no Market Watch, que serão exibidos no indicador. (Nota: !!! Antes de usar n
FREE
An improved version of the standard Standard Deviation indicator. It is now a responsive and smoothed line. The setup is not straightforward - but I hope you can do it. It is very easy to understand the readings of this indicator, the meaning is the same as that of the usual Standard Deviation. //////////////////////////////////////////////// /////////////////////////////////// I hope this indicator will be very useful to you in successful trading. Good luck.
FREE
//////////////////////////////////////////////// ////////////////////////////////// An improved version of the standard Average True Range indicator. It is now a responsive and smoothed line. The setup is not straightforward - but I hope you can do it. It is very easy to understand the readings of this indicator, the meaning is the same as that of the standard Average True Range. //////////////////////////////////////////////// /////////////////////////////////// I hope this indicator
FREE
An improved version of the standard Standard Deviation indicator. It is now a responsive and smoothed line. The setup is not straightforward - but I hope you can do it. It is very easy to understand the readings of this indicator, the meaning is the same as that of the usual Standard Deviation. //////////////////////////////////////////////// /////////////////////////////////// I hope this indicator will be very useful to you in successful trading. Good luck.
FREE
////////////////////////////////////////////////////// // ////////////////////////////////////////////////////// //// /////////////////////////////////////// Go My Way é um indicador ultrapreciso da direção da tendência ou do movimento dos preços. Este indicador é calculado com base em uma dúzia de outros indicadores e tem um mecanismo muito complexo. ////////////////////////////////////////////////////// // ////////////////////////////////////////////////////// //// /////////////////////
//////////////////////////////////////////////////// // ////////////////////////////////////// Este indicador usa regressão polinomial para plotar três canais e seis linhas de acordo. O primeiro canal e suas fronteiras com grande período, o segundo com média e o terceiro com pequeno período. A configuração é simples - você só precisa especificar as cores e ativar / desativar a exibição das etiquetas de preço. Também é muito fácil entender as leituras deste indicador. As linhas de canal são usad
É muito simples - não há configurações. É necessário especificar apenas as cores e o tamanho das setas. Também é muito fácil entender as leituras deste indicador. Uma seta para cima é um sinal de compra e uma seta para baixo é um sinal de venda. Tente testá-lo no testador de estratégia - você vai gostar !!! //////////////////////////////////////////////////// // /////////////////////////////////////// Espero que este indicador seja muito útil para você nas negociações de sucesso. Boa sorte.
//////////////////////////////////////////////////// // ////////////////////////////////////// Uma versão melhorada do indicador Average True Range. Isso agora é o dobro da precisão e uma linha de média colorida. A configuração é bastante simples - você precisa especificar o período principal e o período de média. É muito fácil entender as leituras deste indicador, o significado é o mesmo que o do intervalo médio verdadeiro padrão. ////////////////////////////////////////////////////
//////////////////////////////////////////////////// // ////////////////////////////////////// Este indicador exibe a faixa de mudanças de preço em 1 minuto. Ótimo para gerenciamento de risco. Esta é uma versão aprimorada do indicador Average True Range para Tick Chart. Isso agora é o dobro da precisão e uma linha de média colorida. A configuração é bastante simples - você só precisa alterar as cores se necessário. É muito fácil entender as leituras deste indicador, o significado é o me
///////////////////////////////////////////////// / /////////////////////////////////// Este indicador exibe um canal de regressão polinomial não linear. Ele funciona muito rápido como um raio. Especialmente ao usar a tecnologia de aceleração OpenCL. Uma versão especial deste indicador estará disponível em breve, que também prevê o preço para algum tempo à frente. São linhas coloridas adaptáveis ​​e suaves. Existem quatro opções para este indicador: 1) 1 segundo período de tempo 2) Prazo de 2 s
Doze redes neurais artificiais divididas em quatro conjuntos tentando prever a direção do movimento de preços no futuro: pequeno: 1 minuto, médio: 5 minutos, grande: 30 minutos, real: 15 minutos. Este indicador para negociação ativa de alta frequência está pronto para trabalhar um EA lançado separadamente e recebendo sinais do indicador na forma de variáveis globais publicadas pelo indicador. Este indicador não funciona no testador de estratégia, então assista ao vídeo ou, escreva uma solicitaç
Este indicador exibe informações de preço filtradas na forma de três histogramas coloridos e uma linha colorida comum. Este é um indicador muito colorido e bonito. Ótimo para determinar a força e a direção do movimento dos preços. Este indicador tem configurações muito simples: 1) escolha de três opções para o cálculo do indicador: - original, - demarcador, - volume de equilíbrio. 2) seleção de cinco períodos diferentes. 3) seleção da cor exibida. 4) escolha da precisão. ///////////////////////
Versão corrigida e ampliada de "Lazy Frog MT5". Este EA funciona apenas em contas de hedge. Não se deixe intimidar pelo grande número de configurações, basta seguir as instruções de otimização no testador de estratégia: - a opção "todos os ticks" deve estar habilitada, - para obter resultados rapidamente, use o “algoritmo genético”, - o período de tempo não importa durante a otimização, deve ser alterado nas configurações avançadas, - o orientador lerá o arquivo salvo somente se a data de i
Filtro:
Sem comentários
Responder ao comentário
Versão 1.1 2023.04.12
Update //