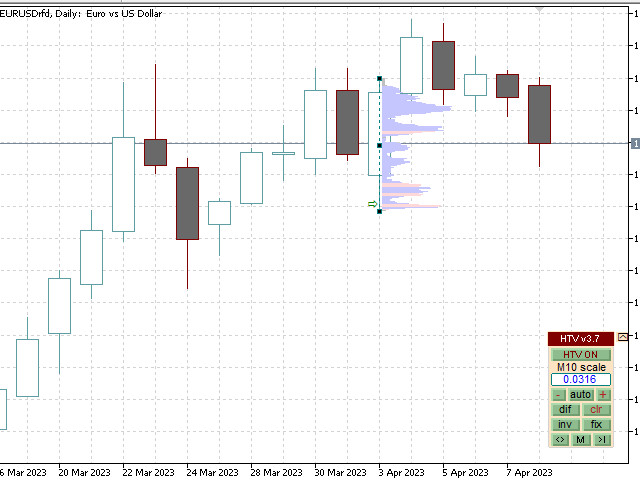
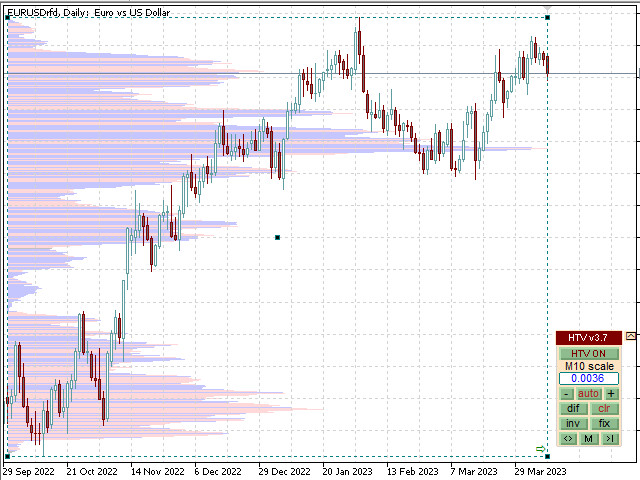
Versão 4.1
2023.05.19
Differences between version 4.1 and 4.0
- bugs fixed, code optimized;
Versão 4.0
2023.05.17
Differences between version 4.0 and 3.9
- fixed display of the bandwidth selection slider ("Scrol") in the mode: "inv"+"fix" and the scale "auto"-off.
Versão 3.9
2023.05.16
Differences between version 3.9 and 3.8
- added a separate floating settings and options panel ("#" button):
"PopUp messag" - show messages about the number of settlement bars;
"Inactiv window" - when the chart window is not active, change the color of the control panel and settings to gray;
"Propertie save" - save chart properties when switching periods (F8 > colors, general);
"Period Optimal" - the optimal choice of the period for calculating horizontal volumes (or optionally "Set:");
"Spread show" - show the current spread in a separate (movable) window;
"Time display" - show the current time and date from the quotes server (you can move and change properties by double-clicking);
"Time-end Bar" - show the remaining time until the closing of the current bar (moves and changes after selection by double clicking);
"Median show" - show the maximum volume profile level as a horizontal line, form profile rectangles in accordance with
with the selected bandwidth from the maximum median value in percent, duplicated by the button on the control panel
"[]" (under the "-" zoom button);
"Value hide" - hide the numerical values "volume~delta~power" and "accuracy" on the chart rectangles;
"Profile hide" - hide the profile of volumes, except for rectangles (does not work in the "dif" mode);
"Scrol%" - on the graph, show the slider for manual (smooth) change in bandwidth from the maximum value of the median (1-99)%,
or optionally, in accordance with the Fibonacci levels (1,2,3,5,8,13,21,34,50,62,78,89)%.
- added "O" button for displaying the volume profile over the bars of the chart (under the "+" button for adjusting the scale);
- improved display of the numerical value of the scale value;
Versão 3.8
2023.04.11
Differences between version 3.8 and 3.7
- elimination of the disappearance of the indicator control panel and the "HTV Off" button when resizing the chart window in the terminal;
Versão 3.7
2023.04.09
Differences from version 3.7 from 3.6
- optimization of redrawing the chart image when a new calculated bar appears and the current bar is not changed,
as well as with other changes (scrolling, scaling, the appearance of a new current bar, etc.);
- updating (recalculating) the chart when the price of the current (zero) bar goes beyond the boundaries of the calculation frame;
- fixed the error of resetting (not saving) the chart settings when two or more indicators for the same symbol are working in different windows;
Versão 3.6
2023.04.07
Differences from version 3.6 from 3.5
- fixed chart movement control has been changed ("fix" button is active): movement of the volume chart follows the movement of the mouse cursor after
clicking on one of the triangular labels (color - 'Neutral color horizontal volume') located on the border of the window at the bottom and top. After clicking again anywhere, the graph is fixed;
- fixed message about missing historical data;
Versão 3.5
2023.04.03
Differences from version 3.5 from 3.4
- added the ability to reset the "snapshot" of the chart saved in memory (created with the "M" button):
now, if there is a saved graph ("M" is highlighted in red) and pressing "M", additional reset buttons appear - "Res" memory
and positions of application from memory - "Yes", to exit without changes, press - "M".
Versão 3.4
2023.04.03
Differences from version 3.4 from 3.2
- changed the movement of the panel - to move it is necessary to click on the upper part of the panel to unpin/pin it;
- fixed incorrect behavior when using the "M" save function of the current chart view;
- fixed "twitching" of the chart when pressing the navigation buttons to change the display area;
- improved navigation function to the right ">|";
- conflicts between different chart display modes were eliminated by blocking the panel buttons;
- added a message about the absence of critical historical bars in the terminal for the current timeframe and the calculation timeframe;
Versão 3.2
2023.03.25
Version 3.2
- improved algorithm for constructing horizontal volumes;
- fixed display errors at a fixed chart scale;
- added buttons "M" for changing the display area within the visible bars on the chart "<>",">|";
- added a button to save the current view of the chart, with the ability to instantly return to it from any changed state ("Memory");
- added "Calculation popup message" message when plotting a chart (with the ability to disable it by [false]);
- added the ability to select the timeframe by which the horizontal chart "Calculation timeframe, current-optimal" is calculated;
- added a function to warn about the absence of historical data of the calculation timeframe with an indication of the time;
Versão 3.0
2023.02.14
Fixed minor bugs when initializing the indicator.
Versão 2.9
2022.06.25
Version 2.9
Added color change of the control panel when the chart window is inactive - "Show inactive window view".
Fixed errors in displaying the panel when changing the chart.
Versão 2.8
2022.06.22
Version 2.8
Fixed the observed periodic failure of the indicator when switching the chart period.
Fixed display of the "Scale" value in the panel when it is adjusted with the [-] and [+] buttons.
Versão 2.7
2022.06.22
Version 2.7
Fixed errors in displaying the control panel when resizing the chart window.
Added automatic saving of chart parameters and control panel settings when switching the chart period.

