Trend Analyser Dashboard
- Indicadores
- Elias Mtwenge
- Versão: 2.0
- Atualizado: 26 dezembro 2023
- Ativações: 15
IMPORTANT; Price is subject to rise at any time from now! Do not miss this offer!
Dear trader I am glad to introduce my new tool called Trend Analyser Dashboard to you.
The design, style, and settings of this indicator have been made simple to make its users not take too much time in understanding the indicator itself.
The purpose is to help traders in analysing the direction of the major trend and the status of the trend whether in weak trend or its strong trend.
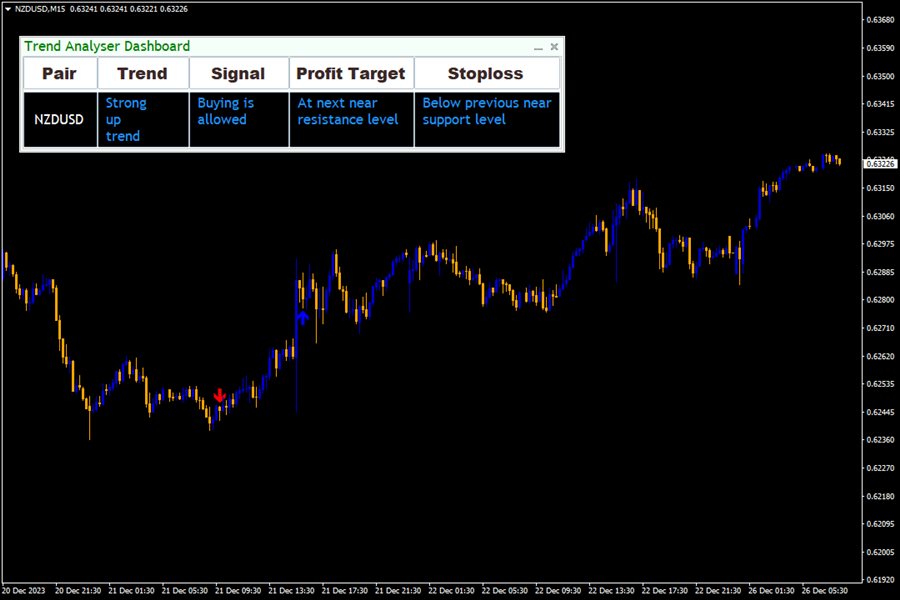
The indicator will also provide you with recommended will tell you whether the trend is strong or weak, it will also tell you whether to buy or not to buy in that strong or weak trend plus where you should put your take profit and stop loss targets.
Timeframe
The indicator can be used for all time-frame.
Settings and Inputs
It is recommended not to change the default input settings to get the desired results but if you think that there is a need to do so then you may change the input settings to meet your desires and you should know that this will interfere with the default signals and may alter your results with this indicator. From the author's recommendation just do not alter the default settings.
How the indicator works.
The dashboard can be dragged around the chart to have different angles of viewing the dashboard according to the user's needs.
1. FOR UPTREND
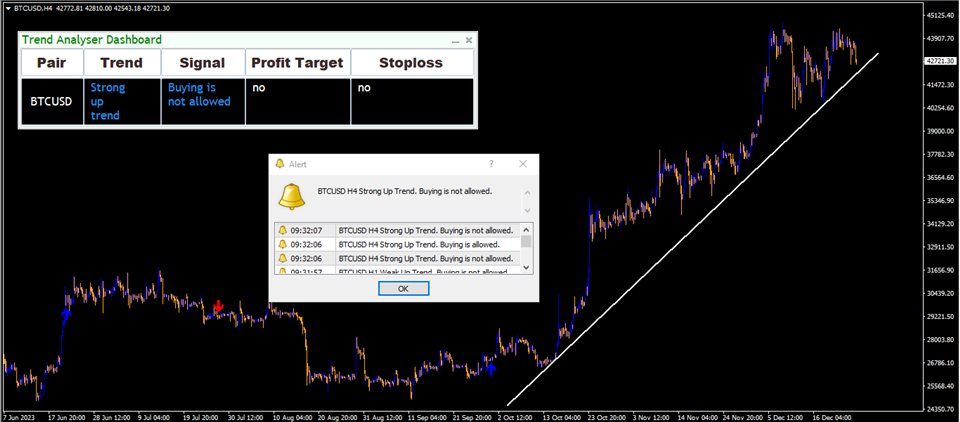
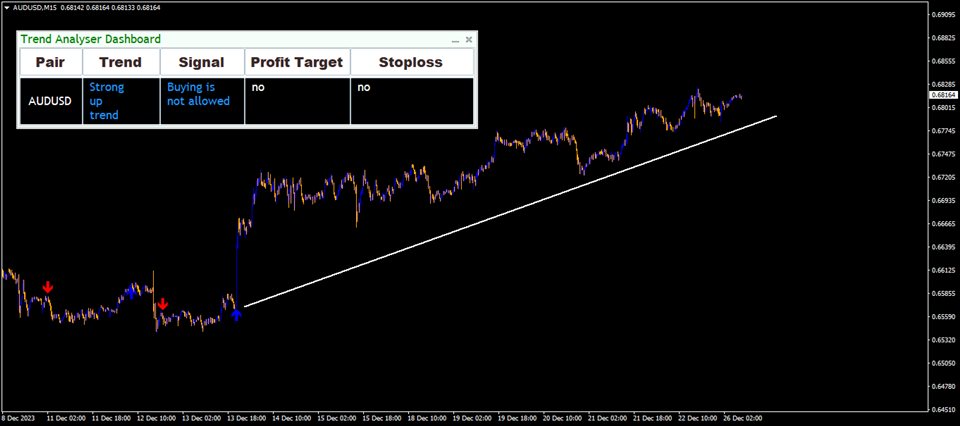
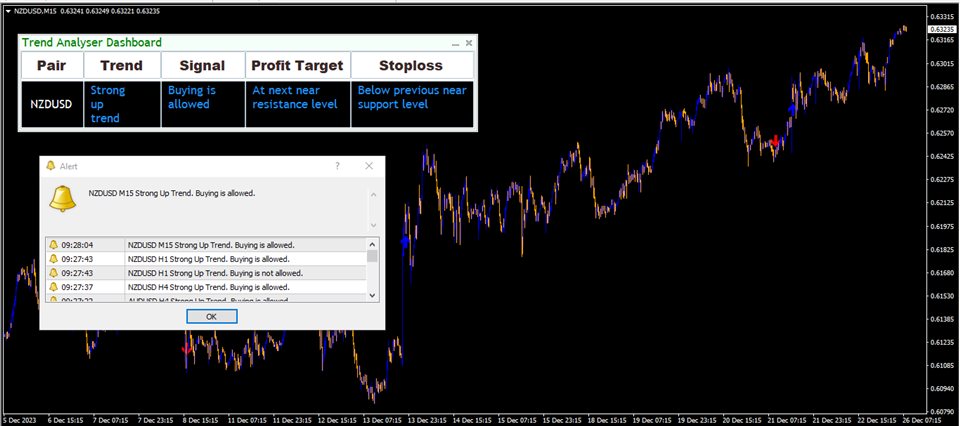
- For strong up trend the indicator will display the word "Strong uptrend" in a blue color.
- For weak up trend the indicator will display the word "Weak uptrend" in a bright neon blue color.
2. FOR DOWN TREND
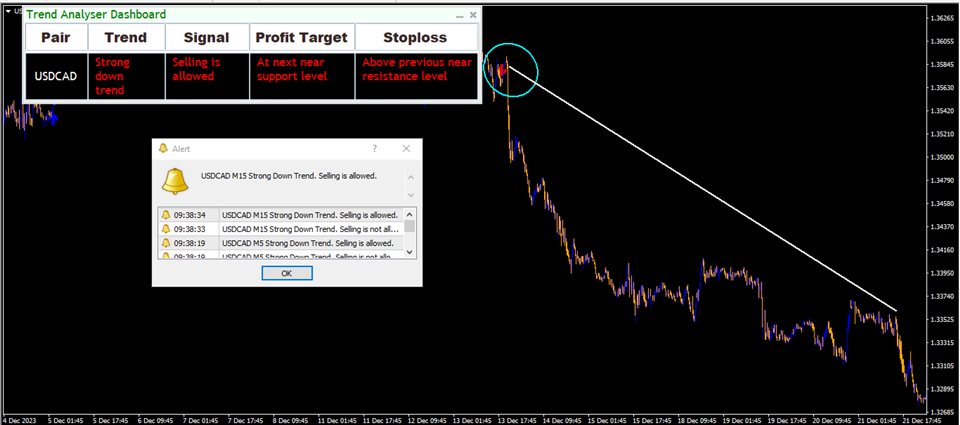
- For strong down trend the indicator will display the word "Strong down trend" in a red color.
- For weak down trend the indicator will display the word "Weak down trend" in an orange color.
Note: The indicator will show you the signals for entering a trade by displaying texts as buying is not allowed or buying is allowed and vise-versa.
Disclaimer: The main purpose of the indicator is to show you the direction of the major trend and the status of the trend therefore the decision to sell or to buy a pair is yours and the signals given by this indicator should not be considered final in making financial decision. If you have your strategy and use it wisely with this indicator it will be a great combination. Otherwise if you want your trading to completely rely on this single tool then you will need more time to learn how to trade with this indicator. The profit target or stop loss indicated by this tool may be sometime be too small or too big to be take a trade. Therefore you should consider the issue of money management more before entering a trade. Partial targets may be applied by the trader to maximize hitting the profit target. These partial targets could be going for half or the recommended profit level or quarter of the recommended level.
I have attached screenshots so as you may have a look to what the dashboard looks like.
Thank you for considering my product.























Been trading for 4 years and would say this is the best trading tool so far after spending hundreds of $ trying to find the perfect tool this trend analyser dash board would be acting as your guardian angel because it directs you in the ride direction whether to take a trade or not or if a trend is weak or strong most traders see a good set up stones to buy or sell but stones you don’t know if that trend is strong or weak this indicator does the job you will see instant growth your profit taking