• Visão global
  • Comentários
  • Discussão

AIS Kolmogorov Zhurbenko Filter

O filtro Kolmogorov-Zhurbenko pode ser considerado como uma função de janela especial projetada para eliminar o vazamento espectral. Esse filtro é ideal para suavizar séries temporais estocásticas (incluindo financeiras).
O indicador baseado neste filtro contém os seguintes parâmetros:
  • iLength - o período da janela retangular original usada para construir o filtro. O valor válido é 2 - 255.
  • iDegree - ordem do filtro. Se iDegree=0, uma média móvel simples será obtida. Se iDegree=1, você obtém uma média móvel triangular. Ordens mais altas permitem melhor suavização e supressão de ruído. O valor permitido é 2 - 255. Além disso, este parâmetro afeta o período final do indicador = iLength + iDegree * (iLength - 1).
  • iMultiplier - um multiplicador que mostra o número de desvios padrão contados do valor do filtro.

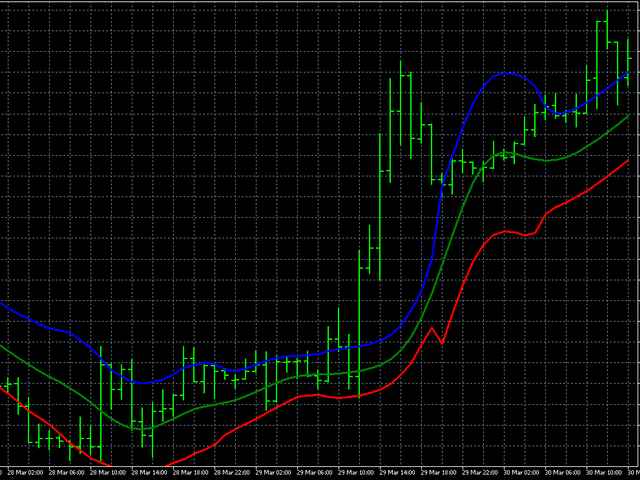
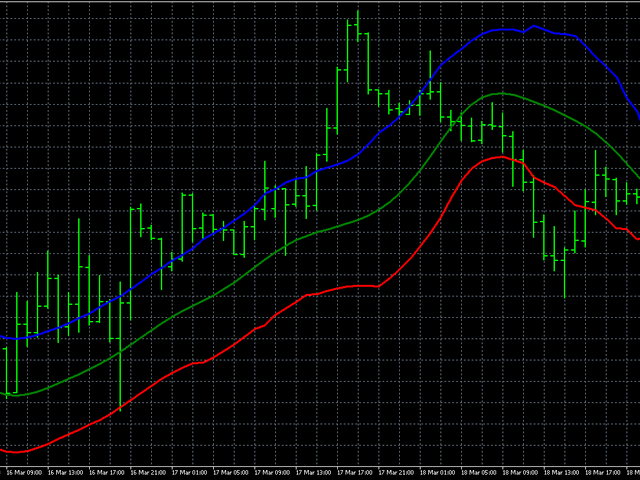
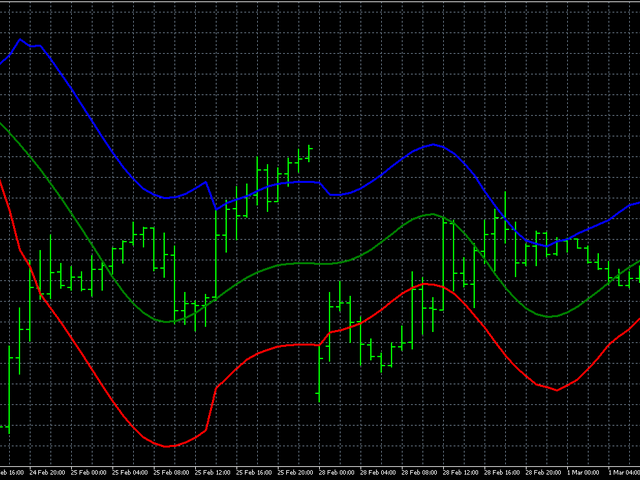
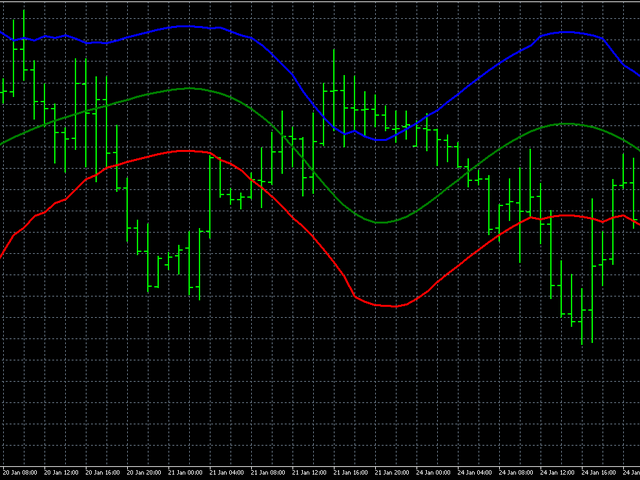
A aparência do indicador é mostrada nas fotos.
Produtos recomendados
Th3 BarPlay Signals Mt4
Nnamdi Kennedy Ifeorah
Esta é uma estratégia baseada em ação de preço conhecida como 3Bar_Play e é baseada na formação do padrão de velas 3Bar. Indicadores adicionais são adicionados para filtro e confirmações antes de aparecer as setas de sinal de compra/venda. Pode ser negociado em um mercado de tendência de alta, tendência de baixa ou lateral. Os indicadores adicionados incluem: Estocástico - Momento Fisher - Tendência ATR - Volatilidade que também define claramente a colocação de Stop-Loss na base da seta de sina
Trend Suffer
Philip Effiong Philip
Alerts you on new trends, with ENTRY and EXIT points. INSTRUCTIONS  Select asset of choice, activate the indicator on the chart and just follow the signals from the arrows. ITS FREE, GIVE ME A GOOD RATING! Platform : Metatrader4 Asset : All Currencies, Gold, BTCUSD, NASDAQ PS : F or newbie and pro traders. Used by more 3,000 traders around the world. Send  a mail for further help and information...........
Note : The slow loading of the indicator issue has been addressed . This new version loads fast and does not slow the platform. Version 1.3 : We have updated the indicator to include an historical bar scanning option . So instead of scanning all bars in the history (which can make the indicator slow sometimes ) , you can select the maximum number of bars it can scan which can increase the performance and make the indicator faster. This indicator scans the 1-3 Trendline pattern . The indic
Drawing Pack
John Louis Fernando Diamante
4 (1)
This indicator provides several drawing tools to assist in various methods of chart analysis. The drawings will keep their proportions (according to their handle trendline) across different chart scales, update in real time, and multiple drawings are supported. # Drawing Option Description  1 Grid box draggable boxed grid, user defines rows x colums, diagonal ray option  2 Grid partial or fullscreen grid, sized by handle line  3 Grid flex a diagonal grid, sized and sloped by handle line
The trader uses the Trend for Neuro indicator to determine the market situation. This is a trending algorithm that is convenient to download, install and use. The algorithm with acceptable accuracy generates input signals and output levels. Strategy for trend trading, filtering and all the necessary functions built into one tool! By launching the indicator, the user will see only two types of arrows that can change color to blue during an uptrend, to red during a downtrend there is no uncertaint
Smart trends view
Maria Cristina Sabatini
Clear trend filter   This is a filter-trend indicator.  From the settings you can select to use more filter or less. The very interesting part of the indicator comes out using with all the filter. In this way you can follow the trend easily even when the market is without a strong trend, but is instead more flat. I personally use it on 1 minutue timeframe with  MORE FILTER (you can select it from the input setting) in order to have an overlook of trend in the market.   Added: - Sound Notificatio
Contact me for instruction, any questions! Introduction Triangle chart patterns are used in   technical analysis , which is a trading strategy that involves charts and patterns that help traders identify trends in the market to make predictions about future performance.   Triangle Pattern Scanner Indicator It is usually difficult for a trader to recognize classic patterns on a chart, as well as searching for dozens of charts and time frames will take time, and there is also a possibility of a
Dynamic SR Trend Channel Dynamic SR Trend Channel is a simple indicator for trend detection as well as resistance/support levels on the current timeframe. It shows you areas where to expect possible change in trend direction and trend continuation. It works with any trading system (both price action and other trading system that use indicators) and is also very good for renko charting system as well. In an uptrend, the red line (main line) serves as the support and the blue line serves as the
Fluctuation Bands
Francisco De A Vilar Enriquez
Shows the price fluctuation bands associated with a moving average. It is extremely accurate, and it's a wonderful visual guide. The indicator consists of 4 bands . The two bands closest to the price form the fluctuation channel , they mark the maximum calculated deviation of the price from the moving average. The outer bands mark the maximum overdeviation of the price with respect to the fluctuation channel, they are overbought or oversold areas. Features.  -The change of periods of the MA is d
Reincarnations
Maryna Shulzhenko
The Reincarnations trend indicator is used to determine the strength and direction of a trend and to find price reversal points. This tool scans the market looking for the correct entry. You can see and evaluate it yourself, perhaps it will suit you for a number of tasks related to forecasting price movements. It uses only price data and analytics to calculate entry points. Does not use auxiliary indicators. It has two parameters for customization. Indicator setting. Interval - price analysis
ROC acceleration-deceleration is the manual system for medium-term scalping. Indicator based on custom ROC system which defines bullish/bearish market and especially  acceleration-deceleration of tendention in the market's main direction. Buy arrow is plotted during bearish market when current trend decelerates and sell  arrow is plotted during bullish market when current trend decelerates. Main Indicator's Features Signals are not repaint,non-late or disappear(exept cases when system recalculat
RSI Jurik
Augustine Kamatu
Introducing RSI Jurik—an innovative indicator designed to revolutionize your forex trading strategy by combining custom moving averages based on the Relative Strength Index (RSI) with the MetaTrader 4 indicator, RSI. Jurik moving averages are renowned for their accuracy and reliability in analyzing price movements in the forex market. They provide traders with smoother representations of price action, reducing noise and offering clearer signals for identifying trends and potential reversals.
FREE
PTW NON REPAINT TRADING SYSTEM + HISTOGRAM Non-Repainting ,   Non-Redrawing   and   Non-Lagging  Trading System. Does the following: - Gives Accurate Entry and Exit Points - Scalping, Day and Swing Trading  - 95% Accuracy  - Targets, where to take profits. - Shows Trends, Support and resistance levels - Works on All Brokers - Works on All Currencies, CFDs and Stocks - It does not place trades for you, it only shows you what trades to place. - It works on All Timeframes - It is for Trend or ra
KT DMA is a modified and advanced version of the classic Displaced Moving Averages with buy/sell crossover alerts and a Multi-Timeframe scanner that shows DMA's direction across each real-time time frame. A Displaced Moving Average is a simple moving average that moves ahead or backward in a time frame (either short-term or long-term). It also allows you to predict price movement more accurately. Features Depicts the trend direction using the alignment of three moving averages. Buy/Sell signa
This system never paints.   This system created by using Envolpes bands and reverse bar count.   This indicator is only working in M5 period.   This system is for long term and profitable.   Signals are shown as arrows. as an optional limit orders.   You can set a voice alarm or email notification.   You can fins our other products from link : https://www.mql5.com/en/users/drbastem/seller   Also, you can ask all your questins from email : haskayafx@gmail.com or mobile : +90 530 867 5076 or @Meh
This indicator shows in a subwindow the trend in M1, M5, H1, D1 timeframes based on MA, MACD, Stochastic This way you could see in once in different timeframes what happening.  This is my first free indicator. Please follow I will put here some more. Thank you for you attention.  . . . . . lfknglkslksnlgslgnsflgjrpoesv ,msv lkrjpfjésmdg sd.npo4wsmdglknsp4jwpkeégmfs.lkmp Thank you
FREE
The Waddah Attar Explosion (WAE) indicator is a potent tool in Forex trading, offering buy, sell, exit buy, and exit sell signals. It assesses trends as trend power and momentum as explosion power. Trend Direction: - Green bars indicate a bullish trend. - Red bars indicate a bearish trend. Signal Line: - A line serves as a threshold for momentum. Buy Trade Setup: **Entry:** Go long when a green bar crosses above the threshold. Place a stop loss below the entry candle. **Exit:** Close the
TMoney OrderblockDay
Moises Orlando Urbina Sojo
The indicator is triggered at the start of each trading day and detects both bullish and bearish ORDERBLOCK potentials. These levels are of high operational probability, being able to use a minimum ratio of 3 to 1 to maximize profits. It is recommended to use TimeFrame M5 to M30 for a proper display and consider pending orders at the OB levels of the chart and place the SL up to a maximum of 20 pips from the entry price. Submit the indicator to Backtesting to become familiar with its performa
The indicator shows the Buy/Sell direction. The calculations use the opening prices and their rate of change for the billing period - "Calculation period" MTF indicator - "Calculation timeframe", no repaint - NRP. Two display types: "Chart default" или "Chart color" For "Chart color" color customization available : "Bar color" Two types stop levels: "Simple stop level" or "Dynamic stop level " Color settings: "Stop level color" Alerts available: "Chart message", "Push message", "Email message" F
RoyalPrince Fibo
Richard Louis Pastor
4.8 (30)
Royal Prince Fibonacci , has the most advance Trend detection algorithm built into its Alert system combined with the RoyalPrince Non-repaint Arrows with it's own alert system you will never miss the opportunity of the trade.  2nd picture is how to use Guide on how i use it to Scalp or take long trades. works on all Charts and all Timeframe on mt4. ︎Best Timeframe M15 for scalping  H1 for Day Trading Options: • Fibonacci days High and Lows  • Fibonacci Targets • Fibonacci Alert System • Tren
Com esta ferramenta de negociação, você pode analisar 15 mercados simultaneamente. Apresentando o novo indicador de negociação 2024: ️ Painel Estocástico Multi Moeda Multi Time Frame. Há pelo menos duas razões pelas quais criei esta ferramenta de negociação: Primeiro, estou cansado de observar apenas um mercado. Segundo, não quero perder o momento de entrada em outro mercado. É por isso que quero conhecer outras condições de mercado ao mesmo tempo. Por esta razão, preciso de um sca
A useful scanner/dashboard that shows the RSI values for multiple symbols and time-frames. It can be easily hidden/displayed with a simple click on the scanner man top left of the dashboard. You can input upper and lower RSI values and the colours can be set to show when above/below these values. The default values are 70 and 30. There are also input colours for when the RSI is above or below 50 (but not exceeding the upper/lower levels Symbols and time-frames are input separated by comma
Gold PL MTF - this is a fine stock technical indicator. The indicator algorithm analyzes the movement of the asset price and automatically reflects the important Pivot Levels of the specified timeframe (TF) using the Fibonacci method (golden section). The indicator perfectly describes the price trajectory of the selected timeframe (day, week, month, year), determines the beginning of a trend and the beginning of a correction, which may develop into an opposite trend. The indicator also shows t
Implement
Vitalii Zakharuk
5 (1)
Implement analyzes market dynamics for pivot points. If you want to learn how to spot the correct reversals for consistently likely profitable trading, buy this indicator. Shows favorable moments of entering the market in stripes. Ready-made trading system. The principle of operation of the indicator is to automatically determine the current state of the market when placed on a chart, analyze historical data based on historical data and display instructions for further actions on the trader's
Ezy Option Signal
Nirundorn Promphao
The principle of this indicator is very simple: detecting the trend with Moving Average, then monitoring the return point of graph by using the crossing of Stochastic Oscillator and finally predicting BUY and SELL signal with arrows, alerts and notifications. The parameters are fixed and automatically calculated on each time frame. Example: If you install indicator on EURUSD, timeframe M5: the indicator will detect the main trend with the Moving Average on this timeframe (for example the Moving
What does this do? It shows you on the chart which stop belongs to which entry.  Have you ever had multiple positions or trades open on a single pair and were confused which stop loss goes with what entry? Even worse, the stop loss orders for buy and sells are the same color on the chart. Well, your problem has been solved! This indicator will show you which stop belongs to which entry.  It will place a vertical line and an arrow on the chart for each open trade. A yellow line connects the entry
Rira VWAP Bands
Vitor Palmeira Abbehusen
VWAP Bands gives you the regular Volume-Weighted Average Price and also the deviation bands. Use this indicator to see the possible amount of market movement, find support and resistance lines, find good spots for entry and exit,  and the most important feature is to find possible pivot points. This indicator has been mathematically improved by Rira team. The calculation begins at the start of each trading day
This product shows you a different view of the market by examining the performance of volume and continuous patterns in the market, then by calculating the behavior of traders and market patterns, calculates the probability of the next movement of the market by calculations. Function. How to receive the signal: If the candlestick is currently a bullish candlestick, according to a market scan, if the next bullish candlestick is below 5%, you can open a free trade by hitting the wisdom areas.
The Trend Goblin indicator identifies the mainstream trend. They help to analyze the market on a selected time frame. Easy to set up and works on all pairs and all time frames. Trend indicators provide an opportunity to classify the direction of price movement by determining its strength. Solving this problem helps investors enter the market on time and get good returns. It is extremely important for any trader to correctly determine the direction and strength of the trend movement. Unfortuna
Great Safe Signal
Muhammed Emin Ugur
Are you in search of a reliable tool to enhance your trading experience on MetaTrader 4? Look no further! "Great Safe Signal" is here to elevate your trading strategy and provide you with invaluable insights for making informed decisions. Key Features: Precision Analysis: "Great Safe Signal" employs advanced algorithms to analyze market trends and price movements with pinpoint accuracy. This ensures that you have the most precise information at your fingertips. User-Friendly Interface: We unders
Os compradores deste produto também adquirem
Scalper Inside PRO
Alexey Minkov
4.75 (59)
An exclusive indicator that utilizes an innovative algorithm to swiftly and accurately determine the market trend. The indicator automatically calculates opening, closing, and profit levels, providing detailed trading statistics. With these features, you can choose the most appropriate trading instrument for the current market conditions. Additionally, you can easily integrate your own arrow indicators into Scalper Inside Pro to quickly evaluate their statistics and profitability. Scalper Inside
TPSpro RFI Levels
Roman Podpora
4.86 (21)
Reversal First Impulse levels (RFI)    INSTRUCTIONS        RUS       -       ENG              R ecommended to use with an indicator   -   TPSpro  TREND PRO -  Version MT5 A key element in trading is zones or levels from which decisions to buy or sell a trading instrument are made. Despite attempts by major players to conceal their presence in the market, they inevitably leave traces. Our task was to learn how to identify these traces and interpret them correctly. Main functions: Displaying activ
TPSproTREND PrO
Roman Podpora
4.78 (18)
TPSpro TRENDPRO  - is a trend indicator that automatically analyzes the market and provides information about the trend and each of its changes, as well as giving signals for entering trades without redrawing! The indicator uses each candle, analyzing them separately. referring to different impulses - up or down impulse. Exact entry points into transactions for currencies, crypto, metals, stocks, indices!  -  Version MT5               DETAILED DESCRIPTION                R ecommended to use with
AT Forex Indicator MT4
Marzena Maria Szmit
5 (2)
The AT Forex Indicator MT4 is a sophisticated trading tool designed to provide traders with a comprehensive analysis of multiple currency pairs. This   powerful indicator   simplifies the complex nature of the forex market, making it accessible for both novice and experienced traders. AT Forex Indicator uses   advanced algorithms   to detect trends, patterns and is an essential tool for traders aiming to enhance their forex trading performance. With its robust features, ease of use, and reliabl
Indicator : RealValueIndicator Description : RealValueIndicator is a powerful tool designed specifically for trading on the EURUSD pair. This indicator analyzes all EUR and USD pairs, calculates their real currency strength values, and displays them as a single realistic value to give you a head start on price. This indicator will tell you moves before they happen if you use it right. RealValueIndicator allows you to get a quick and accurate overview of the EURUSD currency pair tops and bottoms,
Actualmente 20% OFF ! A melhor solução para qualquer novato ou comerciante especializado! Este software de painel de instrumentos está a funcionar em 28 pares de moedas. É baseado em 2 dos nossos principais indicadores (Advanced Currency Strength 28 e Advanced Currency Impulse). Dá uma grande visão geral de todo o mercado Forex. Mostra valores avançados de força da moeda, velocidade de movimento da moeda e sinais para 28 pares de divisas em todos os (9) períodos de tempo. Imagine como a sua
Atomic Analyst
Issam Kassas
5 (3)
Primeiramente, vale ressaltar que este Indicador de Negociação não repinta, não redesenha e não apresenta atrasos, tornando-o ideal tanto para negociação manual quanto automatizada. Manual do utilizador: configurações, entradas e estratégia. O Analista Atômico é um Indicador de Ação de Preço PA que utiliza a força e o momentum do preço para encontrar uma vantagem melhor no mercado. Equipado com filtros avançados que ajudam a remover ruídos e sinais falsos, e aumentam o potencial de negociação.
GOLD Impulse with Alert
Bernhard Schweigert
4.56 (9)
Este indicador é uma super combinação dos nossos 2 produtos Advanced Currency IMPULSE with ALERT  +   Currency Strength Exotics . Funciona para todos os períodos de tempo e mostra graficamente impulso de força ou fraqueza para as 8 principais moedas mais um Símbolo! Este Indicador é especializado para mostrar a aceleração da força da moeda para quaisquer símbolos como Ouro, Pares Exóticos, Commodities, Índices ou Futuros. É o primeiro do seu género, qualquer símbolo pode ser adicionado à
Apresentando       Quantum Trend Sniper Indicator   , o inovador Indicador MQL5 que está transformando a maneira como você identifica e negocia as reversões de tendência! Desenvolvido por uma equipe de traders experientes com experiência comercial de mais de 13 anos,       Indicador de Atirador de Tendência Quântica       foi projetado para impulsionar sua jornada de negociação a novos patamares com sua forma inovadora de identificar reversões de tendência com precisão extremamente alta. ***C
TrendMaestro
Stefano Frisetti
5 (3)
note: this indicator is for METATRADER4, if you want the version for METATRADER5 this is the link:  https://www.mql5.com/it/market/product/108106 TRENDMAESTRO ver 2.4 TRENDMAESTRO recognizes a new TREND in the bud, he never makes mistakes. The certainty of identifying a new TREND is priceless. DESCRIPTION TRENDMAESTRO identifies a new TREND in the bud, this indicator examines the volatility, volumes and momentum to identify the moment in which there is an explosion of one or more of these data a
JULY OFFER 80% OFF next price for unlimited version will be 17000$. This is the only time you can get this institutional and professional indicator at this price for unlimited version. Don't dare to miss this. The tool I am about to introduce to you you can't compare it with other tools due to its strategy and accuracy level in predicting the next price directional movement . This tool is designed for serious traders who have decided to make a difference through trading. Be the next person to wi
Quantum Breakout Indicator PRO
Bogdan Ion Puscasu
4.96 (26)
Apresentando       Quantum Breakout PRO   , o inovador Indicador MQL5 que está transformando a maneira como você negocia Breakout Zones! Desenvolvido por uma equipe de traders experientes com experiência em negociação de mais de 13 anos,   o Quantum Breakout PRO   foi projetado para impulsionar sua jornada comercial a novos patamares com sua estratégia inovadora e dinâmica de zona de rompimento. O Quantum Breakout Indicator lhe dará setas de sinal em zonas de breakout com 5 zonas-alvo de luc
Enigmera
Ivan Stefanov
5 (4)
ENIGMERA: O núcleo do mercado https://www.enigmera.com Introdução Este indicador e sistema de negociação é uma abordagem notável aos mercados financeiros. ENIGMERA utiliza os ciclos fractais para calcular com precisão os níveis de suporte e resistência. Mostra a autêntica fase de acumulação e dá direcções e objectivos.  Um sistema que funciona quer estejamos numa tendência ou numa correção.  Como é que funciona? O ENIGMERA é composto por três linhas: a linha de suporte/resistência, a linha
FX Volume
Daniel Stein
4.61 (36)
Receba a sua atualização diária do mercado com detalhes e screenshots através do nosso Morning Briefing aqui no mql5 e no Telegram ! O Volume FX é o PRIMEIRO e ÚNICO indicador de volume que fornece uma visão REAL do sentimento do mercado do ponto de vista de um corretor. Ele fornece uma visão incrível de como os participantes do mercado institucional, como corretores, estão posicionados no mercado Forex, muito mais rápido do que os relatórios COT. Ver essas informações diretamente no seu gráfi
Cycle Sniper
Elmira Memish
4.41 (37)
NEW YEAR SALE PRICE FOR LIMITED TIME!!! Please contact us after your purchase and we will send you the complimentary indicators to complete the system Cycle Sniper is not a holy grail but when you use it in a system which is explained in the videos, you will feel the difference. If you are not willing to focus on the charts designed with Cycle Sniper and other free tools we provide, we recommend not buying this indicator. We recommend watching the videos about the indiactor and system before pu
Entry Points Pro
Yury Orlov
4.7 (226)
Este é um indicador para MT4 que fornece sinais precisos para entrar em uma negociação sem redesenhar. Ele pode ser aplicado a qualquer ativo financeiro: forex, criptomoedas, metais, ações, índices. Ele fornecerá estimativas bastante precisas e informará quando é melhor abrir e fechar um negócio. Assista o vídeo (6:22) com um exemplo de processamento de apenas um sinal que compensou o indicador! A maioria dos traders melhora seus resultados de negociação durante a primeira semana de negociação c
Volume by Price MT4
Brian Collard
4.71 (14)
The Volumebyprice.com Indicator for MetaTrader 4 features Volume Profile and Market Profile TPO (Time Price Opportunity). Volume and TPO histogram bar and line charts. Volume Footprint charts. TPO letter and block marker collapsed and split structure charts. Session filtering and grouping. Static, dynamic and flexible range segmentation and compositing methods with relative and absolute visualizations. Graphical layering, positioning and styling options to suit the user's analytic and aesthetic
PTS Precision Index Oscillator V2
PrecisionTradingSystems
5 (2)
O Oscilador de Índice de Precisão (Pi-Osc) de Roger Medcalf da Precision Trading Systems A Versão 2 foi cuidadosamente reconfigurada para carregar rapidamente em seu gráfico, e algumas outras melhorias técnicas foram incorporadas para aprimorar a experiência. O Pi-Osc foi criado para fornecer sinais precisos de temporização de negociações projetados para encontrar pontos de exaustão extremos, os pontos para os quais os mercados são forçados a ir apenas para tirar as ordens de todos. Este
ZeusArrow Smart Liquidity Finder  Smart Liquidity Finder is Ai controlled indicator based on the Idea of Your SL is My Entry. It scan and draws the major Liquidity areas on chart partitioning them with Premium and Discount Zone and allows you find the best possible trading setups and help you decide the perfect entry price to avoid getting your Stop Loss hunted . Now no more confusion about when to enter and where to enter. Benefit from this one of it's kind trading tool powered by Ai an trade
Welcome to the world of SMC (Smart Money Concepts) Trading, where we empower traders with the tools and knowledge to make smarter trading decisions. Our latest addition to our suite of trading tools is the SMC Trading Pro indicator, version 1.0. Key Features: Major Market Structure Identification with BODY break. Order Block must be in Major Swing ( not Small Swing ). Order Block with Fair Value Gap Detection. Order Block in Discount | Premium zone. Filter for only Bullish, Bearish or All Order
A. O que é A2SR ?   * É um indicador técnico importante (sem repintura, sem atraso). -- Orientação : -- em https://www.mql5.com/en/blogs/post/734748/page4#comment_16532516 -- e https://www.mql5.com/en/users/yohana/blog A2SR tem uma técnica especial para determinar os níveis de Suporte (demanda) e Resistência (oferta). Ao contrário da maneira comum que vimos na rede, o A2SR tem um conceito original na determinação dos níveis reais de SR. A técnica original não foi retirada da internet, e tam
NAM Order Blocks
NAM TECH GROUP, CORP.
5 (1)
Indicador de detecção de blocos de pedidos de multi-timeframe MT4. Características - Totalmente personalizável no painel de controle do gráfico, fornece interação completa. - Oculte e mostre o painel de controle onde quiser. - Detectar OBs em vários períodos de tempo. - Selecione a quantidade de OBs para exibir. - Interface de usuário de OBs diferente. - Filtros diferentes em OBs. - Alerta de proximidade OB. - Linhas ADR de alta e baixa. - Serviço de notificação (alertas de
This indicator uses support and resistance, volume and some special formula to calculate the volume to filter the candles. If the volume reaches a specific value, And at the same time, Candle breaks the support/resistance line, There would be a signal and we can enter the market. Signals appear when the current candle closes. then you can enter the trade when a new candle appears. Please don't forget to follow your money management plan. MT5 Version Support/Resistance Breakout MT5 :   https:
Beast Super Signal
Dustin Vlok
4.76 (101)
Procurando por um poderoso indicador de negociação forex que possa ajudá-lo a identificar oportunidades de negociação lucrativas com facilidade? Não procure mais do que o Beast Super Signal. Este indicador baseado em tendências fácil de usar monitora continuamente as condições do mercado, procurando por novas tendências em desenvolvimento ou aproveitando as já existentes. O Beast Super Signal dá um sinal de compra ou venda quando todas as estratégias internas se alinham e estão em 100% de conflu
FxBears Powers
Rachid Lafhil
3 (2)
️️ Attention:      The price will soon be raised to what it was before ($500).      No more losses with this indicator, test it for years ago and see if there is losses in one day results. but before testing it please see the explaining video down here.    FxBears Powers is working on all forex pairs, metals, commodities, futures, indices, energies, crypto, and everything...and on all timeframes from M1 to MN.   It's based on supply and demand zones, price action, and some internal indicators,
30% DISCOUNT ! DISCOUNT ! DISCOUNT ONLY FOR 5 USERS at125$ valid for 1 day only.Grab it The PERFECT TREND HIT creates   BUY and SELL  perfect trend   arrow signals based on ADX EMA AND RSI And all filters inbuilt with accurate trend entries. Furthermore, the indicator and template display the trend direction, strength, and trade recommendation for independent price charts. ROCK WITH THE TREND Moreover, it shows the final trade recommendation to BUY or SELL with all filters and displays that info
Currency Strength Exotics
Bernhard Schweigert
4.88 (33)
ACTUALMENTE 20% DE DESCONTO ! A melhor solução para qualquer novato ou comerciante especializado! Este Indicador é especializado para mostrar a força da moeda para quaisquer símbolos como Pares Exóticos de Commodities, Índices ou Futuros. É o primeiro do seu género, qualquer símbolo pode ser adicionado à 9ª linha para mostrar a verdadeira força da moeda de Ouro, Prata, Petróleo, DAX, US30, MXN, TRY, CNH etc. Esta é uma ferramenta de negociação única, de alta qualidade e acessível, porque in
Claro, aqui está a tradução para o português: Apresentando o Indicador de Astronomia para MT4: Seu Companheiro Celestial Definitivo no Trading Você está pronto para elevar sua experiência de trading a alturas celestiais? Não procure mais do que o nosso revolucionário Indicador de Astronomia para MT4. Essa ferramenta inovadora transcende os indicadores de trading tradicionais, aproveitando o poder de algoritmos complexos para fornecer insights astronômicos incomparáveis e cálculos de precisão. Um
Gold Channel   é um indicador baseado na volatilidade, desenvolvido com um algoritmo de tempo especifico para o par XAUUSD que consiste em encontrar possíveis correções no mercado. Este indicador mostra duas linhas exteriores, uma interior (linha de retração) e um sinal de seta, onde a teoria do canal consiste em ajudar a identificar condições de sobrecompra e sobrevenda no mercado. O preço do mercado cairá geralmente entre os limites do canal. Se os preços tocarem ou se moverem para fora do can
All in One Trade
Alexey Minkov
4.48 (27)
The All-in-One Trade Indicator (AOTI) determines daily targets for EURUSD, EURJPY, GBPUSD, USDCHF, EURGBP, EURCAD, EURAUD, AUDJPY, GBPAUD, GBPCAD, GBPCHF, GBPJPY, AUDUSD, and USDJPY. All other modules work with any trading instruments. The indicator includes various features, such as Double Channel trend direction, Price channel, MA Bands, Fibo levels, Climax Bar detection, and others. The AOTI indicator is based on several trading strategies, and created to simplify market analysis. All-in-One
Mais do autor
This script allows selecting the TakeProfit and StopLoss levels. It analyzes the history data, and then calculates the probability of reaching a given price level. How the script works Suppose you have a trading strategy and you want to select the TakeProfit and StopLoss levels. Run the script and set the parameter: Number of Bars - the average position holding time in bars. Once the script operation is complete, the AIS-PPL.csv file will be created in the Files folder in the terminal data cat
FREE
MinDeposit
Aleksej Poljakov
5 (1)
The script analyzes the history of quotes and gives recommendations on the minimum deposit. The calculations take into account the variability of prices and the standard deviation. Margin requirements for the instrument are also taken into account. The result of the script is the minimum recommended deposit for trading the given currency pair.
FREE
O script é baseado na simulação de transações comerciais usando um gerador de números aleatórios. Isso permite obter resultados completamente diferentes, mesmo com os mesmos parâmetros de entrada. Quando você executa o script, é aberta uma caixa de diálogo na qual você pode definir os valores desejados para variáveis ​​externas. No bloco,  TradingOptions  define os parâmetros básicos necessários para simular a negociação. StartBalance  - define o tamanho inicial da balança comercial. NumberTrad
FREE
This script allows selecting the TakeProfit and StopLoss levels. It analyzes the history data, and then calculates the probability of reaching a given price level. How the script works Suppose you have a trading strategy and you want to select the TakeProfit and StopLoss levels. Run the script and set the parameter: Number of Bars - the average position holding time in bars. Once the script operation is complete, the AIS-PPL.csv file will be created in the Files folder in the terminal data cat
FREE
O script é baseado na simulação de transações comerciais usando um gerador de números aleatórios. Isso permite obter resultados completamente diferentes, mesmo com os mesmos parâmetros de entrada. Quando você executa o script, é aberta uma caixa de diálogo na qual você pode definir os valores desejados para variáveis ​​externas. No bloco, TradingOptions define os parâmetros básicos necessários para simular a negociação. StartBalance - define o tamanho inicial da balança comercial. NumberTrade -
FREE
MinDeposit MT5
Aleksej Poljakov
3 (1)
The script analyzes the history of quotes and gives recommendations on the minimum deposit. The calculations take into account the variability of prices and the standard deviation. Margin requirements for the instrument are also taken into account. The result of the script is the minimum recommended deposit for trading the given currency pair.
FREE
Este script é projetado para que o trader possa determinar a duração média das transações comerciais, na qual a proporção de possíveis lucros e perdas será ótima. Primeiro, vamos examinar a abordagem geral para determinar a duração ótima das transações comerciais. Nós introduzimos as seguintes variáveis: R - o resultado da transação; T - o tempo durante o qual a transação foi aberta; W - o tempo entre o fechamento da transação anterior e a abertura da próxima. Cada comerciante se esforça para ob
FREE
Escolher os níveis de StopLoss e TakeProfit pode ter um impacto muito forte no desempenho geral da negociação. Além dos parâmetros óbvios de uma transação comercial - o tamanho de uma possível vitória ou perda provável - os níveis de StopLoss e TakeProfit também afetam a duração esperada da transação e a rentabilidade da negociação em geral. Se você já determinou a duração ideal da transação usando o script “ AIS-ODT ”, poderá começar a determinar os parâmetros associados aos níveis StopLoss e T
FREE
Este script é projetado para que o trader possa determinar a duração média das transações comerciais, na qual a proporção de possíveis lucros e perdas será ótima. Primeiro, vamos examinar a abordagem geral para determinar a duração ótima das transações comerciais. Nós introduzimos as seguintes variáveis: R  - o resultado da transação; T  - o tempo durante o qual a transação foi aberta; W  - o tempo entre o fechamento da transação anterior e a abertura da próxima. Cada comerciante se esforça para
FREE
Escolher os níveis de StopLoss e TakeProfit pode ter um impacto muito forte no desempenho geral da negociação. Além dos parâmetros óbvios de uma transação comercial - o tamanho de uma possível vitória ou perda provável - os níveis de StopLoss e TakeProfit também afetam a duração esperada da transação e a rentabilidade da negociação em geral. Se você já determinou a duração ideal da transação usando o script “ AIS-ODT ”, poderá começar a determinar os parâmetros associados aos níveis StopLoss e T
FREE
The script allows selecting the required 'Filter level' value of the AIS-MTF MT5 indicator. Run the script on the required chart and selected timeframe. Once its operation is complete, the HPS.csv file will be created in the Files folder. Open the file. You will see three columns. The 'Filter lvl' column represents the value of the 'Filter level' for the AIS-MTF indicator. Am. dev. - degree and direction of the indicator's deviation from the price level (sorted in ascending order). Negative valu
FREE
O indicador AIS Correct Averages permite definir o início de um movimento de tendência no mercado. Outra qualidade importante do indicador é um sinal claro do fim da tendência. O indicador não é redesenhado ou recalculado. Valores exibidos h_AE - limite superior do canal AE l_AE - limite inferior do canal AE h_EC - Valor previsto alto para a barra atual l_EC - Valor previsto baixo para a barra atual Sinais ao trabalhar com o indicador O sinal principal é a interseção dos canais AE e E
O indicador de média móvel ponderada AIS calcula uma média móvel ponderada e permite determinar o início de um movimento de mercado de tendência. Os coeficientes de peso são calculados levando em consideração as características específicas de cada barra. Isso permite que você filtre os movimentos aleatórios do mercado. O principal sinal que confirma o início de uma tendência é uma mudança na direção das linhas do indicador e o preço cruzando as linhas do indicador. WH (linha azul) é a méd
O indicador AIS Advanced Grade Feasibility foi projetado para prever os níveis que o preço pode atingir no futuro. Seu trabalho é analisar as últimas três barras e construir uma previsão com base nisso. O indicador pode ser usado em qualquer período de tempo e em qualquer par de moedas. Com a ajuda de configurações, você pode obter a qualidade desejada da previsão. Profundidade da previsão - define a profundidade de previsão desejada em barras. Este parâmetro é recomendado para ser selecionad
The indicator is designed to measure the price volatility. This allows determining the moments for opening or closing trade positions more accurately. High intensity of the market indicates the instability of its movement, but allows for better results. And, conversely, low intensity of the market indicates the stability of its movement. Parameters Bars to process - the number of bars to measure the price movements. A low value of this parameter allows determining the moments of rapid price mo
This indicator uses the Fibonacci p-numbers to smooth a price series. This allows combining the advantages of the simple and exponential moving averages. The smoothing coefficients depend on the level of the p-number, which is set in the indicator parameters. The higher the level, the greater the influence of the simple moving average and the less significant the exponential moving average. Parameters Fibonacci Numbers Order - order of the Fibonacci p-number, specified by trader. Valid values
The indicator is based on the analysis of interaction of two filters. The first filter is the popular Moving Average. It helps to identify linear price movements and to smooth minor price fluctuations. The second filter is the Sliding Median. It is a non-linear filter. It allows to filter out noise and single spikes in the price movement. A predictive filter implemented in this indicator is based on the difference between these filters. The indicator is trained during operation and is therefore
This indicator studies the price action as a combination of micro-trends. All micro-trends are analyzed and averaged. Price movement is filtered based on this averaging. IP_High and IP_Low (blue and red dashed lines) show the instantaneous price movement. They display the forecast only for the current price values, taking into account only the number of bars defined by the 'Filter level' parameter. SP_High and SP_Low (blue and red solid lines) smooth the price movements with respect to history.
The script allows selecting the required 'Filter level' value of the AIS-MTF indicator. Run the script on the required chart and selected timeframe. Once its operation is complete, the HPS.csv file will be created in the Files folder. Open the file. You will see three columns. The 'Filter lvl' column represents the value of the 'Filter level' for the AIS-MTF indicator. Am. dev. - degree and direction of the indicator's deviation from the price level (sorted in ascending order). Negative values i
FREE
Este indicador implementa um processo de suavização linear simples. Uma das desvantagens da suavização exponencial é o rápido decaimento do sinal. Isso torna impossível rastrear totalmente as tendências de longo prazo na faixa de preço. A suavização linear permite ajustar com mais precisão e precisão a filtragem de sinal. O indicador é configurado selecionando os parâmetros: LP - este parâmetro permite selecionar o período de suavização. Quanto maior o seu valor, mais tendências de longo
Este indicador é um filtro híbrido sequencial baseado em uma combinação de propriedades médias e médias móveis. Usar a mediana permite filtrar outliers anormais e impulsos aleatórios nos valores da série de preços. Ao mesmo tempo, o filtro mediano não atua na tendência do movimento dos preços, deixando-o inalterado. Como o filtro mediano não é linear, a média usando uma média móvel simples é usada para suavizar seus valores. Essa abordagem nos permite identificar com mais precisão não apenas
Este indicador é uma combinação de dois filtros Lanczos modificados. O primeiro filtro serve para extrapolar o preço. Com base em valores anteriores, ele prevê um possível movimento de preços dentro da barra atual. Isto é, mostra qual seria o preço se as tendências passadas permanecessem inalteradas. O segundo filtro para suavizar e calcular a média de preços dentro da janela, determinado pelo nível do filtro. Graças à seleção de pesos, este filtro responde mais ativamente ao componente periódic
Vejamos a natureza das mudanças de preço no mercado Forex, não prestando atenção às razões pelas quais essas mudanças ocorrem. Essa abordagem nos permitirá identificar os principais fatores que afetam o movimento dos preços. Por exemplo, vamos considerar os preços de abertura das barras no par de moedas EUR-USD e no período de tempo H1. Por esses preços, construímos o diagrama de Lameray (Figura 1). Neste diagrama, pode-se ver que o movimento dos preços ocorre basicamente de acordo com uma equaç
Este indicador é mais informativo. Seu trabalho é baseado na suposição de que o movimento de preços no mercado pode ser escrito como o barulho de uma cor que depende dos valores dos preços dos parâmetros de distribuição. Isso torna possível analisar a variação dos preços dos diferentes partidos, e considerando o movimento de preços como o som de uma determinada cor, você pode obter informações sobre a situação atual no mercado e fazer uma previsão sobre o comportamento dos preços. Na análise do
Apesar de algumas desvantagens do indicador “ AIS Color Noise Filter ”, a ideia de usá-lo para suavizar a série de preços e os preços previstos parece bastante atraente. Isso se deve a vários motivos: em primeiro lugar, tendo em conta vários componentes de ruído permite construir uma previsão sobre fatores independentes uns dos outros, o que pode melhorar a qualidade da previsão; em segundo lugar, as características de ruído da série de preços se comportam de maneira bastante estável ao longo d
Muitas vezes, no estudo das séries financeiras, aplica-se a suavização. Usando suavização, você pode remover componentes de alta freqüência - acredita-se que eles são causados ​​por fatores aleatórios e, portanto, irrelevantes. A suavização sempre inclui alguma forma de calcular a média dos dados, na qual alterações aleatórias na série temporal se absorvem mutuamente. Na maioria das vezes, para esse propósito, métodos de média móvel simples ou ponderados são usados, assim como a suavização expo
Para isolar componentes de longo prazo e não aleatórios, é necessário saber não apenas quanto o preço mudou, mas também como essas mudanças ocorreram. Em outras palavras, estamos interessados ​​não apenas nos valores dos níveis de preços, mas também na ordem em que esses níveis se substituem uns aos outros. Por meio dessa abordagem, é possível encontrar fatores estáveis ​​e de longo prazo que influenciam (ou podem influenciar) a mudança de preço em um determinado ponto no tempo. E o conheciment
Um dos métodos poderosos de análise é a modelagem de séries financeiras usando processos Levy. A principal vantagem desses processos é que eles podem ser usados ​​para modelar um grande número de fenômenos - do mais simples ao mais complexo. É suficiente dizer que a idéia do movimento dos preços fractais no mercado é apenas um caso especial dos processos de Levy. Por outro lado, com a seleção adequada de parâmetros, qualquer processo Levy pode ser representado como uma média móvel simples. A Fi
Muitas vezes, o comerciante é confrontado com a tarefa de determinar a medida em que o preço pode mudar no futuro próximo. Para este propósito, você pode usar o tipo de distribuição Johnson SB. A principal vantagem dessa distribuição é que ela pode ser usada mesmo com uma pequena quantidade de dados acumulados. A abordagem empírica usada na determinação dos parâmetros dessa distribuição permite determinar com precisão os níveis máximo e mínimo do canal de preço. Esses valores podem ser usados ​
Este indicador permite determinar a probabilidade de o preço atingir um ou outro nível. Seu algoritmo é bastante simples e baseia-se no uso de dados estatísticos nos níveis de preços de um par de moedas específico. Graças aos dados históricos coletados, é possível determinar até que ponto o preço será alterado durante a barra atual. Apesar de sua simplicidade, este indicador pode fornecer assistência inestimável na negociação. Assim, com sua ajuda, é possível determinar os níveis TakeProfit e S
Filtro:
Sem comentários
Responder ao comentário