BB Squeeze MT5
- Indicadores
- KEENBASE SOFTWARE SOLUTIONS
- Versão: 1.2
- Atualizado: 4 maio 2022
- Ativações: 5
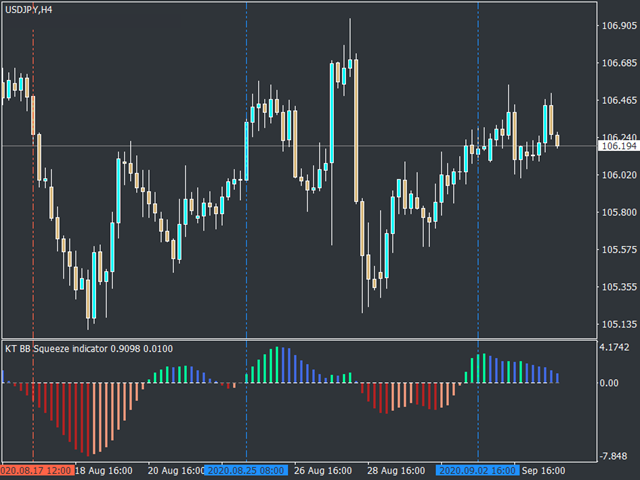
KT BB Squeeze measures the contraction and expansion of market volatility with a momentum oscillator, which can be used to decide a trading direction. It measures the squeeze in volatility by deducing the relationship between the Bollinger Bands and Keltner channels.
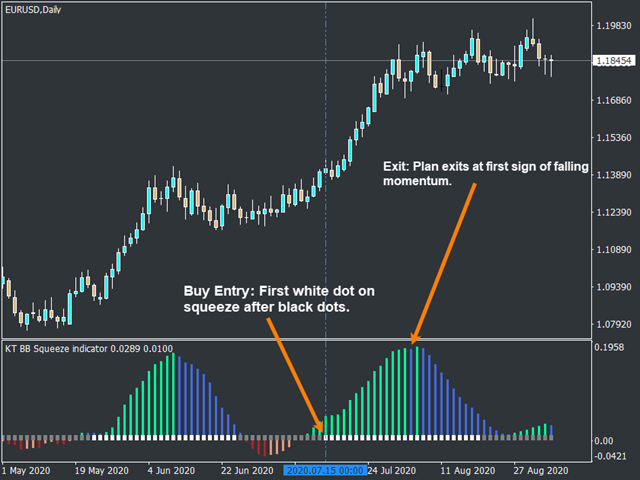
Buy Trade: A white dot after the series of gray dots + Rising momentum above the zero line.
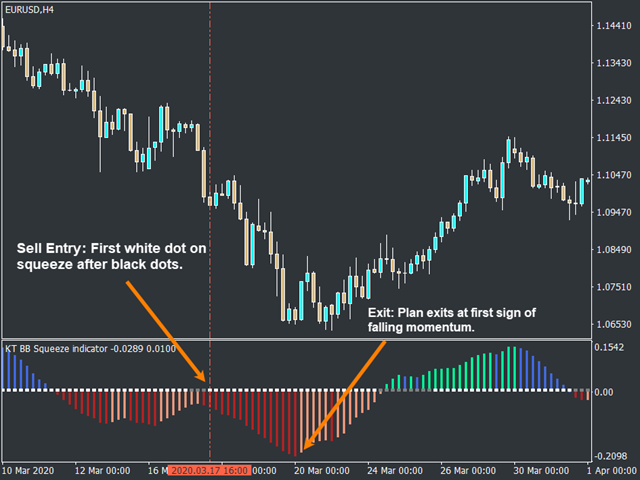
Sell Trade: A white dot after the series of gray dots + Rising momentum below the zero line.
Markets tend to move from a period of low volatility to high volatility and vice-versa. In the book Mastering the Trade, John Carter explains a straightforward way to find the volatility contraction(squeezing) and expansion using the Bollinger Bands and Keltner channels.
Features
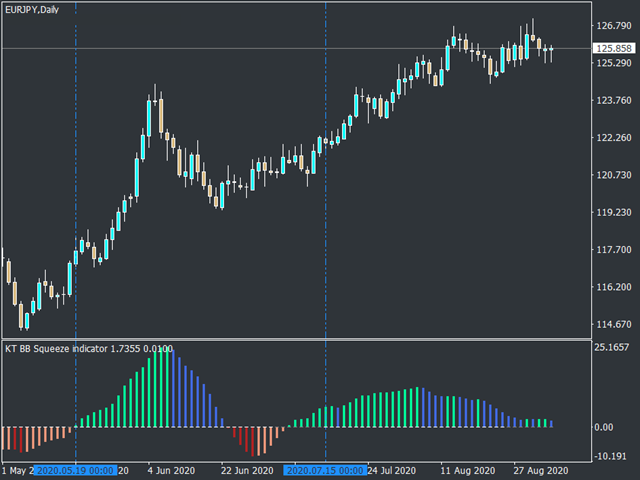
- It marks the potential entry points by placing vertical lines when the entry conditions match.
- Unlike the other BB Squeeze, this one is light, full of features, and coded from scratch.
- All kinds of Metatrader alerts for entries as well as for exits(fading momentum).
Methodology
If Bollinger Bands are inside the Keltner channels, the market is likely to be in a phase of consolidation and low volatility. If Bollinger Bands are outside the Keltner channels, the market is likely to be in a phase of trending and high volatility.
Using this methodology, we can go long when Bollinger Bands come out from Keltner channels, and the momentum oscillator is above the zero line. Similarly, we can go short when Bollinger bands come out from Keltner channels, and the momentum oscillator is below the zero line.
- The gray dots represent the period of low volatility when Bollinger Bands are inside the Keltner channels.
- The white dots represent the period of high volatility when Bollinger Bands are outside the Keltner channels.
