MQLplus Charting
- Utilitários
- Dominik Egert
- Versão: 1.93
- Atualizado: 19 março 2022
- Ativações: 20
MQLplus Charting
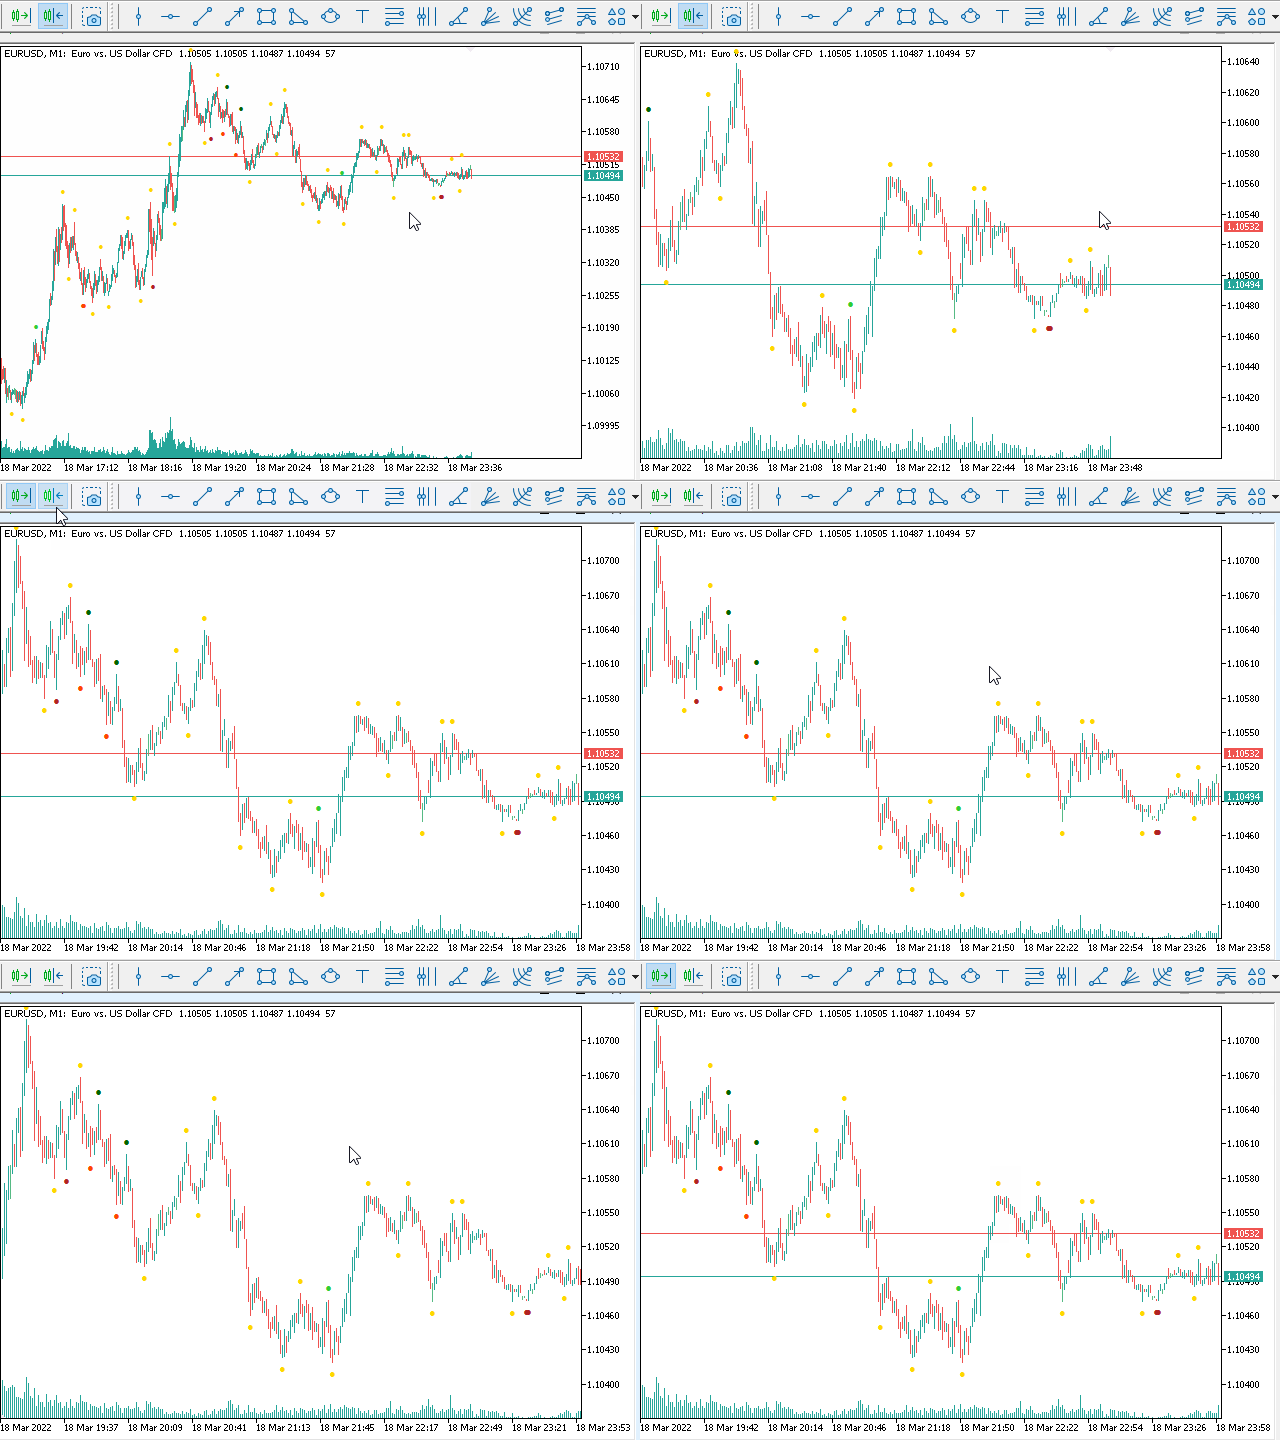
Inspired by good charting solutions available on the web, this utility finally brings some neat features to MT5 to make charting fun again.
Current version supports following features:
- Free floating charts, similar to Tradingview
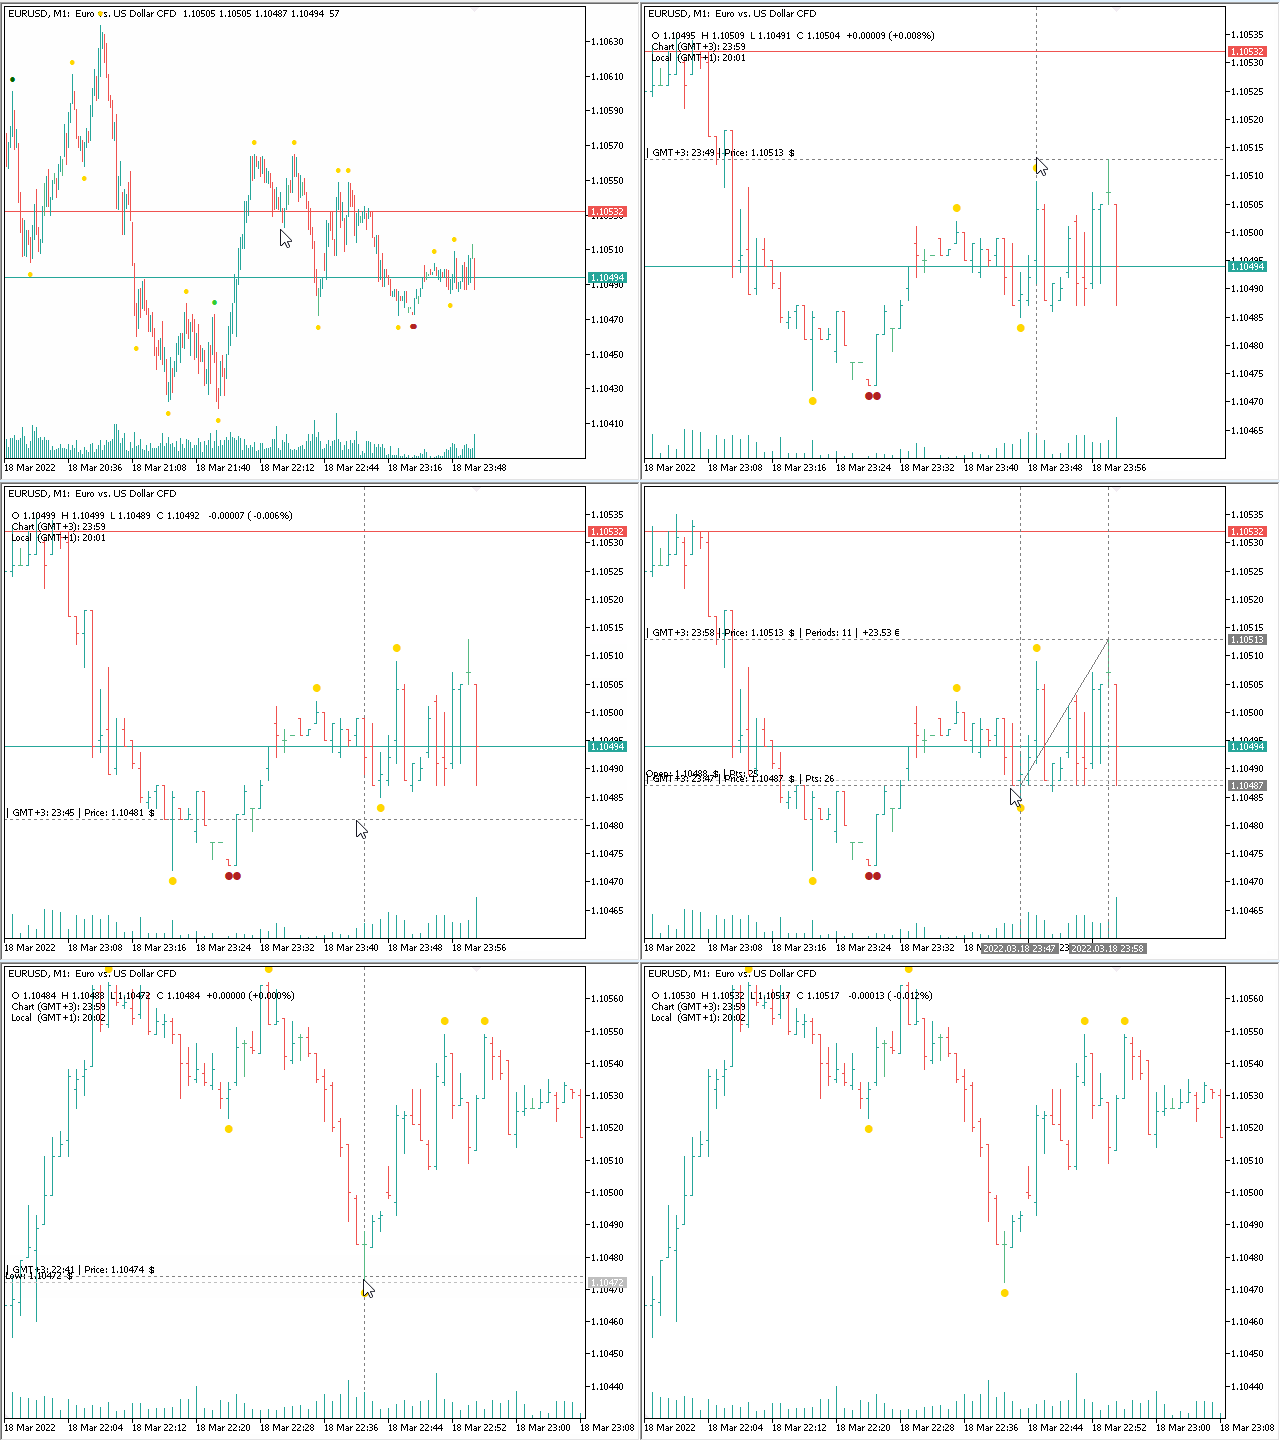
- A sophisticated Cross-Hair, with detailed data display
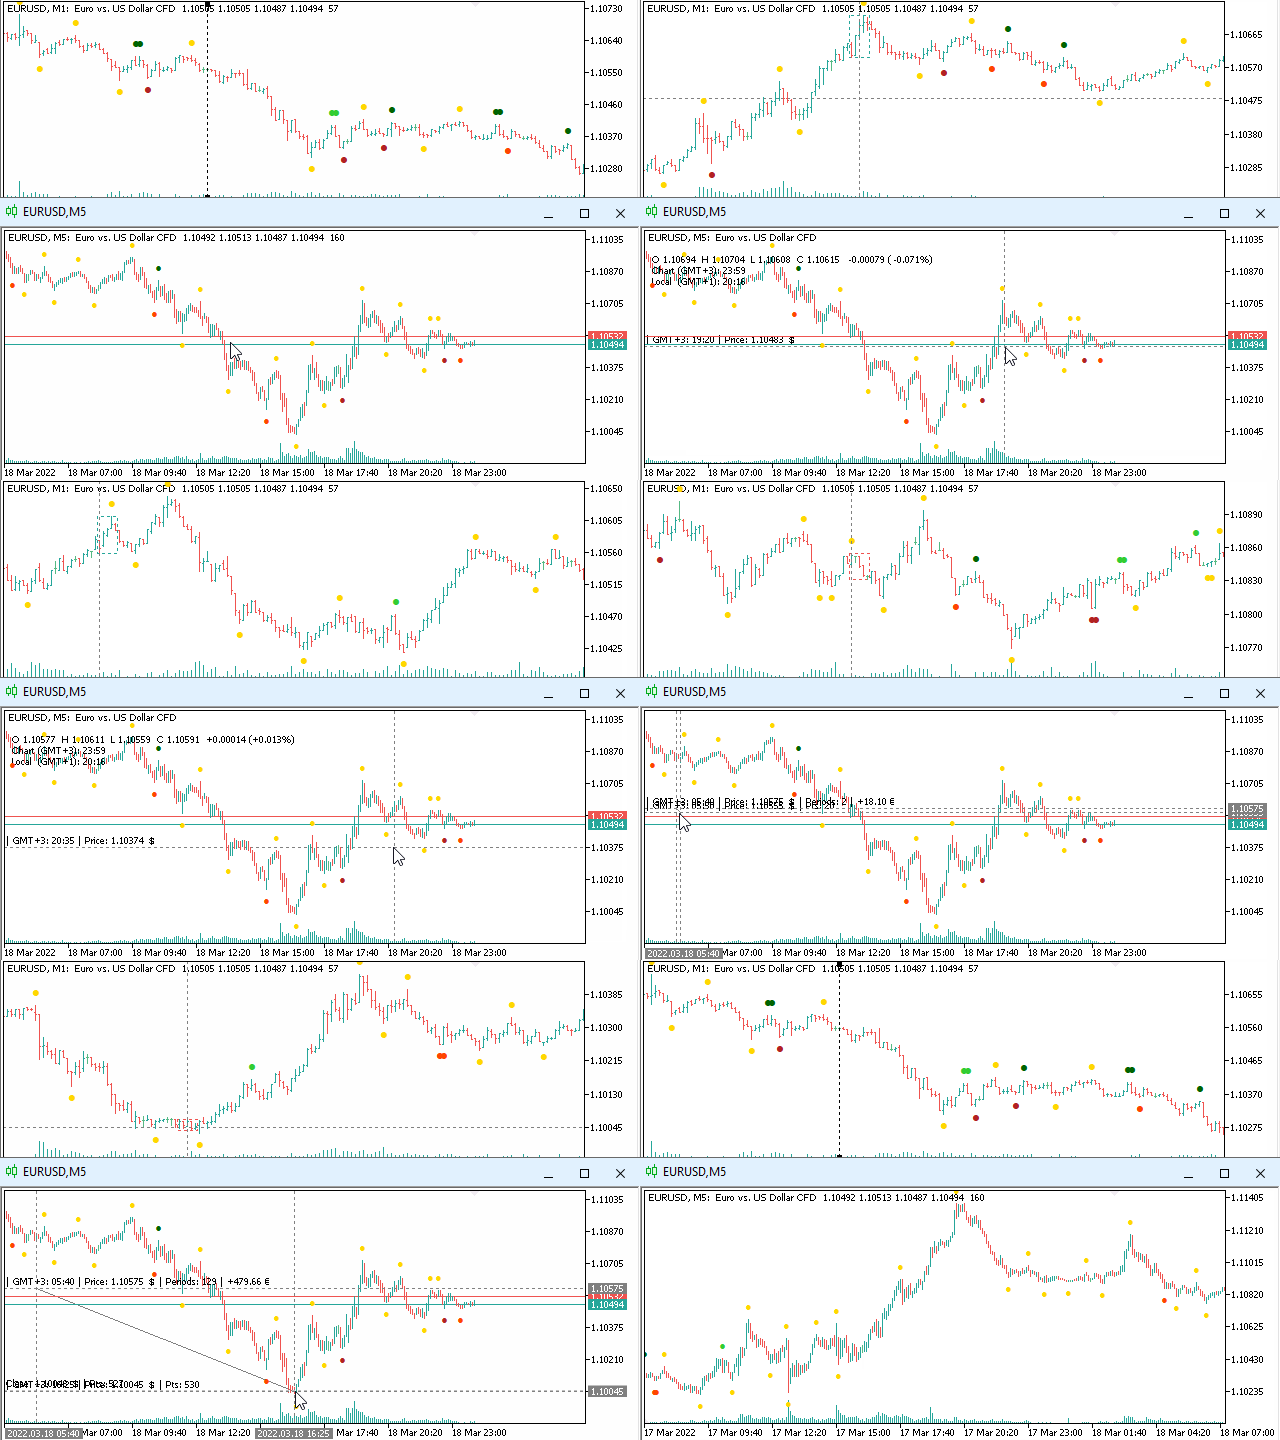
- Multi-Chart Cross-Hair sync function
- Measurement tool, showing account currency, points and period count as results
- Speed-Scrolling to move fast through markets history
- Snail-Scrolling to push single bars outside the visible area
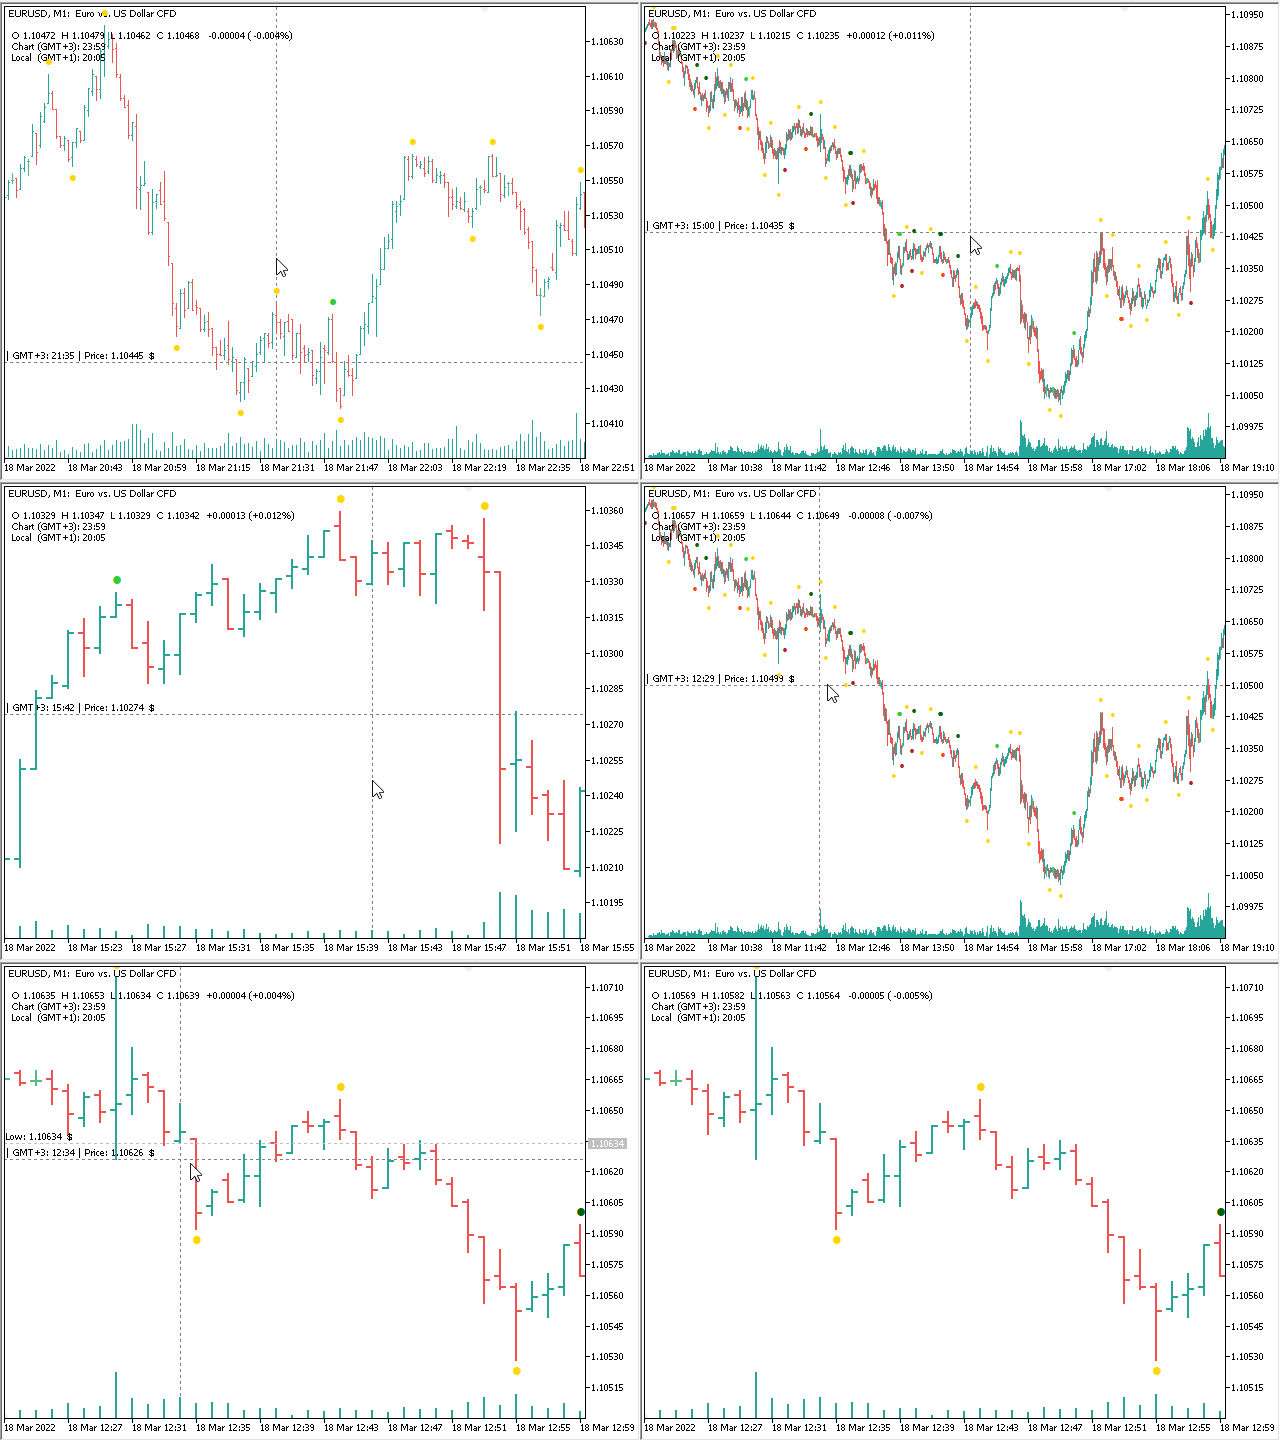
- Mouse pointer focused zoom in and out
- OHLC Data displayed in upper left corner of chart
- Local and Chart times, including GMT offset
- Repetitive drawing, easily redraw objects like trendlines, rectangles and other
- Drag rectangles on all corners
- Autoalign drawn objects to charts price and time values
- Automatic Front-Market mode
User support channel: MQLplus user support Channel
Detailed description: Manual and Blog post
Free floating charts
Usage: Press and hold the SHIFT-key on your keyboard.
Chart will switch into free floating mode, you can drag the chart as you like, in any direction.
Cross-Hair tool
Usage: Activate by pressing once the 'F' key on your keyboard.
Cross-Hair will show up and stay enabled until you turn it off by pressing the 'F' key again. It does not interfere with the builtin Cross-Hair from MT5.
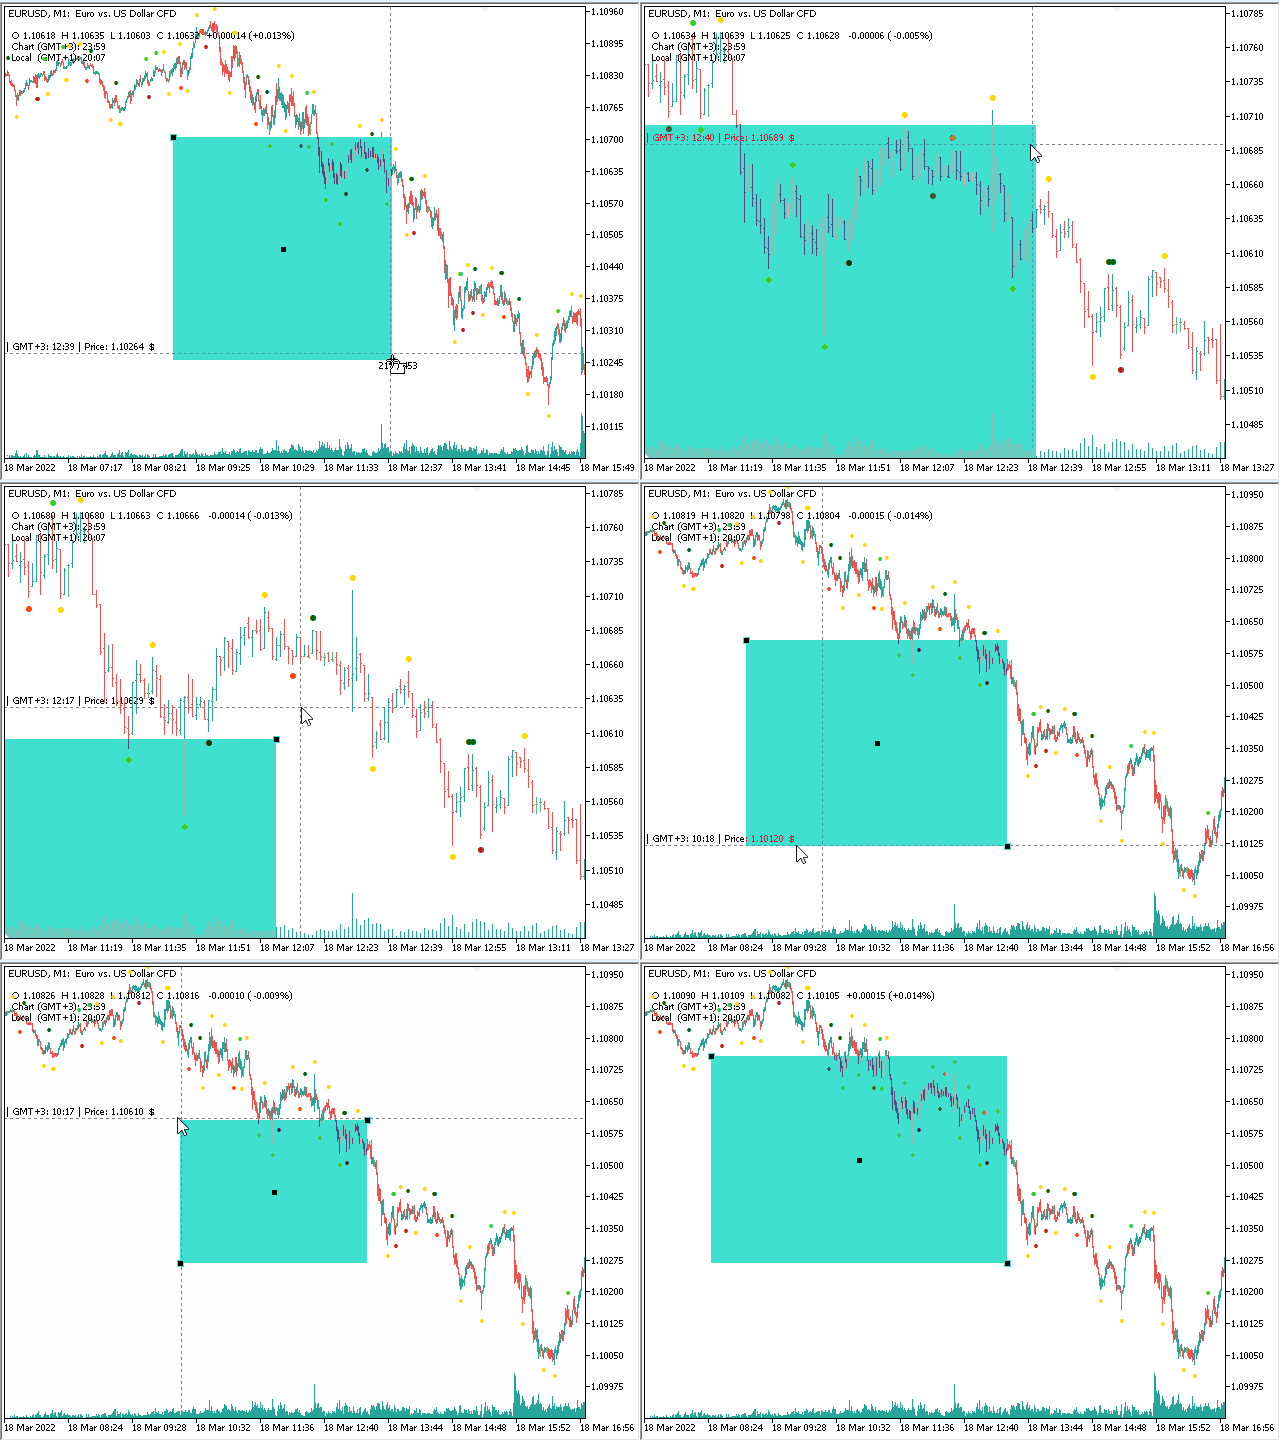
Measuring the chart is done by pressing the right mouse button, then moving the mouse to where you want to go.
As the Cross-Hair gets closer to a current bar, a magnetic line will be displayed.
While the Cross-Hair is active, OHLC and Time details are displayed in upper left corner of the Chart.
Speed-Scrolling
Usage: Activate Speed-Scrolling-Mode by pressing and holding TAB on your keyboard, then start scrolling with the mouse wheel.
Once engaged, the mode will stay on, even if you stop holding the TAB-Button. You can easily recognise Speed-Scrolling is active by the display of date and time.
Snail-Scrolling
Usage: Activate Snail-Scrolling by pressing and holding the SHIFT-Button on your keyboard.
Snail-Scrolling is also available while in Free-Float-Mode, this way you can move the chart very precise to your exact location.
Focused Zoom
Usage: Activate Focused Zoom by pressing and holding CTRL-Button, now scroll with the mouse wheel to change the zoom level.
Very useful to zoom in and out on the chart at the location of your choise.
Repetitive Drawing
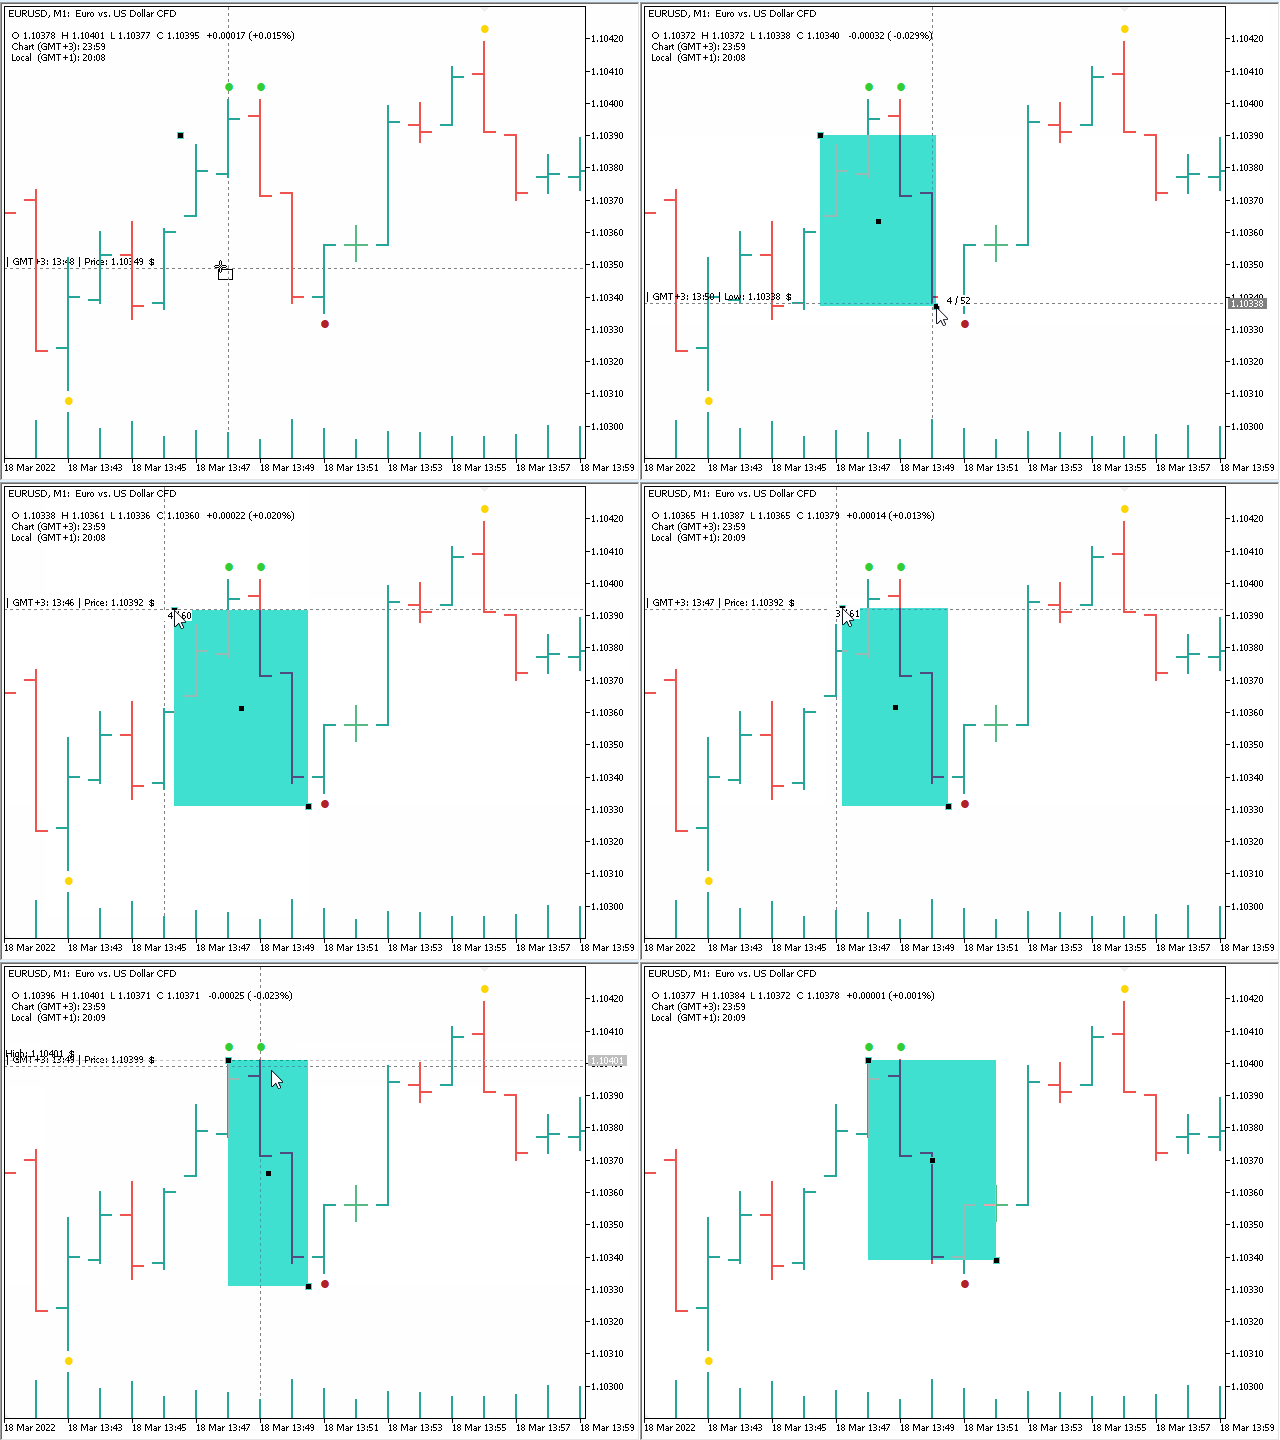
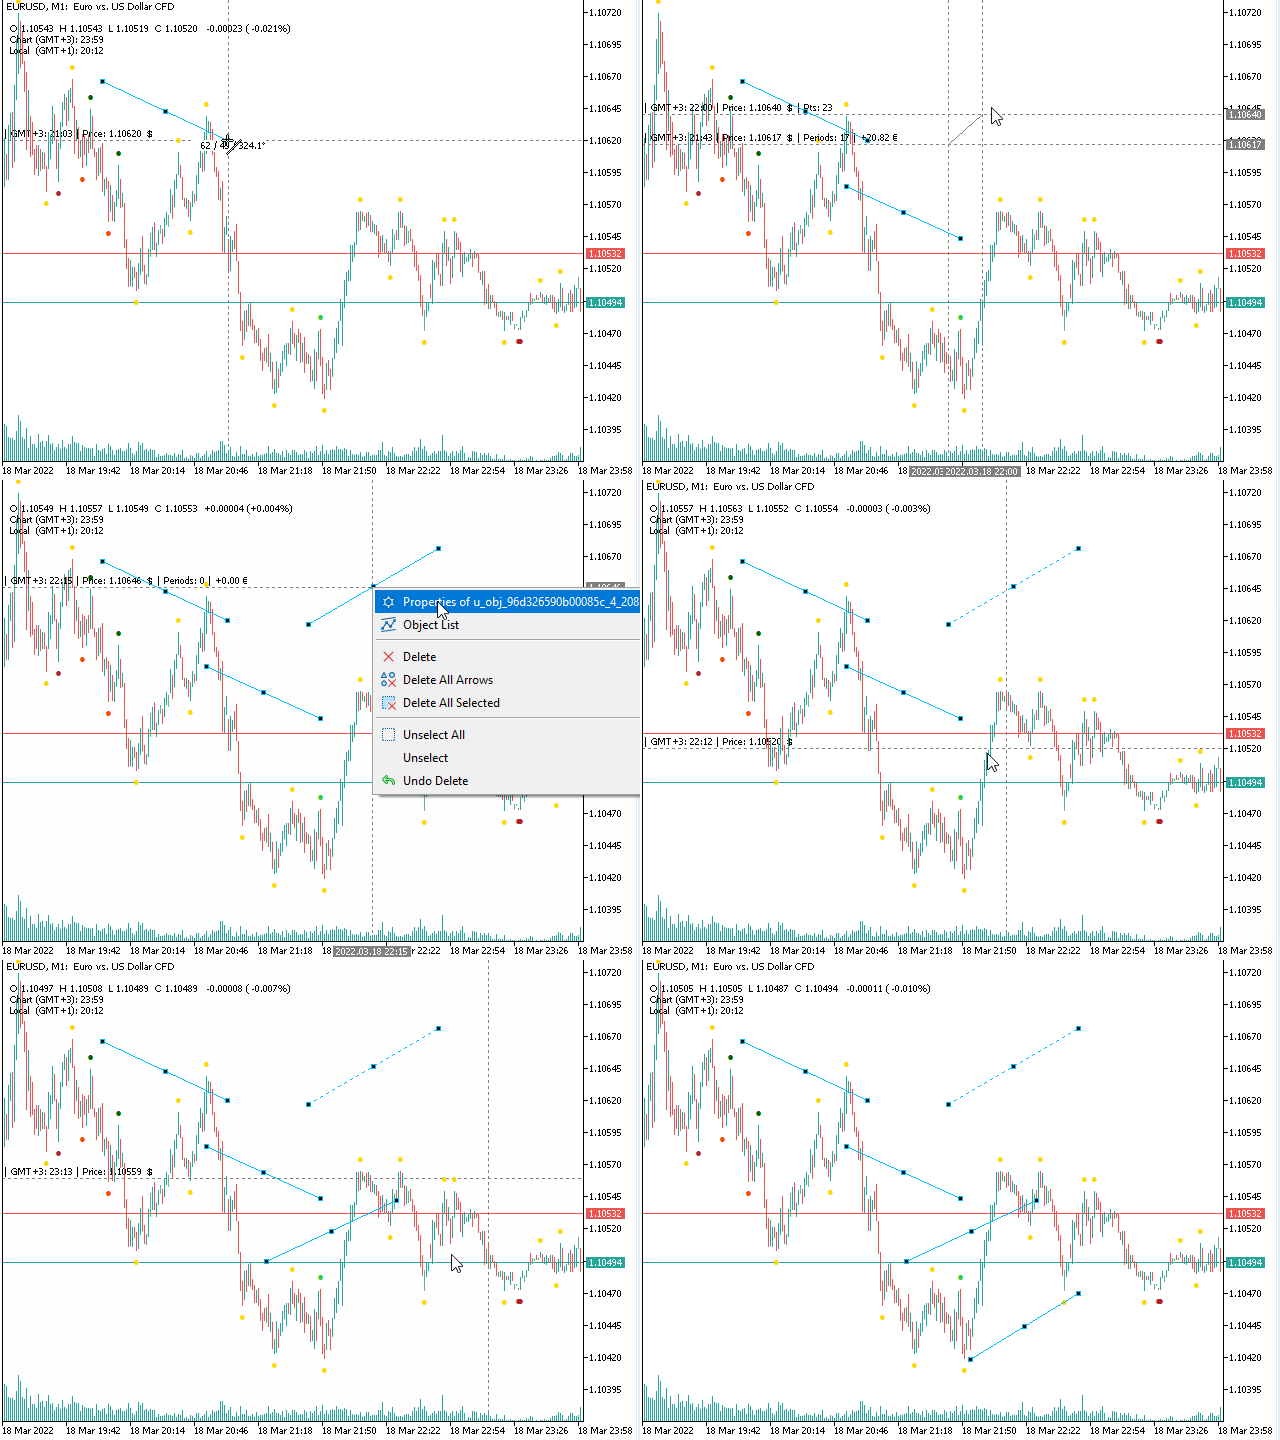
Usage: While measuring with the Cross-Hair and still holding the right mouse button down, press the left mouse button once.
This will draw the template object with the dimensions of your measurment.
Once you manually create a new object, it will be used as new template.
Very useful for repetitive drawing jobs on the chart.
Front-Market-Mode
Usage: Scroll to the most recent position on the chart.
This will turn on ASK and BID-Lines and will keep the chart pushing to the most recent bar. Once scrolling away from the "front", the Bid and Ask Lines will disapear and the chart will not jump to the front anymore.
Fractals Indicator
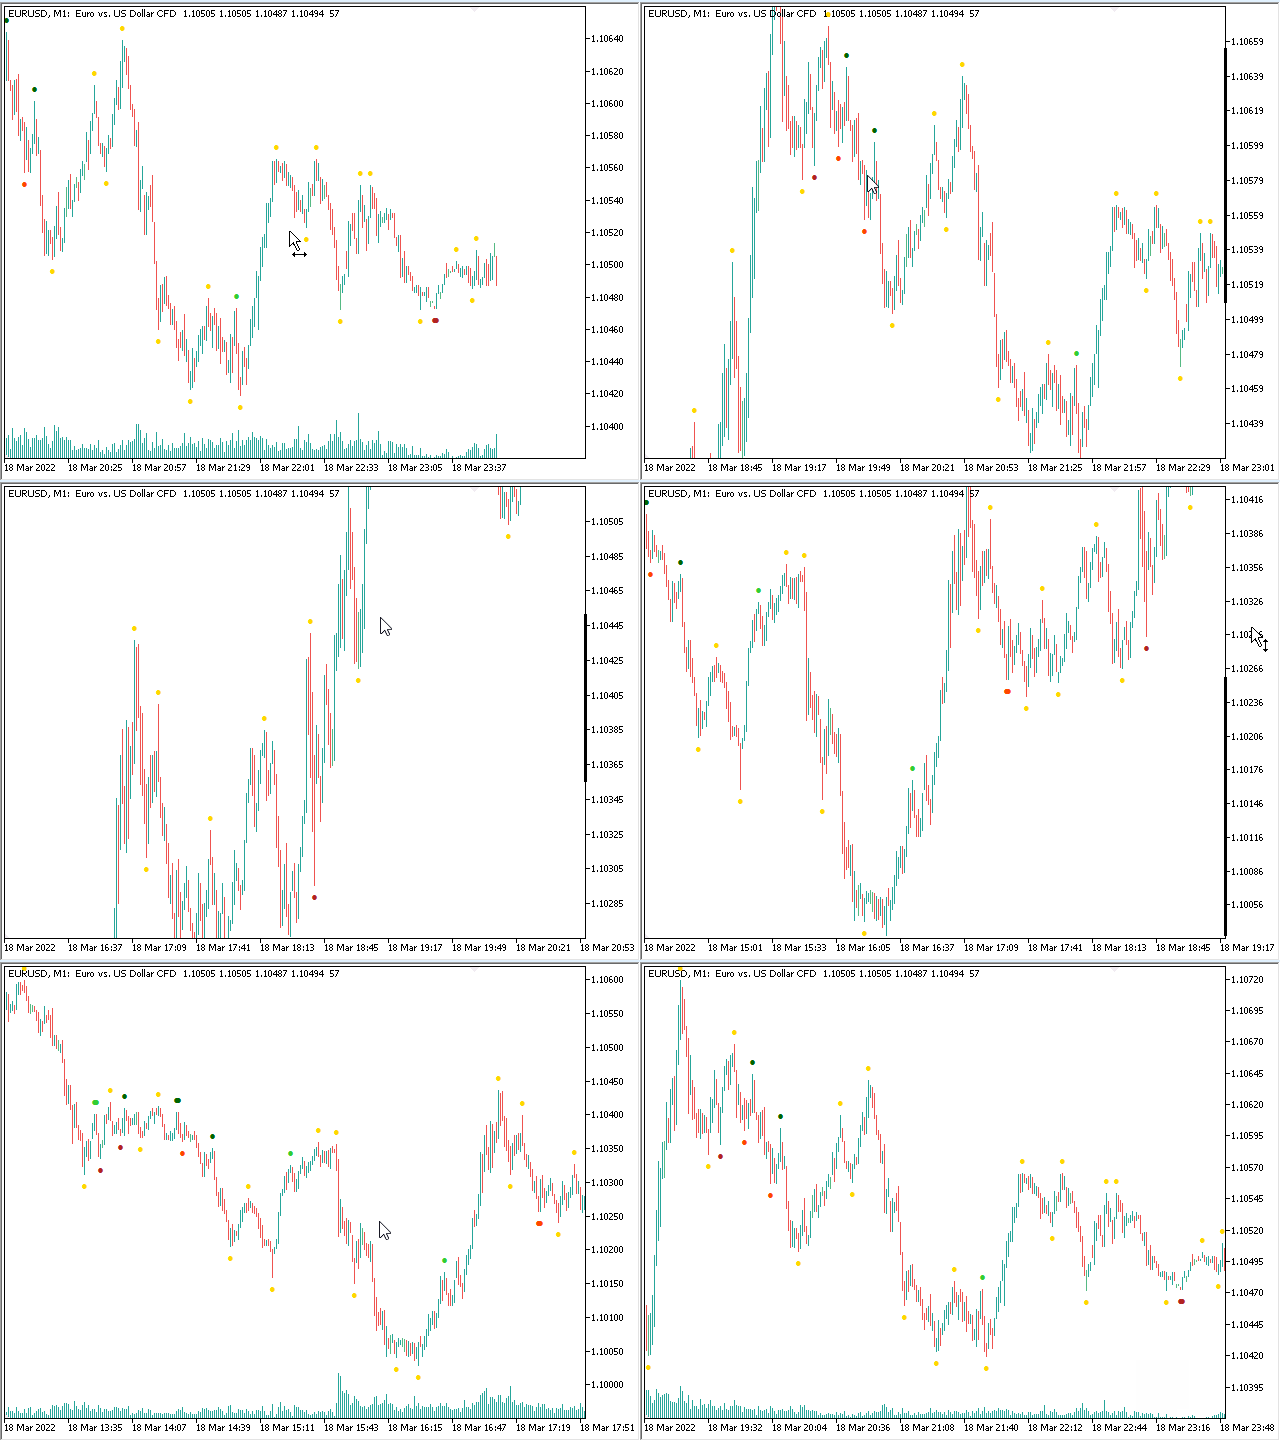
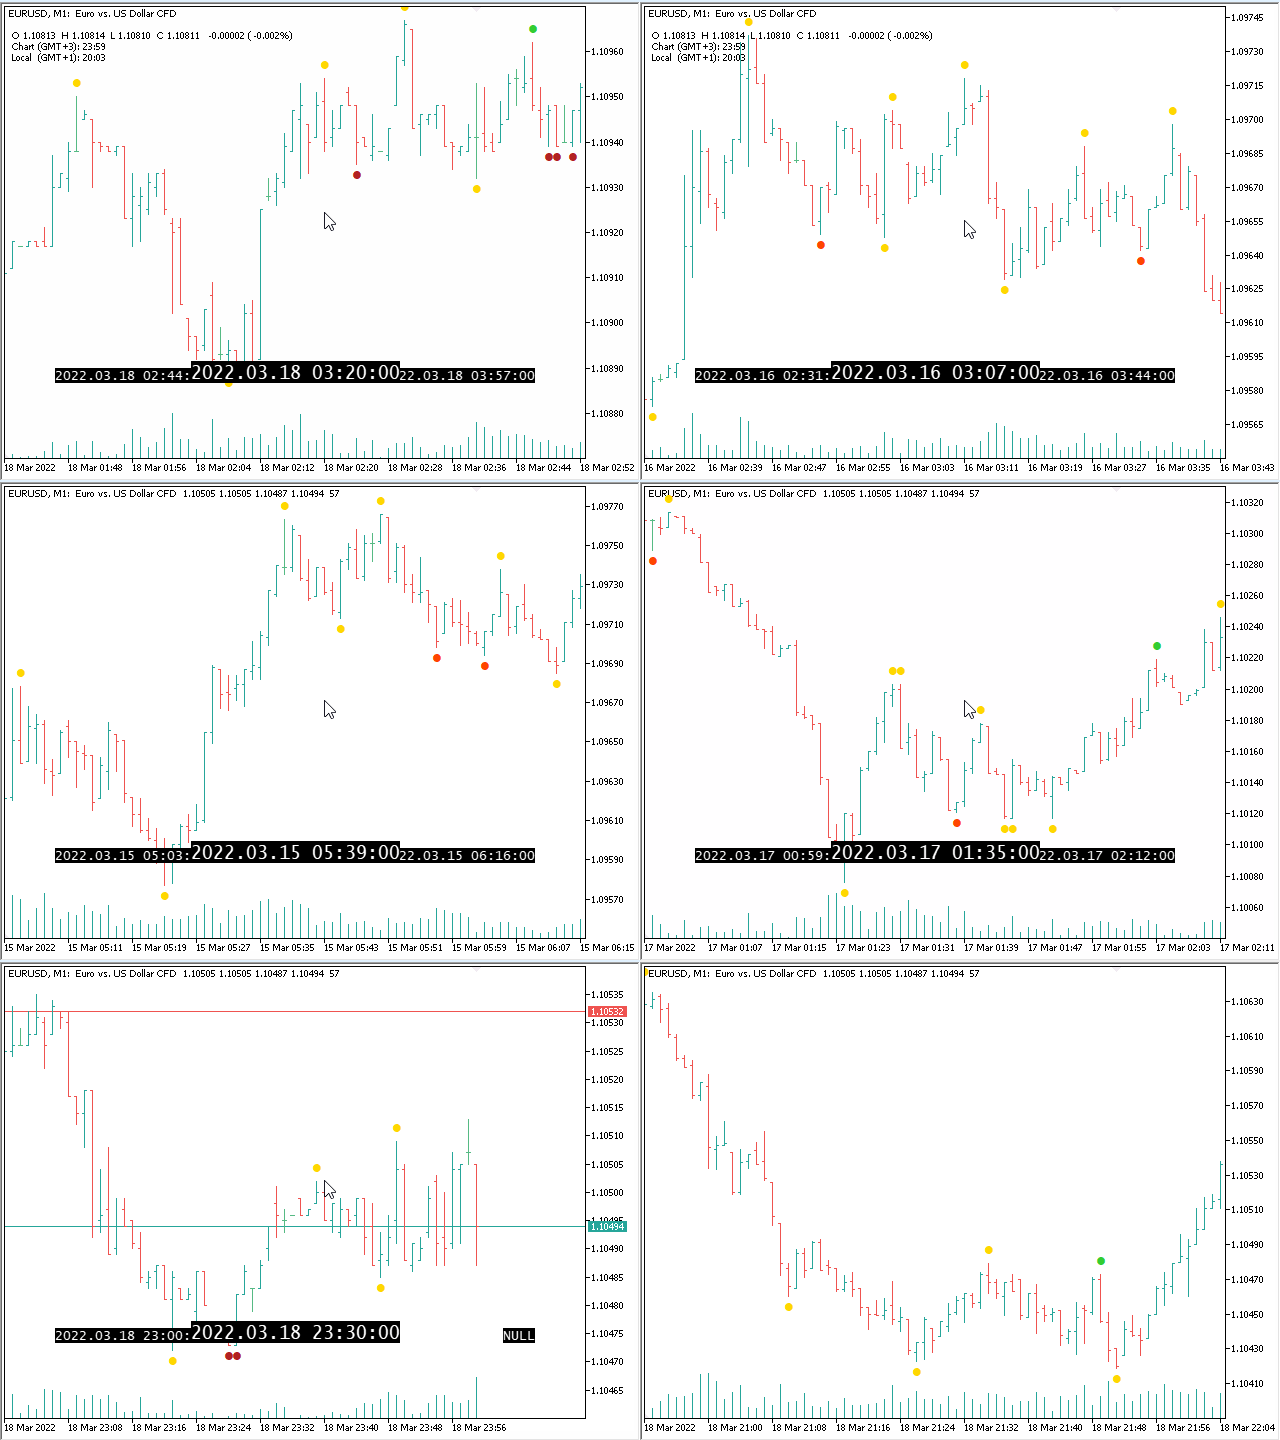
This Utility has two fractals indicators included, with the ability to set the periods of consideration individually. In case both fractal types fall onto the same bar, the color will (by default) change to Gold.
Data-Feed-Verification
Also included is a data feed verification indicator, which shows price and time gaps in the market's data-feed.
#tags chart,freefloat,free floating,floating,charting,cross hair,crosshair,sync,multi chart crosshair,multichart crosshair, multi chart cross hair,multi chart crosshair,mtf,multi time frame,scroll,scrolling,fastscroll,fast scrolling,slowscroll,slow scrolling,draw,drawing,front market,autoscroll,rectangle,measure,measurement,zoom,focused zoom,OHLC data,open high low close,times,gmt,timezone,front market,tradingview, trading view,guidants,trendspider,robinhood,quadency,protrader






















I previously wrote that the indicator has bugs.
Now I sat down with Dominik and we found the errors together and were able to find out right away that it was my connection to the server (I have my Metatrader running on a server). I've always had an RDP connection to the server with no restrictions.
Error was, Microsoft didn't pass the key commands correctly.
Now I have an RDP connection from Parallels.
So the MQL Chart indicator is very well programmed and everything works very well.
Thank you Dominic for your work
greeting
Tomreo