• Visão global
  • Comentários (10)
  • Discussão (42)
  • O que há de novo

News impact

4.67

Choose the best trading tool: The impact of news on the exchange rate of a currency pair!

As a news source you can use: Terminal calendar or Investing.com website

In the second case, you will additionally need the Get News5 utility.

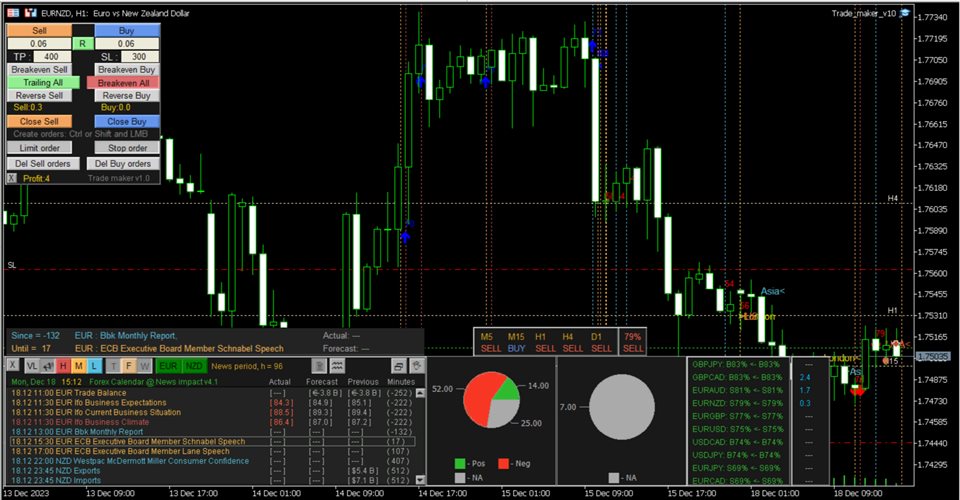
The indicator combines well with the Trade maker utility, providing multi-currency trading.

Calculates:

  • indices of the impact of current news on currency pairs, taking into account market expectations.
  • actual trend directions for 5 customizable timeframes and levels of change in trend direction
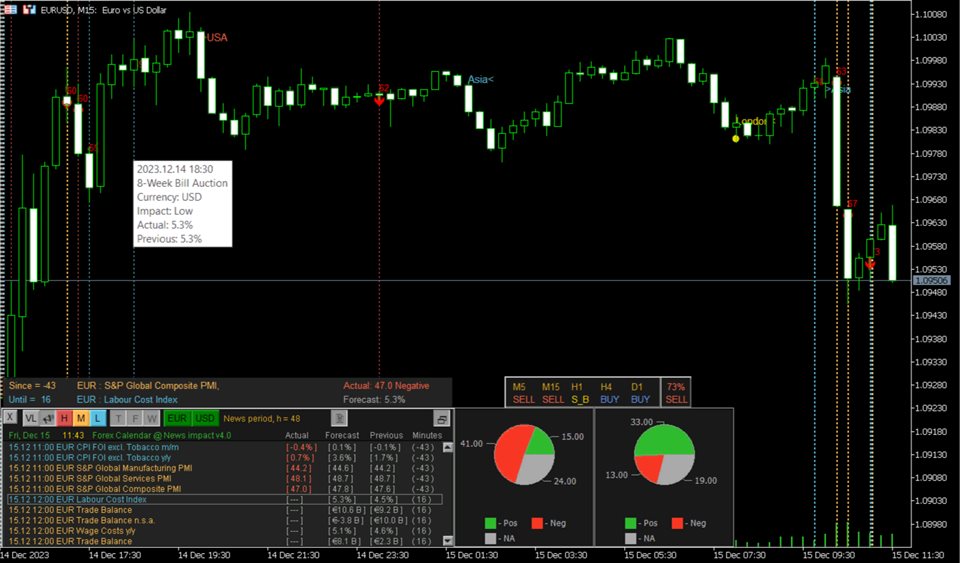
  • time elapsed since the publication of the next news and time remaining until the next one is published
  • writes a file with a news table in CSV format for the specified date interval
Current news values are analyzed based on their impact on the currency to which they relate.
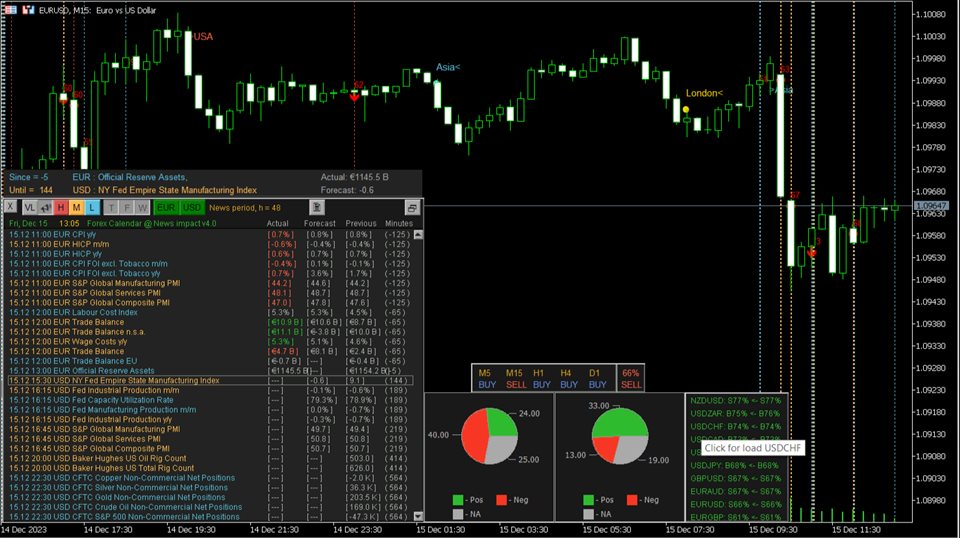
The published current value of the news has a characteristic impact on the currency it relates to: positive, negative, neutral . The indicator summarizes all these values for the selected period, taking into account the importance of the news: high, medium, low and displays it on a graph in the form of a pie chart.

This allows you to make a forecast of exchange rate movement if one symbol has more positive news and the other has more negative news.

Uses the built-in news calendar of the MT5 terminal and does not require additional settings.

The indicator selects news based on the chart symbol or the specified value of the Currency pair news parameter, plus displays analysis on 16 pairs.

The Low, Medium, High buttons set the news filter by importance.

The Now, Today, Week buttons set the depth of the period of looking back to calculate the impact of current news values.

The influence rating panel (appears by clicking on the corresponding button) analyzes 12 currency pairs: EURUSD, GBPUSD, AUDUSD, NZDUSD, USDJPY, USDCHF, USDCAD, EURGBP, EURJPY, EURCAD, GBPJPY, plus the one to which the indicator is attached.

To change the news of the current currency pair to the news of another currency pair, just click on the corresponding line of the influence rating panel.

Allows you to find a currency pair whose rate is more likely to move under the influence of news

On the right you can open an additional Trading panel showing profit for the symbols of a given Magic number for multi-currency trading

There is a sound notification about the occurrence of news in the form of the spoken word “News”.

Markers for the beginning and end of trading sessions are displayed on the chart:

  • London
  • New York
  • Tokyo

Vertical lines of news released at the same time will be displayed on the chart with some offset.

To do this, set Options->Charts->Precise time scale in the terminal

Can be attached to any chart with any time frame.

If you purchased my indicator:

  • Your wishes will be taken into account when developing new versions
  • Tell your friends about it, because if they buy it, it will develop and improve

Parameters

Has Scale and markup =100% parameter for adjusting the interface on high-resolution monitors (100%, 125%, 150%, 175%, 200%).

Currency pair news = ""; // The entered value is used to display news; if not specified, then the symbol of the current chart

The value of the news impact filter, % = 60; // If the value of the news impact index is greater than the specified value, the corresponding arrow is displayed on the chart

. . . . . . . . . .

Comentários 10
Fabrizietto71
1121
Fabrizietto71 2024.04.16 02:35 
 

The product is well and carefully made. The developer's assistance is always timely and present. It proves to be very useful to have an overview regarding events that are upcoming. Very satisfied. We also optimized some settings together. I would add that Aleksander is always available and ready to make further improvements and changes.

220072256
4226
220072256 2024.03.08 12:59 
 

This fantastic news indicator is a staple of my trading

Matthew Phillip Clarke
330
Matthew Phillip Clarke 2023.12.08 10:08 
 

This tool has improved my trading so much, as now I am not wasting my time in markets that are too volatile during news times, it's the first template I open in the day before trading.

Produtos recomendados
ToolBox 360 is the swiss knife of all indicators. It is full packed with useful tools to help you with your trading. It can be used to find best entry and exit points and help you to decide if you should open a trade or not. It shows market trends, candlestick formations outside / inside bars and you can sett time based allerts. Main features: Time based Fibonacci lines Choose a start and end time and the indicator shows you Fibonacci lines within the selected time range including range high a
This product is designed for the MT5 platform and offers two key features: VWAP (Volume Weighted Average Price) calculation and Volume Profile analysis. Advantages: VWAP Calculation: The product calculates the VWAP, which is a popular indicator used by traders to determine the average price of a security based on its trading volume. It helps identify potential buying or selling opportunities by comparing the current price to the average price weighted by volume. Volume Profile Analysis: The prod
RAD CRITICAL LEVES RAD indicator tracks “Relevant Volume” in real time, identifying accumulation and distribution processes, projecting them in the chart as SUPPORT or RESISTANCE zones. Natural   support   and resistance levels are generated by Volume Accumulation and Distribution processes. As these processes evolve, levels at which the relevant volume in the market place is positioned, become difficult areas to cross upwards or downwards. By using this information, traders can identify very s
Market session with fibonacci
Batsukh Sumchin Khuyagbaatar
Este indicador é o indicador mais comum que utilizamos todos os dias, incluindo as nossas estratégias mais utilizadas, ICT e SMC, limites de stop loss e limites de liquidez que ocorrem nos horários de abertura e fecho das bolsas, bem como o volume de bolsas com Fibonacci e zoom in e out, e as ações mais comuns que deseja ver, como selecionar o movimento da bolsa que deseja ver e puxar Fibonacci, são indicadores totalmente automáticos que lhe permitem ver as ações mais comuns que deseja. Tenho 10
Tik Tok
Ivan Simonika
The Tik Tok indicator was created on the basis of the original extreme search indicators, the indicator is well suited for determining a reversal or a big sharp jerk in one direction, thanks to it you will know when this happens it will notify you when a blue dot for buying red for sale appears. It basically uses the process of detecting the rate of change in price growth and allows you to find entry and exit points from the market. fundamental technical indicator that allows you to assess the
VWAP Indicator MT5
Kyra Nickaline Watson-gordon
Description : VWAP (Volume-Weighted Average Price) is the ratio of the value traded to total volume traded over a particular time horizon. It is a measure of the average price at which pair is traded over the trading horizon. Read More. All Symbols and All Timeframes are supported. Indicator Inputs :     VWAP Mode : Mode of VWAP Calculation. Options can be selected : Single,Session,Daily,Weekly,Monthly     Volumes : Real Volumes,Tick Volumes     Price Type : Used price for calculating. O
Introducing RSIScalperPro - the revolutionary RSI-based indicator for Metatrader 5, specifically designed for scalping in the one-minute chart. With RSIScalperPro, you'll have a powerful toolkit for precise entry and exit signals to take your trading to the next level. RSIScalperPro utilizes two different RSI indicators that provide clear signals for overbought and oversold areas. You can customize the time periods and limit values of the two RSIs according to your preferences to achieve the be
Hello ! If you scroll in one chart, all charts will be scrolled If you change the time frame in one chart, it will change in all charts Of course, you can turn this feature on or off All the charts in which you want changes to be applied are specified through ID in the indicator settings You can scroll the charts of different time frames in two ways at the same time 1: Coordinated based on time That is, 1 hour candle is 60 candles one minute back 2: scroll in the form of number of candles That i
White Weis Volume Ticks
Ricardo Almeida Branco
5 (4)
White Weis Volume Este indicador mostra o somatório do volume em cada onda, bulish ou bearish, conforme idealizado por David Weis, mas traz um importante adicional que é a marcação da barra de maior volume da onda (White Bar)! Na codificação do indicador, foi buscado otimizar o código para exigir o mínimo processamento durante o uso e não sobrecarregar o mt5. O indicador pode ser usado para análise e estudo pré pregão, onde o trader analisa possíveis pontos de suporte e resistência com base
Индикатор Magneto Weekly Pro отображает: Недельные важные линии поддержки и сопротивления (выделены желтым, красным и синим цветами). Основные недельные цели (выделены белым цветом). Недельные паттерны возврата цены (обозначаются красными флажками). Применение индикатора Magneto Pro можно использовать и как дополнение к существующей стратегии, и как самодостаточную торговую стратегию. Данный продукт состоит из двух индикаторов, работающих на разных временных промежутках, и предназначен для скал
VWAP Bands
Rafael Caetano Pinto
Esse indicador utiliza o VWAP e projeta esse VWAP em até 3 níveis, deslocados por uma porcentagem do símbolo do gráfico. Como configurar: Escolha o símbolo e o tempo gráfico desejado Configure a hora de início do símbolo (na bovespa, o WIN e o WDO iniciam as 9hrs). Esse horário é utilizado como referência de corte para o VWAP. Verifique qual período de VWAP se adequa melhor ao gráfico: O ideal é um período que o VWAP não se distancie muito do gráfico Configure os níveis de porcentagem: O ideal
Este indicador é baseado na transformada discreta de Hartley. O uso dessa transformação permite aplicar diferentes abordagens ao processar séries temporais financeiras. Uma característica distintiva deste indicador é que suas leituras não se referem a um ponto no gráfico, mas a todos os pontos do período do indicador. Ao processar uma série temporal, o indicador permite selecionar vários elementos da série temporal. A primeira possibilidade de filtragem baseia-se nesta abordagem - todos os comp
Adjustable Consecutive Fractals  looks for 2 or more fractals in one direction and sends out a on screen alert, sound alert and push notification, for strong reversal points . Adjustable Consecutive Fractals, shows the fractals on chart along with a color changing text for buy and sell signals when one or more fractals appear on one side of price. Adjustable Consecutive Fractals is based Bill Williams Fractals . The standard Bill Williams fractals are set at a non adjustable 5 bars, BUT withe th
Predator Genesis
Dragan Drenjanin
Introduction to Predator Genesis EA Predator Genesis, version 1.2, is a cutting-edge Expert Advisor (EA) developed for the MetaTrader 5 (MT5) platform, representing the latest evolution in automated forex trading.  Predator Genesis   is designed to simplify the trading process while maintaining robust performance. Its minimalist user interface, a hallmark of version 1.1, reflects a design philosophy of simplicity within complexity, ensuring accessibility without sacrificing depth. This version
GRat Clusters  is an indicator that shows various data in the form of clusters on a price chart: volume, delta, ratio of sales and purchases, etc. It allows you to visually see the market profile in real time and on history at a given depth. Capabilities 1.8 types of cluster data: volume, delta, purchases   and sales , volume and delta, imbalance between sales and purchases , volume profile, delta profile, buy and sell profile. 2. A cluster period can be either any available in MT5 timeframe or
Session Volume Profile  is an advanced graphical representation that displays trading activity during Forex trading sessions at specified price levels. The Forex market can be divided into four main trading sessions: the Australian session, the Asian session, the European session and the favorite trading time - the American (US) session. POC  - profile can be used as a support and resistance level for intraday trading. VWAP  - Volume Weighted Average Price. ATTENTION  ! For the indicator to w
Ao analisar séries temporais financeiras, os pesquisadores geralmente fazem uma suposição preliminar de que os preços são distribuídos de acordo com a lei normal (Gaussiana). Essa abordagem se deve ao fato de que um grande número de processos reais pode ser simulado usando a distribuição normal. Além disso, o cálculo dos parâmetros desta distribuição não apresenta grandes dificuldades. No entanto, quando aplicada aos mercados financeiros, a distribuição normal nem sempre funciona. Os retornos do
El indicador "Mega Spike Boom and Crash" es una herramienta diseñada para su uso en los índices sintéticos, específicamente en los pares Boom y Crash. Su propósito principal es identificar y trazar zonas que funcionan como niveles de soporte y resistencia en distintas temporalidades. La temporalidad mas recomendada para usar este indicador es en el marco de tiempo de 5 minutos  El precio de apertura de ( 1 H , 15 M , 30M )   horas  son los niveles de precios más importante del día. Representa e
Hi there! Since I am starting commercial and non-commercial product publishing I would highly appreciate: If you like this product, please rate it. That will help to promote not only this product, but indirectly another ones. So, such promotion will help to make some money from commercial products. Thus, I will have opportunity to fund my another directions of trading researches like bot development using mql4 and mql5 programming languages as well as python written products like crypto bots. If
DYNAMIC SR TREND CHANNEL Dynamic SR Trend Channel is a simple indicator for trend detection as well as resistance/support levels on the current timeframe. It shows you areas where to expect possible change in trend direction and trend continuation. It works with any trading system (both price action and other trading system that use indicators) and is also very good for renko charting system as well. In an uptrend, the red line (main line) serves as the support and the blue line serves as the r
Unlock the power of Fibonacci with our advanced indicator! This tool precisely plots Fibonacci levels based on the previous day's high and low, identifying the next day's key support and resistance levels. Perfect for day trading and swing trading, it has consistently generated weekly profits for me. Elevate your trading strategy and seize profitable opportunities with ease. NOTE: In the Input section make sure the draw labels are set to "True" so you can see each levels.
Rejection Block
Usiola Oluwadamilol Olagundoye
5 (1)
The "Rejection Block" MetaTrader 5 Indicator offers traders a comprehensive tool for identifying and visualizing rejection candlestick patterns, commonly known as rejection blocks. These patterns are pivotal in discerning potential market reversals or continuations, making them invaluable for traders seeking to enhance their analysis. Key Features: Rejection Block Detection: The indicator diligently scans price data, pinpointing instances of rejection candlestick patterns. These patterns typical
FREE
Visual guide which divides the 24 hours into three trading sessions. The default setting is to show Asian , London and New York sessions. But, the session start and end hours can be adjusted as required.  The indicator is useful to develop trading strategies by making it easy to see the market behavior during the three sessions.  Inputs Time Zone Start and End hours (Please provide values in HH:MM format, like 02:00, not like 2:00. Both the hours and minutes should have 2 digits) Time zone ba
Introducing the "Bull vs Bear Price Strength Oscillator" Indicator: Your Key to Smart Trading Decisions! Are you looking for a trading tool that can provide you with a clear and visual representation of price trend strength? Look no further! The Price Strength Indicator is here to transform the way you analyze the markets and make trading decisions. Uncover Hidden Market Strength: The Price Strength Indicator is designed to help you assess the market's momentum with ease. It does this by evaluat
G-Labs Market Maker Dashboard - Exclusive Seasonal Offer Elevate your trading with the original G-Labs Market Maker Dashboard, available for a limited time at just $70 USD. Ideal for starter traders, this dashboard has been enhanced with new features and now includes a comprehensive training video. This indicator is for people trading the market makers method and is the entry level dashboard for that strategy is available for both mt4 and mt5. its a market scanner in real time showing peak forma
Value Chart Candlesticks
Flavio Javier Jarabeck
4.73 (11)
The idea of a Value Chart indicator was presented in the very good book I read back in 2020 , " Dynamic Trading Indicators: Winning with Value Charts and Price Action Profile ", from the authors Mark Helweg and David Stendahl. The idea is simple and the result is pure genius: Present candlestick Price analysis in a detrended way! HOW TO READ THIS INDICATOR Look for Overbought and Oversold levels. Of course, you will need to test the settings a lot to find the "correct" one for your approach. It
FREE
Você utiliza o volume na sua leitura do mercado? Certamente muitos traders usam, e não se imaginam operando sem ele. O indicador Color Histogram Volume Set permite que o usuário escolha o valor que ele considera interessante para monitorar. Ao ultrapassar este você terá a confirmação visual e se quiser terá também o alerta sonoro que é dado pelo indicador. Claro que existem outras maneiras de tentar encontrar um volume elevado, como avaliar se o v olume está acima da média, se é o maior volum
Intraday Vwap Orion
Joao Paulo Botelho Silva
Fundamentação teórica A VWAP é uma média móvel ponderada pelo volume, trazendo maior relevância para os preços. O cálculo base da VWAP segue a fórmula clássica descrita no Investopedia ( https://www.investopedia.com/terms/v/vwap.asp ). VWAP = sum(typical price[i]*volume[i]) / sum(volume[i]) Funcionalidades A VWAP Orion inova ao permitir que o usuário escolha dentre os convencionais períodos Diário, Semanal e Mensal, tendo também a opção de cálculo do indicador Intraday, como utilizado em outro
VWAP with more settings
Maria Cristina Sabatini
I developed this vwap with more settings in order to be customized as much as possible.  VWAP is a really strong indicator for your trading. It can be used to check if the market is in balance or ranged, and also you can use the levels as support/resistence/target.  In the pictures you can see the main settings, and you can select the use of real volume from the broker. Hope you will find it useful. Many thanks in advance.  
This Indicator adding power to traditional zigzag indicator. With High-Low numbers in vision it will be easier to estimate change of trend by knowing the depth of each wave. Information including points, pips, percentage%, and #bars can be displayed based on configuration. All information is real-time update. This indicator is especially useful in sideway market to buy low sell high.
Os compradores deste produto também adquirem
Algo Pumping
Ihor Otkydach
5 (9)
PUMPING STATION – Sua estratégia pessoal “tudo incluído” Apresentamos o PUMPING STATION — um indicador revolucionário para Forex que vai transformar sua maneira de operar em uma experiência empolgante e eficaz. Este não é apenas um assistente, mas sim um sistema de trading completo com algoritmos poderosos que vão te ajudar a operar de forma mais estável. Ao adquirir este produto, você recebe GRATUITAMENTE: Arquivos de configuração exclusivos: para uma configuração automática e desempenho máxim
Golden Trend Indicator MT5
Noha Mohamed Fathy Younes Badr
4.89 (18)
Golden Trend indicator  is The best indicator for predicting trend movement this indicator never lags and never repaints and never back paints    and give  arrow buy and sell    before the candle appear  and it will help you and  will make your trading decisions clearer its work on all currencies and  gold and crypto and all time frame This unique  indicator uses very secret algorithms to catch the  trends, so you can trade using this indicator and see the trend clear on charts  manual guide and
TPSproTREND PrO MT5
Roman Podpora
4.72 (18)
VERSION MT4        —        ИНСТРУКЦИЯ RUS           —        INSTRUCTIONS  ENG Principais funções: Sinais de entrada precisos SEM RENDERIZAÇÃO! Se aparecer um sinal, ele permanece relevante! Esta é uma diferença importante em relação aos indicadores de redesenho, que podem fornecer um sinal e depois alterá-lo, o que pode levar à perda de fundos depositados. Agora você pode entrar no mercado com maior probabilidade e precisão. Também existe a função de colorir as velas após o aparecimento da set
TPSpro RFI Levels MT5
Roman Podpora
4.55 (20)
Zonas de reversão / Volumes de pico / Zonas ativas de um grande player =       SISTEMA TS TPSPRO INSTRUÇÕES RUS       /       INSTRUÇÕES       ENG       /           Versão MT4        Cada comprador deste indicador recebe adicionalmente GRATUITAMENTE: 6 meses de acesso aos sinais de negociação do serviço RFI SIGNALS - pontos de entrada prontos de acordo com o algoritmo TPSproSYSTEM. Materiais de treinamento com atualizações regulares - mergulhe na estratégia e aumente seu nível profissional. Su
Grabber System MT5
Ihor Otkydach
5 (5)
Apresento a você um excelente indicador técnico: Grabber, que funciona como uma estratégia de trading “tudo incluído”, pronta para usar. Em um único código estão integradas ferramentas poderosas de análise técnica de mercado, sinais de entrada (setas), funções de alertas e notificações push. Cada comprador deste indicador também recebe gratuitamente: Utilitário Grabber: ferramenta para gerenciamento automático de ordens abertas Vídeo tutorial passo a passo: como instalar, configurar e operar com
Divergence Bomber
Ihor Otkydach
5 (1)
Cada comprador deste indicador recebe adicionalmente, e de forma gratuita: A ferramenta exclusiva "Bomber Utility", que acompanha automaticamente cada operação, define os níveis de Stop Loss e Take Profit e fecha operações de acordo com as regras da estratégia; Arquivos de configuração (set files) para ajustar o indicador em diferentes ativos; Set files para configurar o Bomber Utility nos modos: "Risco Mínimo", "Risco Balanceado" e "Estratégia de Espera"; Um vídeo tutorial passo a passo que aju
FX Volume MT5
Daniel Stein
4.82 (17)
FX Volume: Vivencie o Verdadeiro Sentimento de Mercado sob a Perspectiva de um Corretor Visão Geral Rápida Quer aprimorar sua abordagem de trading? FX Volume fornece insights em tempo real sobre como traders de varejo e corretores estão posicionados—bem antes de relatórios atrasados como o COT. Seja para buscar ganhos consistentes ou simplesmente ter uma vantagem mais clara no mercado, FX Volume ajuda você a detectar grandes desequilíbrios, confirmar rompimentos e aperfeiçoar sua gestão de ris
RelicusRoad Pro MT5
Relicus LLC
4.78 (18)
Agora US $ 147 (aumentando para US $ 499 após algumas atualizações) - Contas ilimitadas (PCs ou Macs) Manual do usuário do RelicusRoad + vídeos de treinamento + acesso ao grupo de discórdia privado + status VIP UMA NOVA FORMA DE OLHAR PARA O MERCADO O RelicusRoad é o indicador de negociação mais poderoso do mundo para forex, futuros, criptomoedas, ações e índices, oferecendo aos traders todas as informações e ferramentas necessárias para se manterem rentáveis. Fornecemos análises técnicas e
MTF Supply Demand Zones MT5
Georgios Kalomoiropoulos
5 (1)
Próxima geração de zonas automatizadas de oferta e demanda. Algoritmo novo e inovador que funciona em qualquer gráfico. Todas as zonas estão sendo criadas dinamicamente de acordo com a ação do preço do mercado. DOIS TIPOS DE ALERTAS --> 1) QUANDO O PREÇO ATINGE UMA ZONA 2) QUANDO UMA NOVA ZONA É FORMADA Você não recebe mais um indicador inútil. Você obtém uma estratégia de negociação completa com resultados comprovados.     Novas características:     Alertas quando o preço atinge a zona d
Matrix Arrow Indicator MT5
Juvenille Emperor Limited
5 (13)
O   Matrix Arrow Indicator MT5   é uma tendência única 10 em 1 seguindo um indicador multi-timeframe   100% sem repintura   que pode ser usado em todos os símbolos/instrumentos:   forex ,   commodities ,   criptomoedas ,   índices ,   ações .  O  Matrix Arrow Indicator MT5  determinará a tendência atual em seus estágios iniciais, reunindo informações e dados de até 10 indicadores padrão, que são: Índice de movimento direcional médio (ADX) Índice de canal de commodities (CCI) Velas clássicas de
Quantum TrendPulse
Bogdan Ion Puscasu
5 (13)
Apresentando   Quantum TrendPulse   , a ferramenta de negociação definitiva que combina o poder do   SuperTrend   ,   RSI   e   Stochastic   em um indicador abrangente para maximizar seu potencial de negociação. Projetado para traders que buscam precisão e eficiência, este indicador ajuda você a identificar tendências de mercado, mudanças de momentum e pontos de entrada e saída ideais com confiança. Principais características: Integração SuperTrend:   siga facilmente a tendência predominante do
Este é um indicador para MT5 que fornece sinais precisos para entrar em uma negociação sem redesenhar. Ele pode ser aplicado a qualquer ativo financeiro: forex, criptomoedas, metais, ações, índices. Ele fornecerá estimativas bastante precisas e informará quando é melhor abrir e fechar um negócio. Assista o vídeo (6:22) com um exemplo de processamento de apenas um sinal que compensou o indicador! A maioria dos traders melhora seus resultados de negociação durante a primeira semana de negociação c
Este painel mostra os últimos   padrões harmónicos   disponíveis para os símbolos seleccionados, pelo que poupará tempo e será mais eficiente /   versão MT4 . Indicador gratuito:   Basic Harmonic Pattern Colunas do indicador Symbol :   aparecem os símbolos seleccionados Trend :   de alta ou de baixa Pattern :   tipo de padrão (gartley, borboleta, morcego, caranguejo, tubarão, cifra ou ABCD) Entry :   preço de entrada SL:   preço de paragem de perda TP1:   preço do 1º take profit TP2:   preço
FxaccurateLS
Shiv Raj Kumawat
WHY IS OUR FXACCCURATE LS MT5 THE PROFITABLE ? PROTECT YOUR CAPITAL WITH RISK MANAGEMENT Gives entry, stop and target levels from time to time. It finds Trading opportunities by analyzing what the price is doing during established trends. POWERFUL INDICATOR FOR A RELIABLE STRATEGIES We have made these indicators with a lot of years of hard work. It is made at a very advanced level. Established trends provide dozens of trading opportunities, but most trend indicators completely ignore them! The
Este painel descobre e apresenta as zonas de   oferta   e   procura   no gráfico, tanto no modo de escalpelamento como de longo prazo, dependendo da sua estratégia de negociação para os símbolos seleccionados. Além disso, o modo de scanner do painel de controlo ajuda-o a verificar todos os símbolos desejados num relance e a não perder nenhuma posição adequada /   Versão MT4 Indicador gratuito:   Basic Supply Demand Características Permite-lhe ver oportunidades de negociação em   vários pares de
Trend Hunter MT5
Andrey Tatarinov
5 (2)
Trend Hunter é um indicador de tendência para trabalhar nos mercados Forex, criptomoeda e CFD. Uma característica especial do indicador é que ele segue a tendência com confiança, sem alterar o sinal quando o preço ultrapassa ligeiramente a linha de tendência. O indicador não é redesenhado; um sinal para entrar no mercado aparece após o fechamento da barra. Ao avançar ao longo de uma tendência, o indicador mostra pontos de entrada adicionais na direção da tendência. Com base nesses sinais, você
DESCRIÇÃO ICSM (Impulse-Correction SCOB Mapper) é o indicador que analisa o movimento do preço e identifica impulsos válidos, correções e SCOBs (Single Candle Order Block). É uma ferramenta poderosa que pode ser usada com qualquer tipo de análise técnica porque é flexível, informativa, fácil de usar e melhora substancialmente a consciência do trader sobre as zonas de interesse mais líquidas. CONFIGURAÇÕES Geral | Visuais Tema de cor — define o tema de cor do ICSM. SCOB | Visuais Mostrar S
Blahtech Supply Demand MT5
Blahtech Limited
4.54 (13)
Was: $299  Now: $149  Supply Demand uses previous price action to identify potential imbalances between buyers and sellers. The key is to identify the better odds zones, not just the untouched ones. Blahtech Supply Demand indicator delivers functionality previously unavailable on any trading platform. This 4-in-1 indicator not only highlights the higher probability zones using a multi-criteria strength engine, but also combines it with multi-timeframe trend analysis, previously confirmed swings
MetaBands M5
Vahidreza Heidar Gholami
4.5 (2)
MetaBands utiliza algoritmos poderosos e únicos para desenhar canais e detectar tendências, a fim de fornecer aos traders pontos potenciais para entrar e sair de negociações. É um indicador de canal mais um indicador de tendência poderoso. Inclui diferentes tipos de canais que podem ser mesclados para criar novos canais simplesmente usando os parâmetros de entrada. O MetaBands usa todos os tipos de alertas para notificar os usuários sobre eventos de mercado. Recursos Suporta a maioria dos algori
Easy Breakout MT5
Mohamed Hassan
4.6 (5)
After your purchase, feel free to contact me for more details on how to receive a bonus indicator called VFI, which pairs perfectly with Easy Breakout for enhanced confluence!     Easy Breakout MT5   is a powerful price action trading system built on one of the most popular and widely trusted strategies among traders: the   Breakout strategy ! This indicator delivers crystal-clear Buy and Sell signals based on breakouts from key support and resistance zones. Unlike typical breakout indicators
[ MT4 Version ]  [ Order Blocks ]  [ Kill Zones ]  [ SMT Divergences ] How to trade using Order Blocks :  Click here User Interface Performance:  During testing in the strategy tester, the UI may experience lag. Rest assured, this issue is specific to the testing environment and does not affect the indicator's performance in live trading. Elevate your trading strategy with the  Order Blocks ICT Multi TF  indicator, a cutting-edge tool designed to enhance your trading decisions through advanced o
[ MT4 Version ]  [ Kill Zones ]  [ SMT Divergences ] How to trade using Order Blocks:  Click here User Interface Performance:  During testing in the strategy tester, the UI may experience lag. Rest assured, this issue is specific to the testing environment and does not affect the indicator's performance in live trading. Elevate your trading strategy with the  Order Blocks ICT Multi TF  indicator, a cutting-edge tool designed to enhance your trading decisions through advanced order block analysis
[ MT4 Version ] Are you tired of spending months on demo or live accounts to test your trading strategies? The Backtesting Simulator is the ultimate tool designed to elevate your backtesting experience to new heights. Utilizing Metatrader historical symbol information, it offers an unparalleled simulation of real market conditions. Take control of your testing speed, test ideas quickly or at a slower pace, and witness remarkable improvements in your testing performance. Forget about wasting tim
Owl Smart Levels MT5
Sergey Ermolov
4 (29)
Versão MT4  |  FAQ O Indicador Owl Smart Levels é um sistema de negociação completo dentro de um indicador que inclui ferramentas populares de análise de mercado, como fractais avançados de Bill Williams , Valable ZigZag que constrói a estrutura de onda correta do mercado e níveis de Fibonacci que marcam os níveis exatos de entrada no mercado e lugares para obter lucros. Descrição detalhada da estratégia Instruções para trabalhar com o indicador Consultor de negociação Owl Helper Chat privado d
Wolfe Waves são padrões de negociação naturais presentes em todos os mercados financeiros e representam uma luta por um preço de equilíbrio. Esses padrões podem se desenvolver em prazos de curto e longo prazo e são um dos padrões de reversão preditiva mais confiáveis existentes, normalmente precedendo movimentos de preços fortes e longos. [ Guia de instalação | Guia de atualização | Solução de problemas | FAQ | Todos os produtos ] Sinais de negociação claros Surpreendentemente fácil de negociar
IQ Gold Gann Levels a non-repainting, precision tool designed exclusively for XAUUSD/Gold intraday trading. It uses W.D. Gann’s square root method to plot real-time support and resistance levels, helping traders spot high-probability entries with confidence and clarity. William Delbert Gann (W.D. Gann) was an exceptional market analyst, whose trading technique was based on a complex blend of mathematics, geometry, astrology, and ancient mathematics which proved to be extremely accurate. Download
AT Forex Indicator MT5
Marzena Maria Szmit
5 (5)
The AT Forex Indicator MT5 is a sophisticated trading tool designed to provide traders with a comprehensive analysis of multiple currency pairs. This powerful indicator simplifies the complex nature of the forex market, making it accessible for both novice and experienced traders. AT Forex Indicator uses advanced algorithms to detect trends, patterns and is an essential tool for traders aiming to enhance their forex trading performance. With its robust features, ease of use, and reliable signal
Primeiramente, vale a pena enfatizar que este indicador de trading não repinta, não redesenha e não tem atrasos, o que o torna ideal tanto para trading manual quanto algorítmico. Manual do usuário, predefinições e suporte online incluídos. O AI Trend Pro Max é um sistema de trading sofisticado, tudo-em-um, projetado para traders que buscam precisão, poder e simplicidade. Baseado em anos de desenvolvimento através de indicadores anteriores, e esta é a versão mais avançada até agora — equipada com
Was: $249  Now: $149   Market Profile defines a number of day types that can help the trader to determine market behaviour. A key feature is the Value Area, representing the range of price action where 70% of trading took place. Understanding the Value Area can give traders valuable insight into market direction and establish the higher odds trade. It is an excellent addition to any system you may be using. Inspired by Jim Dalton’s book “Mind Over Markets”, this indicator is designed to suit the
Os indicadores de tendência são uma das áreas de análise técnica para utilização em negociações em mercados financeiros. Indicador de Angular Trend Lines - determina de forma abrangente a direção da tendência e gera sinais de entrada. Além de suavizar a direção média das velas Também utiliza o ângulo de inclinação das linhas de tendência. O princípio de construção dos ângulos de Gann foi tomado como base para o ângulo de inclinação. O indicador de análise técnica combina a suavização de velas e
Mais do autor
GS smart5
Aleksander Gladkov
5 (5)
Best price, read GS smart channel ! Sale! Advanced grid algorithm,includes news and trend accounting and hedging. Can close the loss in case of market reversal and wait for the trend. For hedging, the following are used: Limit drawdown for Hedge zone parameter, pending orders and/or opening a position opposite to the loss. Can take into account not only the moment of news publication, but also the current accumulated index of the impact of news of a currency pair. Traders who purchase GS smar
News impact L
Aleksander Gladkov
Uses the built-in news calendar of the MT5 terminal or the Investing.com website (in the latter case, the Get news5 utility is required) Has the Scale parameter={100%, 110%, 125%, ...} to adjust the comfortable size of the text and control elements Tells you in which direction it is safer to open positions 3 in 1: News + Trends + Forecast News for the selected period: current and in tabular form Actual trends for 5 customizable timeframes and trend reversal levels Forecast of exchange rate mo
GS trendS
Aleksander Gladkov
GS trendS is a trend indicator that can be used for any Forex financial instrument. The indicator does not redraw and does not lag. Recommended timeframe H1. It is possible to select the trend algorithm settings {Only Open, Average Open/Close, Average High/Low} The color indicates the direction of the trend: yellow - direction can be SELL or BUY (S_B) blue - uptrend (BUY) red - downward trend (SELL) The indicator panel displays trend values of 5 timeframes for the current price level. The va
Get news5
Aleksander Gladkov
5 (1)
Utility for reading news from investing.com To access the site, you need to add WebRequest in the Options terminal menu on the Expert Advisors tab: https://sslecal2.investing.com If reading is successful, a message about writing the file is displayed. The INV_week_this.txt file is written to the MQL5\Files folder of the terminal and is kept up to date, updating data according to its own timer You can attach the utility to any chart with any time frame; just one is enough to support indicators
FREE
GS spread
Aleksander Gladkov
The indicator calculates the current spread for each tick using the formula Spread=(ASK-BID)/Point. Schedule of changes in the boundaries spread over the timeframe displayed in a separate window from the date of accession of the indicator. Two lines corresponding to the minimum and maximum spread values are displayed. The indicator window is self-adjusted according to the minimum and maximum values from the moment of launch. The minimum and maximum values for the entire period of the indicator o
FREE
Get news
Aleksander Gladkov
Utility for reading news from investing.com To access the site, you need to add WebRequest in the Options terminal menu on the Expert Advisors tab: https://sslecal2.investing.com If reading is successful, a message about writing the file is displayed. The INV_week_this.txt file is written to the MQL4\Files folder of the terminal and is kept up to date, updating data according to its own timer You can attach the utility to any chart with any time frame; one is enough to support indicators on a
FREE
GS grid
Aleksander Gladkov
5 (4)
Uses an advanced grid algorithm with no martingale or limited Martingale (default) (version for MT5: GS grid5 ) . Defines and control the current trend; It switches himself its parameters in accordance with the current market conditions ; Flexible customizable grid algorithm with or without martingale; Drawdown reduction algorithm (DD Reduction Algoritm); Hedge algorithm; Interactive trade control buttons; The ability to open / close orders manually; News filter to prevent trading during news
GS target
Aleksander Gladkov
5 (2)
The automatic adviser of the new generation with parameters: Target profit per month (10%, 25%, 50%, 75%, 100%) - choice of strategy Stop Loss Limit, USD Filter News Forex Factory (true, false) Parameters for setting the lot size Uses the news feed from Forex Factory to prevent trading during news releases. Set up to work on EURUSD timeframe M15. Works on USD accounts with a leverage from 1:500 and a Deposit from 500USD.   Enough for work: Decide on the size of the deposit that you can trust h
GS Hero
Aleksander Gladkov
According to the trading algorithm GS Hero is similar to the best expert advisors on the Market. Unique GS Hero make the author's criteria for entering the market, the ability to close trades with maximum profit (in mode TakeMaximumProfit=true, the TargetProfit parameter sets only the required minimum profit) and the trading intensity: 4 orders per day and 75% with profit. GS Hero trades on the Heiken Ashi indicator in the direction of the trend, orders are filtered using RSI and MACD indicator
GS smart
Aleksander Gladkov
5 (1)
Best price, read GS smart channel ! Sale! Advanced grid algorithm,includes news and trend accounting and hedging. Can close the loss in case of market reversal and wait for the trend. For hedging, the following are used: Limit drawdown for Hedge zone parameter, pending orders and/or opening a position opposite to the loss. Can take into account not only the moment of news publication, but also the current accumulated index of the impact of news of a currency pair. Traders who purchase GS smar
ATR RSI i4
Aleksander Gladkov
Composition of ATR and RSI indicators. The ATR RSI indicator compares two calculations of the ATR indicator with the Fast and Slow periods on one chart, plus the line of the average and the overbought and oversold zones of the RSI indicator. ATR shows the values of the volatility change in the currency pair in points, taking into account the period specified as a parameter. The entry points provided by the RSI indicator show a very good risk-reward ratio in volatile and trending markets. ATR RS
ATR RSI x4
Aleksander Gladkov
The Expert Advisor implements a trading strategy based on overbought and oversold zones of ATR RSI i4 indicator signals, which is included in the code . Trend Following, Counter Trend system , DD reduction Algoritm and Level Trading algoritm are used. To start trading, simply attach the EA to the chart, preferably EURUSD H1 timeframe. Live results can be viewed here . To trade with the new Forex instrument (EURUSD H1 by default), it is recommended to set up the parameter values by testing, initi
GS gold
Aleksander Gladkov
Best price! GS gold is 2 in 1 = Advanced Grid Expert Advisor + Trend Indicator. The algorithm is optimized for trading XAUUSD M5 (gold). Deposit from $5000 with a leverage of 1: 500 and above. GS gold can be used on any other Forex instruments with default settings. Smart Grid Algoritm, Trend Following, Counter Trend system, DD reduction Algoritm, Active Hedging Algoritm and averaging are used. Preset strategies (Use strategy parameter): No strategy Low profit Medium profit High profit By
Gain since start
Aleksander Gladkov
It will perfectly complement your working Expert Advisor or manual trading with up-to-date information. There is a sound notification of exceeding the established profit and loss limits of open SELL and BUY orders. Moreover, for each currency pair EURUSD, GBPUSD, XAUUSD, and others, various sound alerts are activated in English. Results are displayed on a special panel on the chart from the moment the indicator is activated: Elapsed time Fixed profit Current profit SELL Current profit BUY Maximu
Trends and News
Aleksander Gladkov
5 (1)
With the Trend and News indicator you will always be up to date : News + Trends + Forecast News Displayed on the chart as vertical lines with a description in the form of a tooltip The text displays two news: the previous published and the next expected They have filters: by importance (High, Medium, Low) and time period (Day, 4 days, Week) Full table of news for a given period (T button) Controlling the display of vertical lines on the chart and the sound signal before and after the publicati
GS Trend5
Aleksander Gladkov
The advisor is designed for autonomous automatic round-the-clock trading on the EUR/USD pair, timeframe M15. There is a protection of the deposit from significant drawdown and a mode for saving a profitable transaction. Trades one deal. With the set parameters, it turns out to be one per day on average. How it works Uses the author's algorithm for analyzing three indicators and the direction of market movement to make a decision to open a deal. RSI Stochastic Bands market direction Opens an orde
GS grid5
Aleksander Gladkov
F ully automated Expert Advisor using the advanced grid algorithm and constrained Martingale (MT4 version: GS grid ). Set up to work on EURUSD timeframe M15. Test 2021 shows a high percentage of winning orders: more than 98%. Works on HEDGING accounts with a leverage of 1:500 and a Deposit from 1000USD. Can use the news feed from Forex Factory to prevent trading during news release (Filter News Forex Factory=true;). To access the options terminal menu on the Expert Advisors tab, you must enable
GS target5
Aleksander Gladkov
The revolutionary automatic adviser of the new generation with three parameters: Target profit per month (from 10% to 100%) Degree of risk (SuperLow, Low, Medium, High) Stop Loss Limit, USD Set up to work on EURUSD timeframe M15. Works on HEDGING accounts with a leverage of 1:500 and a Deposit from 500USD.   Enough for work: Decide on the size of the deposit that you can trust him Set the value of the desired profit per month (from 10 to 100 percent) Select the degree of risk (Low, Medium,
It will perfectly complement your working Expert Advisor or manual trading with up-to-date information. There is a sound notification of exceeding the established profit and loss limits of open SELL and BUY orders. Moreover, for each currency pair EURUSD, GBPUSD, XAUUSD, and others, various sound alerts are activated in English. Indicators are displayed on a special panel on the chart from the moment the indicator is activated: Elapsed time Fixed profit Current profit Maximum drawdown Current d
GS one
Aleksander Gladkov
Try how the adviser trades, I'm sure you'll like it! Extremely easy to use, does not require additional settings. Unique dynamic grid algorithm with trend indicator and hedging. Works with all Forex currency pairs. Default parameters are configured for EURUSD M5 What can be a problem for other grid Expert Advisors GS one turns into profit. Has a set of strategies: Follow the trend Sell and Buy Only Sell Only Buy XAUUSD_M5 GBPUSD_H1   GS one has an intuitive interface for quick management of tra
GS trade report
Aleksander Gladkov
5 (1)
3 in 1 : Report + monitoring + sending messages (Telegram, ...) to optimize trading and use of advisors. Monitoring: Panel on the chart Sending messages to Telegram Sending messages to Email Sending Notifications Sending pop-up messages Sound notifications when the established Profit/Loss levels are exceeded Monitoring is activated by pressing the Start button. Profit for the period by currency pairs, hours and Magic number for the current account. Forms four tables: by symbols, by magic number
GS grid Pro
Aleksander Gladkov
The Expert Advisor works as quickly as possible using a minimum of resources, which is very good when using a VPS. Includes the latest grid algorithm implementation solutions: trend tracking separate automatic Breakeven for Sell and Buy series Active Hedging Algorithm during the trading process, sets Stop loss and Take profit for orders The default parameter settings do not use martingale. Works on all Forex instruments. Recommended: Deposit from $300 (only USD) with leverage from 1:500 Best res
A professional tool for real-time monitoring of the account status and the work of Expert Advisors. Information about the account status can be sent to Telegram chats automatically at a specified interval or upon request. From the screenshots of the open charts of the terminal, you receive upon request from your Telegram bot. Account information includes: 13:02 Trade monitoring by Telegram v.1.0 (headline) Account : 6802ххх RoboForex-Pro (account information) Profit start: 2661 USD (profit earne
Trade maker
Aleksander Gladkov
Multi-currency trading on one chart! Creation and management of positions with trailing and breakeven, risk management and other useful functions. To fix profits, the Target profit parameter is provided; if it is greater than zero, all positions will be closed if the set value is exceeded. All positions and orders have set Stop Loss and Take profit. For multi-currency trading, taking into account the impact of news and switching symbols on the chart, it is useful to use the News impact indicato
Bars news
Aleksander Gladkov
Indicator of news linked to a bar. The published current value of the news has a characteristic impact on the currency it relates to: positive, negative, neutral . The indicator summarizes all these values for the selected period, taking into account the importance of the news: high, medium, low . As a result, a percentage is calculated for the currency pair, which shows the news of which currency is dominant. If the value is positive, then the pair has news pressure towards BUY, if negative - S
GS trend I
Aleksander Gladkov
The trend indicator has the ability to adjust the viewing depth and sensitivity, does not repaint and does not lag. In addition to the current trend, the chart displays trends for 5 more periods with zero trend levels for them. This allows for a comprehensive assessment of the nature of the trend movement. There is a possibility to choose the trend algorithm settings {Only Open, Average Open/Close, Average High/Low} The trend indicator can be used for any Forex financial instruments. The color s
Filtro:
Fabrizietto71
1121
Fabrizietto71 2024.04.16 02:35 
 

The product is well and carefully made. The developer's assistance is always timely and present. It proves to be very useful to have an overview regarding events that are upcoming. Very satisfied. We also optimized some settings together. I would add that Aleksander is always available and ready to make further improvements and changes.

Aleksander Gladkov
5022
Resposta do desenvolvedor Aleksander Gladkov 2024.04.16 09:18
Thank you, the review is very important to me.
220072256
4226
220072256 2024.03.08 12:59 
 

This fantastic news indicator is a staple of my trading

Aleksander Gladkov
5022
Resposta do desenvolvedor Aleksander Gladkov 2024.03.08 13:34
Thanks for the review. Hopefully a new opportunity to use the site's news Investing.com improve the quality of calculating the news impact index and it will be more adequate for the market.
Matthew Phillip Clarke
330
Matthew Phillip Clarke 2023.12.08 10:08 
 

This tool has improved my trading so much, as now I am not wasting my time in markets that are too volatile during news times, it's the first template I open in the day before trading.

CraigLeith
64
CraigLeith 2023.12.05 20:12 
 

Great utility. I especially like the vertical lines that show upcoming news.

Antonio Fluxa Vidal
2190
Antonio Fluxa Vidal 2023.11.30 18:38 
 

This indicator is an essential utility for FX trading based on fundamental analysis. I recommend it without a doubt. Its design integrated into the graph makes the great task of detecting trends based on future macroeconomic data much more precise and clear. A great job with many opportunities in the future!

Mohammed Mohammed Mohammed Abu Zaid
350
 

Very good and useful indicator.. I have one point though: - the values in the [Actual, Forecast and Previous] columns don't show the '%' mark, so I don't know if this value is in points or percentage... Also there are other symbols as "K & M" that don't show. Some times the value is (3.8K or 3.8M) but the indicator only shows (3.8) Hope you fix this soon...

Also, I think it might me a good idea to include multiple news sources like "investing.com" and "forexfactory" and let users choose either one through a settings option

Aleksander Gladkov
5022
Resposta do desenvolvedor Aleksander Gladkov 2024.02.12 15:54
In version 2.5, the display of news values in the table has been fixed. As for other news sources, I do not plan to connect such an opportunity. The fact that the indicator is self-sufficient and does not require external resources, drawing all the information from the terminal is an advantage. Using the sites will lead to a significant increase in traffic.
12.02.2024 The News impact L indicator can use the site's news investing.com
طاهر
76
طاهر 2023.05.02 16:13 
 

nah, I have bought this 2 days ago, and The JOLTS Job openeing today May second, was diffrent from investing.com, it actaully gave a positive sign for the USD yet the usd went down, lucky I wasn't depending on it.

Aleksander Gladkov
5022
Resposta do desenvolvedor Aleksander Gladkov 2024.03.08 13:23
Hi, the News impact indicator uses the economic calendar of the MQL5 website: https://www.mql5.com/en/economic-calendar , which is also available in the MT5 terminal on the Toolbox panel Calendar tab.
Calendar data is collected from public sources and the developer of this calendar, the MQL5 website, is responsible for them.
Non-compliance of individual calendar parameters with news from the site investing.com can be discussed on the forum https://www.mql5.com/en/forum or contact the support of the MQL5 website.
Website investing.com not the only source of the economic calendar. There is https://www.forexfactory.com/calendar and probably other sources. The data on each of them may differ.
What does the indicator do:
1. Takes data from the MQL5 calendar, selecting by currency pair symbols and binds them to the terminal time. The indicator is responsible for the compliance of the data published by it with the MQL5 calendar.
2. Generates a table of economic news values with the ability to set the viewing period (Today, 4 days, Week) and selection by importance (Low, Medium, High).
3. Displays vertical lines on the chart corresponding to the moment of the news release.
4. For the published value of Actual news in the calendar, an assessment of the compliance of the value with market expectations is set: Better than expected, Worse than expected, Neutral. This characteristic is emphasized by the color: green, red, gray.
The indicator collects these characteristics for a set period and generates a "news pressure index for the current quote".
For example, if there is more "good" news for EUR and less for USD for the EURUSD pair during the period, as well as "bad" news for USD add the EUR index and "bad" for EUR add the USD index.
As a result, the indicator shows the index value in the form of BUY and SELL percentages for a currency pair.
Moreover, the last panel shows two index values: for the current time interval and for the same previous one. This allows to assess the dynamics of changes in news pressure.
5. Pie charts show the weight of news falling into the index for a set period for each symbol.
6. It should be borne in mind that the market reacts to emerging economic news, but they are not the only factor affecting the rate of the currency pair.
7. I hope that having gained experience with my indicator, you will give it an adequate assessment.
Sincerely, good luck in trading. 12.02.2024 The News impact L indicator can use the site's news investing.com : https://www.mql5.com/en/market/product/107761 08.03.2024 News impact Version 5.0 allows you to select website Investing.com as a news source However, you will additionally need the Get News5 utility, since indicators cannot receive data from websites.
Barend Herculaas Christiaan Fourie
1076
 

O usuário não deixou nenhum comentário para sua avaliação

Aleksander Gladkov
5022
Resposta do desenvolvedor Aleksander Gladkov 2023.04.03 18:51
Thank you, user reviews and suggestions help to make my products become better
wuzzy66
950
wuzzy66 2023.03.17 21:50 
 

This is a game changer indicator this indicator gives a better picture of what is happening to a particular currency pair you all know the release of forex news has a great impact on the movement of the currency pair with this indicator also gives assessment taking into account market expectations, which certainly has an impact on the future movement of the currency pairyou trade with confidence you have a clear view how who is in controll in the market either the bulls or the bears you get all statistics that allows you to make quick inform decisions you also get vertical lines informing you of upcoming news that can impact you trade the concept is so good that you can make lots of pips I wish I had known about this indicator long ago but it's never to late to start trading with confidence was actually searching for an indicator that can inform me of future coming news and previous impact on news this a real game changer made over 100 pips using this the 1st day all you need is just take time to understand key statics shown on the chat very user friendly with lots of functionality wish I could give a 10 stars

Aleksander Gladkov
5022
Resposta do desenvolvedor Aleksander Gladkov 2023.03.18 09:15
Thank you, the indicator not only displays the news feed with the actual values, but also gives their assessment taking into account market expectations, which certainly has an impact on the future movement of the currency pair
Satbieter
276
Satbieter 2022.03.27 09:42 
 

Very good indicator. Support is very good and suggestions are implemented quickly.

Responder ao comentário
Versão 5.5 2024.06.03
1. The management of labels for levels of trend direction change has been adjusted
2. The operation of the X button has been corrected
3. Fixed the audio notification of the news publication.
4. The Custom sound file parameter has been added. The file must be located in the terminal directory\Sounds. Only WAV audio files are played.
Versão 5.4 2024.05.10
1. The Display Local time parameter = true; (by default) switching the displayed time from terminal to local
2. Added the Trend calc mode=Average value of the span Min/Max; (by default) parameter
Versão 5.3 2024.04.08
1. The terminal time display has been adjusted
2. Added the Display Local time = false; parameter switching the displayed time to local
Versão 5.2 2024.03.15
Access to the Investing.com news file has been adjusted
Versão 5.1 2024.03.10
1. The work with the Investing.com site has been corrected
2. Fixed the display of the news impact index values on the chart
Versão 5.0 2024.03.08
1. Added the ability to select a news source: terminal calendar or website Investing.com (News source parameter)
To access the site, you will need the Get News5 utility: https://www.mql5.com/en/market/product/110468
and terminal setup: Allow WebRequest for News from investing.com : Tools->Options->Expert Advisors Add=https://sslecal2.investing.com
2. The trend indicator has been improved and optimized
Versão 4.7 2024.02.26
1. The column of the news impact index for the previous period in the right symbols panel is excluded
2. Corrected the display of the pie chart when switching it
Versão 4.6 2024.02.14
The algorithm for changing the timeframe or symbol has been adjusted
Versão 4.5 2024.01.01
1. The Allow change symbol mode has been adjusted
2. Added a button to control the chart display
Versão 4.4 2023.12.25
Fixed the setting for saving the indicator modes
Versão 4.3 2023.12.22
Fixed the output of trend levels
Versão 4.2 2023.12.19
1. Added the parameter allowing/prohibiting overloads the graph symbol : Allow change symbol = false;
2. Button for recording .CSV news file has been added
3. Added File Start Time and File End Time parameters
Versão 4.1 2023.12.18
1. Clicking on the right panel overloads the chart symbol to the selected one and updates all indicator data
2. Added output to the chart of trend direction change levels for each of the five indicators
3. Added a panel with information about the profit of open positions by the symbols of the specified Magicnumber
Versão 4.0 2023.12.15
When switching symbols using the right panel, the data of trend indicators is updated
Versão 3.9 2023.12.12
1. Redesigned interface
2. Five customizable trend indicators have been added
3. Fixed scrolling of news in the table
4. Fixed the multiplicity of displaying vertical lines of future news
Versão 3.8 2023.12.09
1. The terminal remembers the indicator settings when changing the timeframe
2. The indicator has been switched to the terminal timer
Versão 3.7 2023.12.03
Added the Scale and markup parameter = 100% (default)
Versão 3.6 2023.12.02
Fixed the display of vertical lines
Versão 3.5 2023.12.02
A filter has been made for symbols with a dot in the name
Versão 3.4 2023.11.14
1. The Start time offset to the past parameter is set in hours
2. Optimized the output of vertical news lines
Versão 3.3 2023.10.29
1. Corrected the output of the current news values
2. Added VL button (Hide/Show vertical news lines on the chart)
3. The operation of the X button has been corrected (Show/Hide the indicator)
4. The parameters of the trend indicator panel have been changed
Versão 3.2 2023.10.16
Added the Hide the Trend panel = false parameter;
Versão 3.1 2023.10.12
Added trend indicator for two timeframes and its parameters
Versão 3.0 2023.10.08
Corrected the output of information to the current news panel
Versão 2.9 2023.10.04
1. Added a panel for displaying information about the current past and next news
2. Added output to the schedule of the start and close of trading sessions (London, New York, Tokyo)
3. Added a parameter that allows you to display news on the chart determined by the parameter value (convenient for indexes)
4. Added parameters:
Currency pair news = ""; //The entered value is used to display news, if not specified, then the symbol of the current chart
Show current panel = true;//panel for displaying information about the current past and next news
Show trading sessions = true; //Displays labels for the beginning and end of trading sessions (London, New York, Tokyo)
Versão 2.8 2023.09.28
1. Added parameters:
Show signal arrows = true;
The size of the arrows on the chart = 2;
Show the signal value = true;
Signal Font size = 9;
2. Changed default parameter values
3. Renamed the parameter Limit the impact of news, % to The value of the news impact filter, %
Versão 2.7 2023.09.09
1. In the terminal, set Options->Charts->Precise time scale
2. Vertical lines of news coming out at the same time will be displayed on the chart with some offset
3. The vertical line of the future next news is displayed on the chart to the right of the current time
4. Added Setting Ray parameter of vertical lines = false;
Versão 2.6 2023.08.13
1. Vertical news lines on the chart remain after clicking the hide "X" button, if the Show vertical lines parameter = true;
2. The actual value of the news with the characteristic of impact has been added to the hint of the vertical line
Versão 2.5 2023.07.20
Fixed the display of news values in the table.
Versão 2.4 2023.04.03
Added parameters: Always show USD news=false; и Include USD Low news=false;
Versão 2.3 2023.02.23
Fixed the error of "disappearing" the Hide button when expanding the news list
Versão 2.2 2023.02.21
1. Hide news/Show news button added
2. The pie chart panel has been corrected
Versão 2.1 2022.12.05
The interface has been corrected
Versão 2.0 2022.09.04
Added a filter by currency pair symbols
Versão 1.9 2022.04.25
Added the Show vertical lines parameter
Versão 1.8 2022.04.16
Fixed the output of vertical lines marking news events on the graph
Versão 1.7 2022.03.27
Added the ability to scroll the news table
Versão 1.6 2022.03.25
Added the ability to switch a currency pair by clicking on the row of the ratings panel of the impact of preset pairs
Versão 1.5 2022.03.24
Values for the current and previous periods have been added to the news impact results panel by the list of symbols
Versão 1.4 2022.03.23
1. Added font settings
2. Added the parameter of the maximum number of rows in the viewport
Versão 1.3 2022.03.22
Added a panel of resulting estimates of the impact of news on 10 currency pairs
Versão 1.2 2022.03.21
Added the resulting assessment of the impact of news on the currency pair: BUY and SELL as a percentage
Versão 1.1 2022.03.20
Fixed bugs