Gann Pivot Levels
- Indicadores
- Ali Gokay Duman
- Versão: 1.1
- Atualizado: 30 novembro 2022
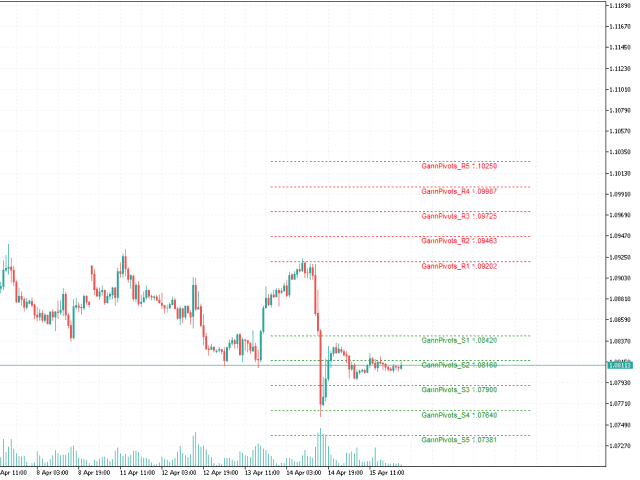
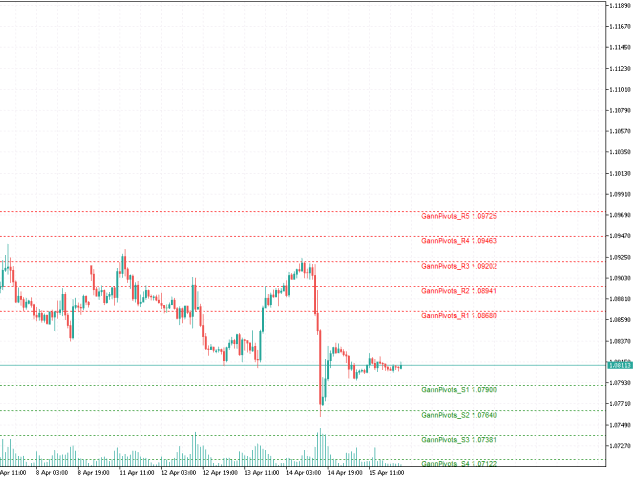
This indicator calculates gann support and resistance prices with use gann pyramid formulation and draw them on the chart. And If you want, Indicator can alert you when the current price arrive these pivot levels.
Alert Options: Send Mobil Message, Send E-mail, Show Message and Sound Alert
Levels: S1, S2, S3, S4, S5, R1, R2, R3, R4, R5
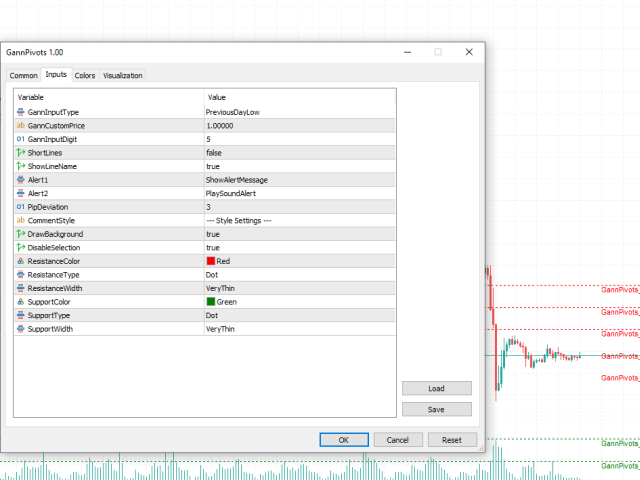
Inputs:
- GannInputPrice: Input price for gann pyramid formulation.
- GannInputDigit: How many digit do you want to use for calculation formula. (The number and the pivot intervals are inverse proportion. If decrease the number, pivot intervals will be larger then before.)
for example, EURUSD = 1.08147
- if you set 6, Indicator use 108147 number for gann input price.
- if you set 4, Indicator use 1081 number for gann input price.
- PipDeviation: You can set price sensibility for alert (Default: 3)
- Style: You can change line's style (Color, Width, Type)


Hi Ali Gokay Duman, I find your Gann Pivot Levels indicator well done and practical. I am not with the levels that I have been using for several years. I use pivot daily on: -https://www.stockmaniacs.net/freebies/free-tools/gann-square-of-9-calculator/ for "high" price values such as indices and gold. -https://www.pivottrading.co.in/forex/forexGannSquare.php for "low" price values like forex. Every morning it is a long job to adjust the levels by removing the commas from the pivots of some assets and then re-inserting them on the levels, because sometimes the levels are too close together. After so many years I manage quite well, but it is a very boring job. It would be very nice to have an indicator that solves everything for me. If this solution existed, I would try to automate my strategy. Great day to you, Corrado Bruni.