Moving Average 5EMA with Show and Hide Button
- Indicadores
- Issam Kassas
- Versão: 1.0
Description:
For a comprehensive understanding of our indicators, we invite you to explore the entire Q&A section within this MQL5 blog post here.
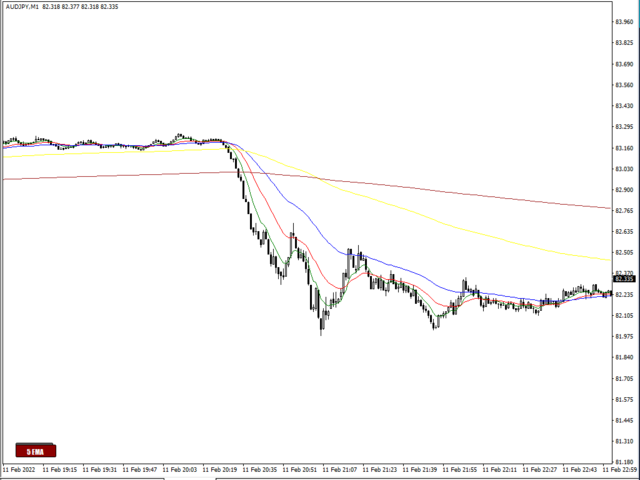
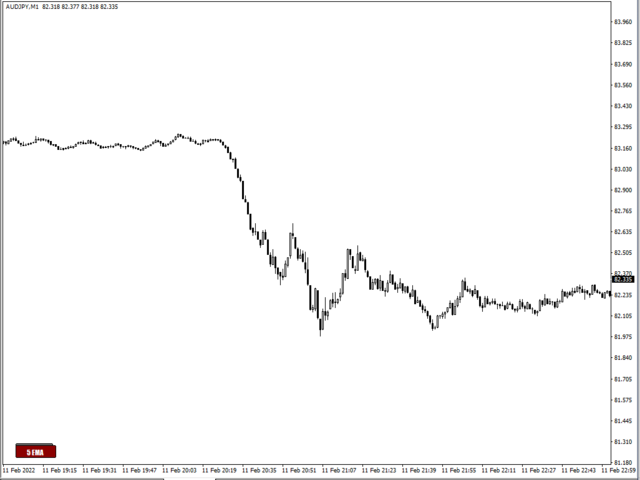
The Moving Average 5EMA Indicator is a valuable tool designed to provide comprehensive insights into market trends and potential entry and exit points. It incorporates five exponential moving average (EMA) lines, each representing the average price over different periods. This powerful combination offers a deeper understanding of price movements and helps traders make informed decisions.
Key Features:
-
Five EMA Lines: This indicator displays five distinct EMA lines on your chart. The different periods (e.g., 5, 10, 20, 50, and 100) allow you to analyze short-term and long-term trends simultaneously.
-
Trend Identification: By observing the positioning and slope of the EMA lines, you can identify trends in the market. An upward-sloping EMA suggests a bullish trend, while a downward slope indicates a bearish trend.
-
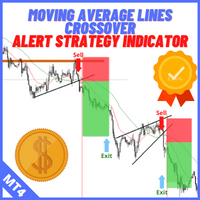
Signal Crossovers: The Moving Average 5EMA Indicator generates signals when the shorter EMA lines cross above or below the longer ones. These crossovers can be interpreted as potential entry or exit points in your trading strategy.
-
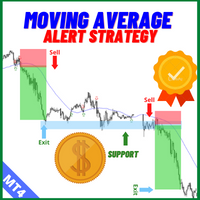
Dynamic Support and Resistance: The EMA lines act as dynamic support or resistance levels, aiding in the identification of critical price levels where trends may reverse or strengthen.
-
Versatility: The Moving Average 5EMA Indicator can be applied to various financial instruments, including forex, stocks, commodities, and cryptocurrencies.
How to Use:
-
Trend Confirmation: Confirm the prevailing trend by analyzing the positioning of the five EMA lines. Aligning EMA lines from shorter to longer periods generally indicates a strong trend.
-
Entry and Exit Points: Use EMA crossovers as signals for potential entry and exit points. A bullish crossover (shorter EMA crossing above longer EMA) may suggest a buying opportunity, while a bearish crossover (shorter EMA crossing below longer EMA) could indicate a selling opportunity.
-
Price Rejections: Observe how price reacts when it approaches the EMA lines. Repeated bounces off an EMA line could indicate its significance as a support or resistance level.
-
Risk Management: Implement risk management techniques such as setting sl and tp levels to protect your capital and optimize trade outcomes.
Technical Analysis Topics:
- Exponential Moving Average (EMA): Understand the calculation and significance of the EMA and its advantages over other moving average types.
- Multiple Time Frame Analysis: Apply the Moving Average 5EMA Indicator on different time frames to gain a holistic view of the market.





























O usuário não deixou nenhum comentário para sua avaliação