Coral Heatmap
- Indicadores
- D Armond Lee Speers
- Versão: 1.2
- Atualizado: 19 setembro 2023
- Ativações: 10
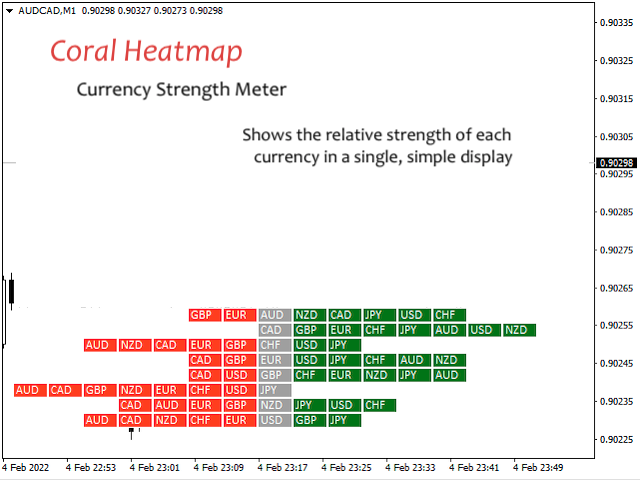
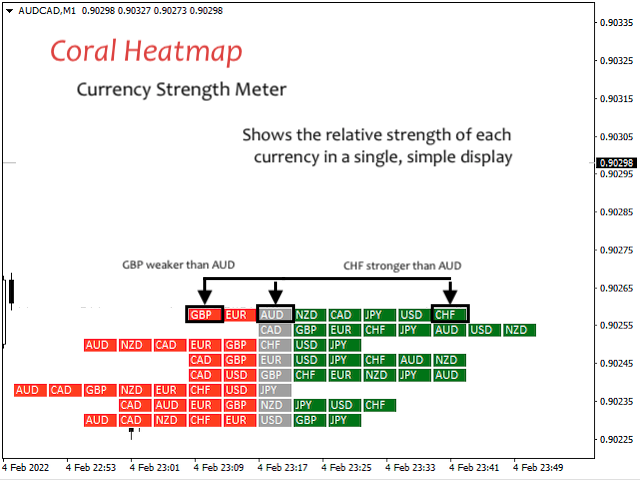
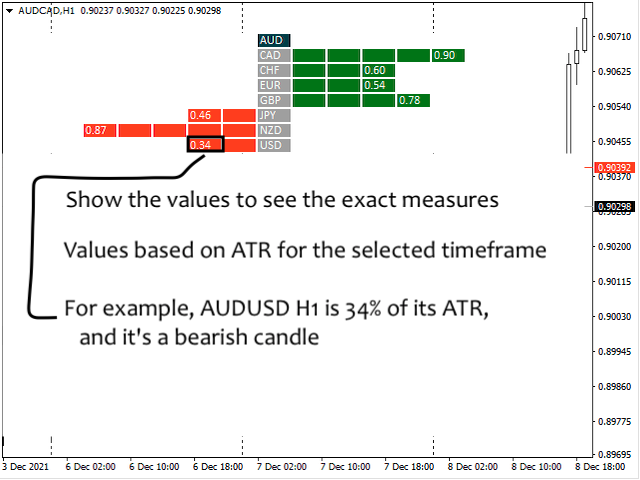
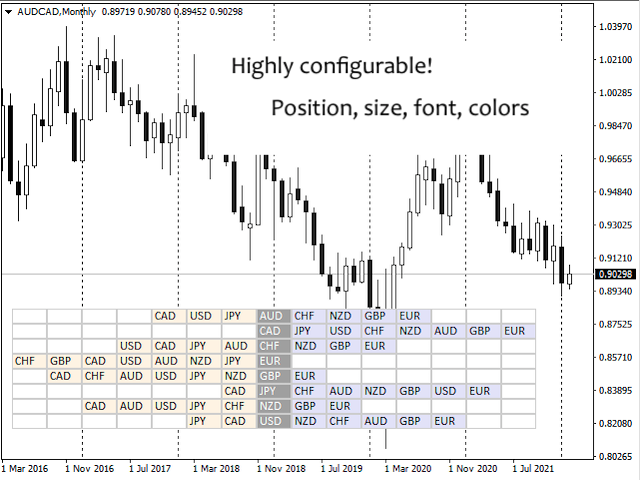
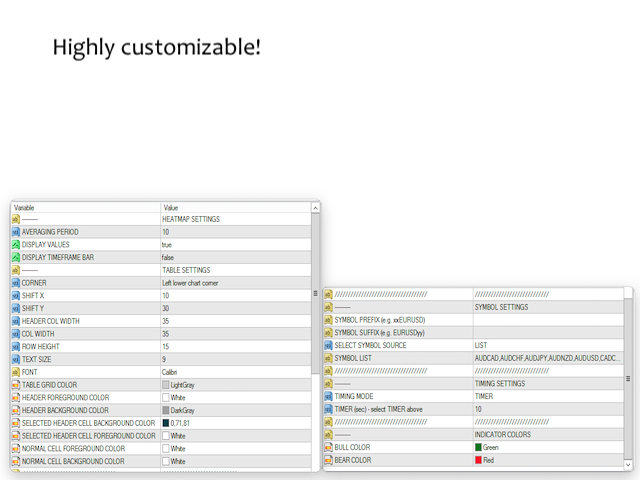
Coral Heatmap is a currency strength meter based on the ATR values for the selected timeframe. There are two main view modes:
- All Currencies (default) - see the ranked strength of all currencies in a single view
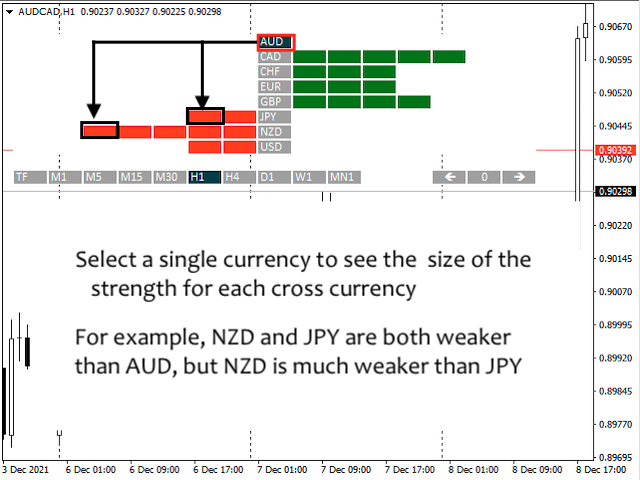
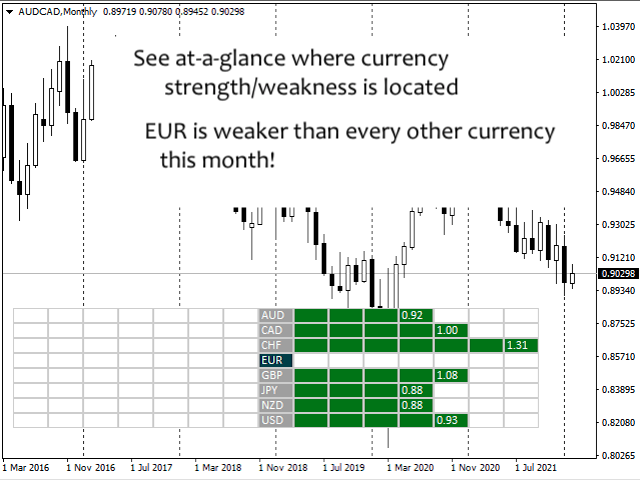
- Selected Currency - see the relative strength of all other currencies compared to a selected currency
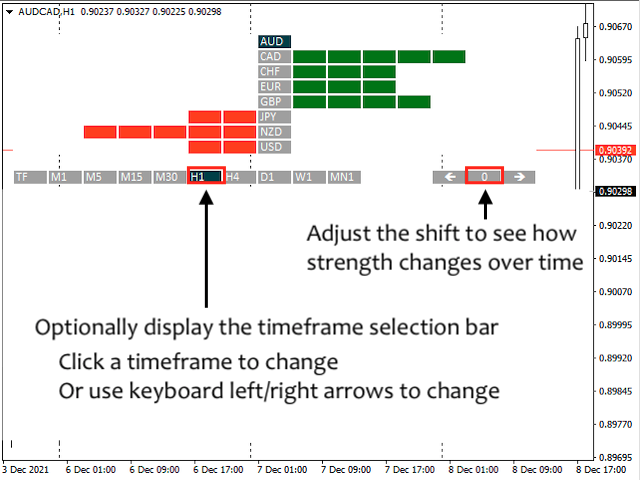
You can optionally display the timeframe selection toolbar; timeframe is always synchronized to the current chart timeframe. Use keyboard shortcuts to quickly navigate currencies (up/down arrows) or timeframes (left/right arrows).
With a single currency selected, you can optionally display the % ATR values for every other currency. Values are calculated as the % ATR for the selected timeframe, and are scaled to fit the meter's dimensions. There is also an option to adjust the shift (the timeframe toolbar must be displayed), so you can see how relative strength changes over time.
NOTE: The indicator will not display values correctly in the strategy tester. You can try the demo to explore configuration options, but the displayed data will not accurately reflect the data being tested.
If you like Coral Heatmap, please take a look at my other products available in the market!