Mt5ManualBacktesting
- Utilitários
- Santiago Garcia Sanchez
- Versão: 2.0
- Atualizado: 26 agosto 2022
- Ativações: 5
Tool that gives the possibility to test your strategy manually on historical data in the Metatrader 5 Strategy Tester application.
It is based on an EA that can only be used in the strategy tester and in visual mode.
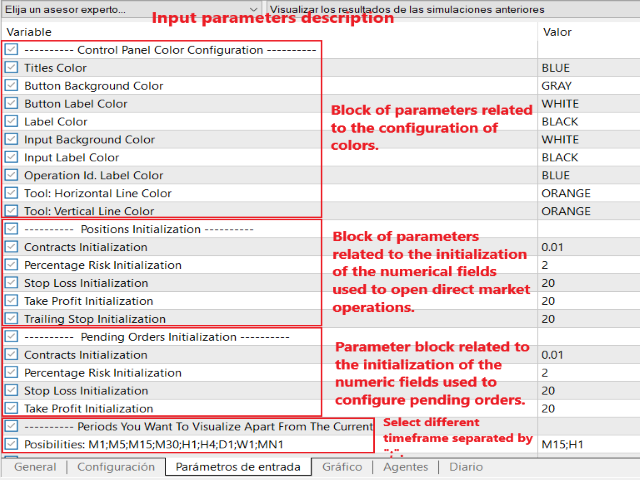
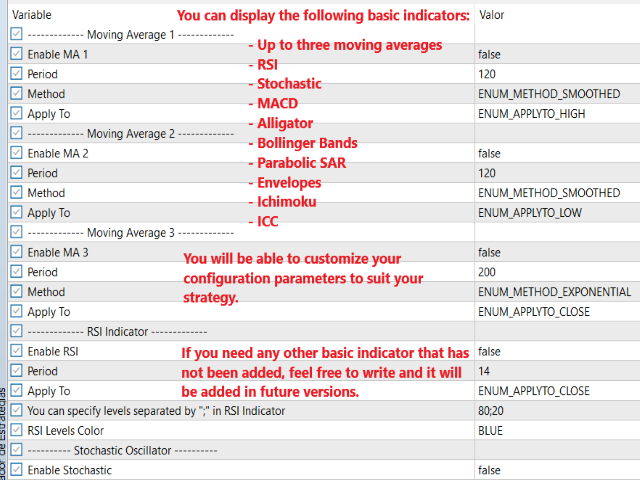
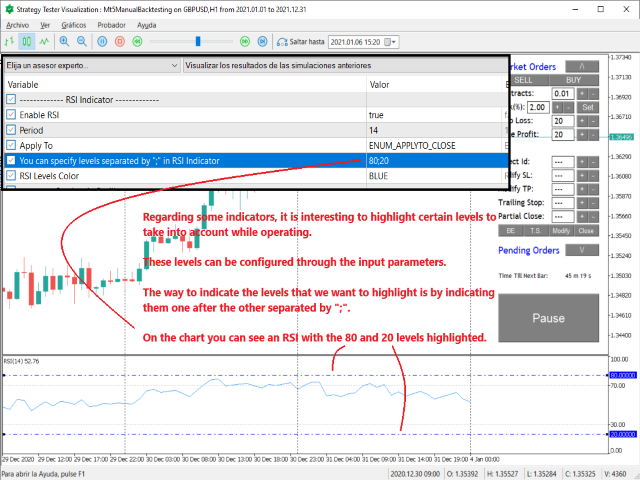
The EA provides the possibility to configure, through input parameters, the display of different indicators:
- 3 Moving Average
- RSI
- Stochastic
- MACD
- Alligator
- Bollinger Bands
- Parabolic SAR
- Envelopes
- Fractals
- Ichimoku
- CCI
Due to the limitations of the Mt5 strategy tester, such as the impossibility of entering values in a field or selecting an option from a list, all the configuration of the operations had to be carried out through buttons.
It is not very comfortable but it is the only way to be able to operate in this new version of Metatrader.
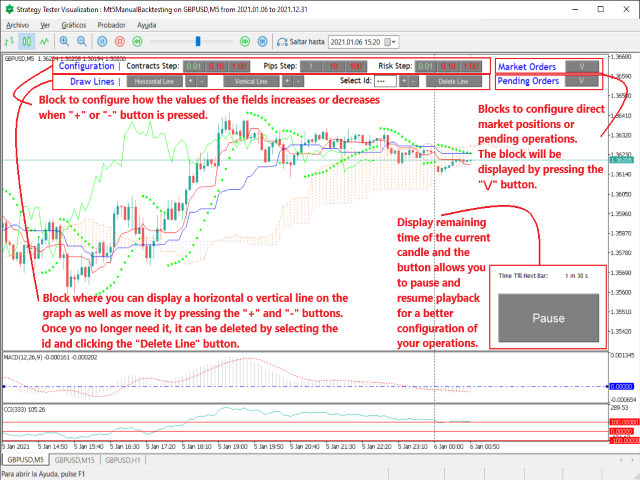
The EA is divided into five zones:
- Configuration of jumps to increase or decrease contracts, pips and percentage of risk
- Buttons to be able to paint lines
- Direct orders
- Pending orders
- Current candle information and button to pause playback
Steps Settings
Depending on the timeframe you trade, you will need the jumps to be higher or lower. The three blocks where the jumps are configured are:
- Contract Steps: the possible values are 0.01, 0.10 and 1.00 and applies to "Contracts" and "Partial Close"
- Pips Steps: the possible values are 1, 10 and 100 and apply to "Stop Loss", "Take Profit", "Modify SL", "Modify TP" and "Trailing Stop"
- Risk Step: the possible values are 0.01, 0.10 and 1.00 and applies to "Risk"
Lines tool
It gives the possibility to paint horizontal and vertical lines on the graph.
To move them, use the "+" and "-" buttons. And to remove them, you have to select the id. in the "Select Id" field and press the "Delete Line" button.
Direct market orders
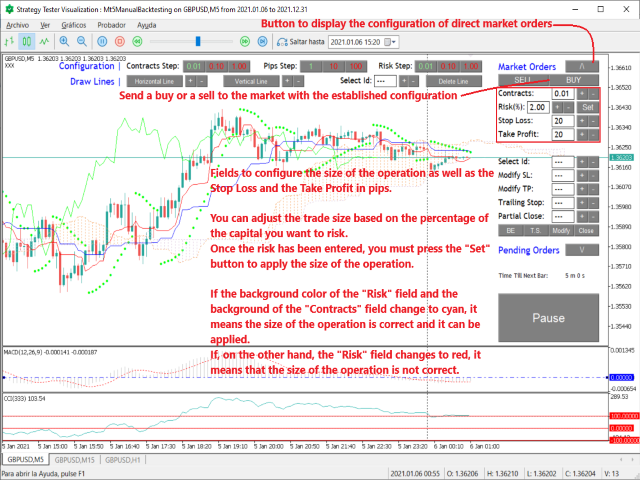
In order to open a direct market trade, press the "\/" button of "Positions", which will display the necessary information.
Once deployed, the "SELL/BUY" buttons send direct trades to the market. The operation will be opened with the "SL" and "TP" configured as well as the number of contracts selected.
If you want to calculate the size of the operation according to your capital, the risk % and the "SL" you must enter the % in the "Risk" field and press the "Set" button to apply it before pressing the "SELL" or " BUY".
If the contract size is incorrect the field will be shown in red.
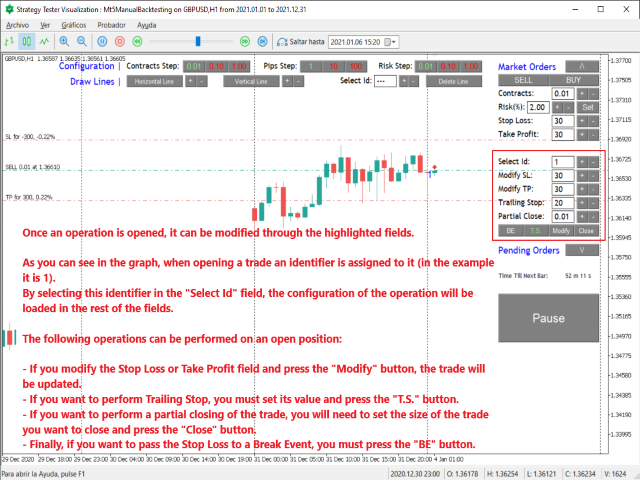
Once the operation is opened, it is assigned a number that is displayed next to the opening of the operation.
On an open position, you can perform the following:
- break event
- trailing stop
- Modify "Stop Loss" and "Take Profit"
- Partial Closure
The ID must be selected. of the operation in "Select Id", configure the new values and click on the operation that you want to carry out.
Pending orders
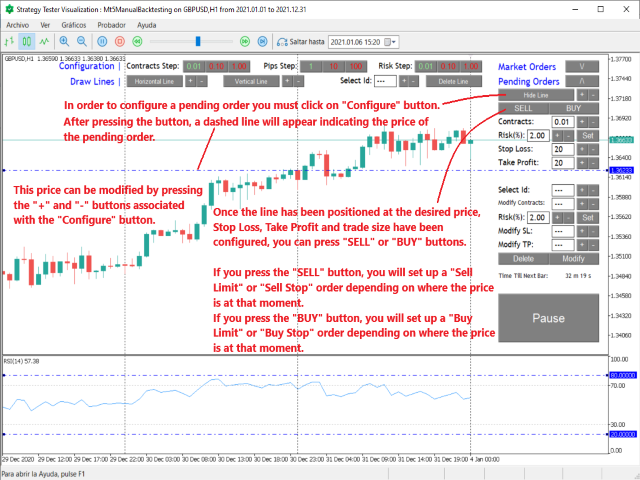
To set up a pending order, you must press the "\/" button of "Pending Orders", which will display all the necessary information.
Once the information has been displayed, the "Configure" button must be pressed to start the configuration.After pressing it, a dashed horizontal line will appear on the graph. The line can be moved with the "+" and "-" buttons (increasing/decreasing the price according to the configured "Pips Steps").
After setting the desired price, "Stop Loss" and "Take Profit", you will be able to press the "SELL/BUY" buttons to create the pending trade.
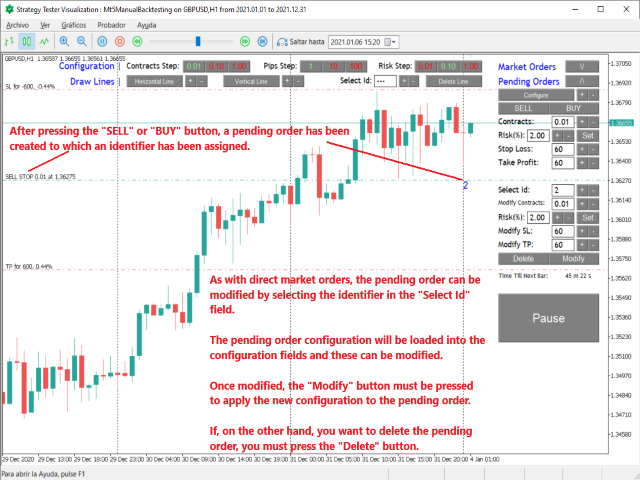
A pending operation can also be modified by selecting the id. in the "Select Id" field.After selecting an operation, its configuration will be loaded and can be modified by pressing the "Modify" button.If what you want is to delete it, you must press the "Delete" button.
Remaining time of the current candle and Pause/Play button
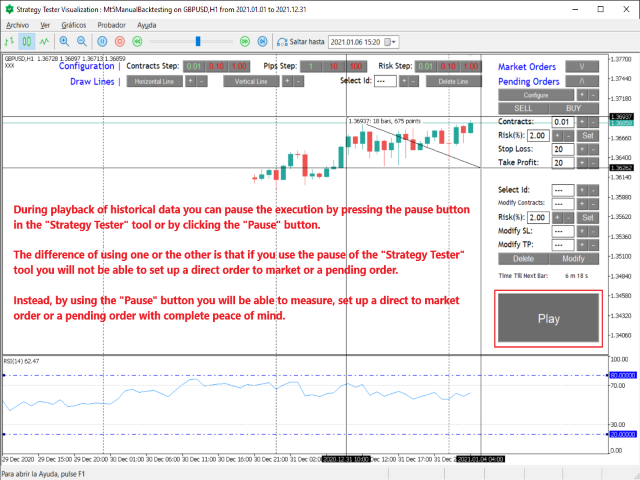
Finally, we have information on the time remaining until the end of the current candle and a button that allows you to pause the playback of historical data.By pausing the playback we get time to be able to measure and configure Stop Loss and Take Profit or set up a pending operation.
As stated at the beginning, the tool is quite limited in terms of user interaction with it. That is why sometimes, when horizontal lines are drawn and it is over a button,they make it difficult to interact with the buttons.

