Multi Timeframe Ema Ichi Key Levels
- Indicadores
- Nima Kian
- Versão: 2.0
- Atualizado: 25 dezembro 2021
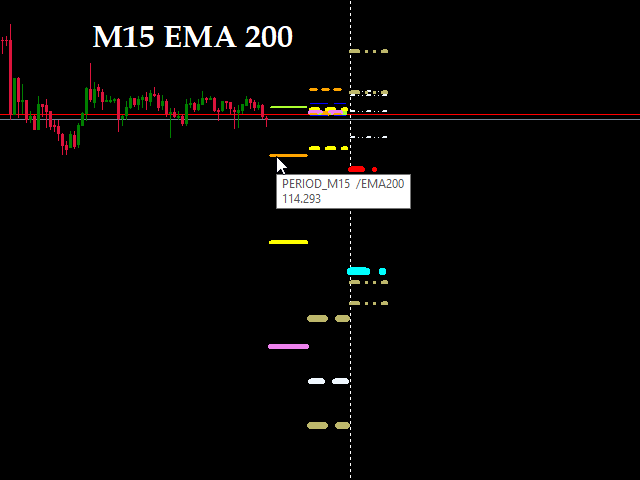
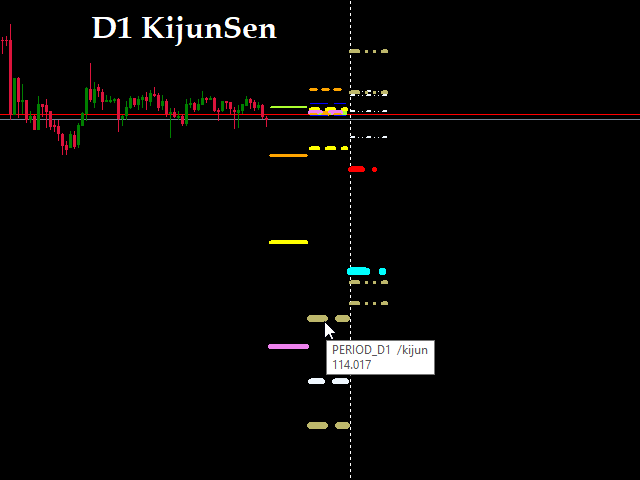
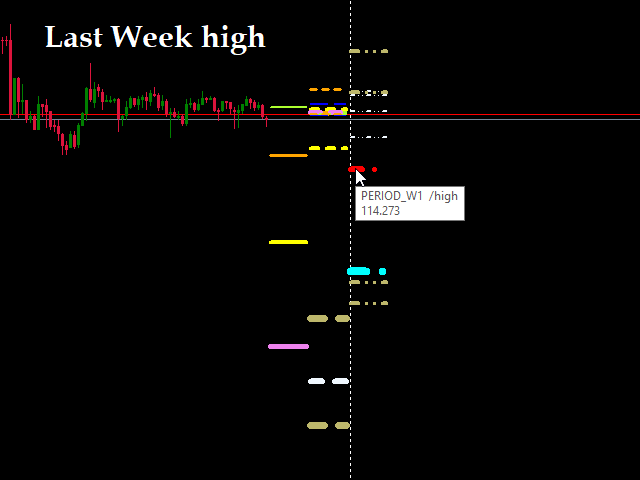
This indicator demonstrates the probable dynamic support and resistance levels of EMA, Ichimoku lines, and Key OHLC levels for different timeframes on one chart. This can drastically reduce the time and effort needed for switching between different timeframes.
EMA and Ichimoku Levels are drawn for the M1, M5, M15, M30, H1, H4, and D1 timeframes, and the Key OHLC levels of the last periods are drawn for the H4, D1, W1, and MN1 timeframes.











A very useful tool. It's a pity that there is no possibility to disable some timeframes and e.g. EMA, so that it was more readable