• Visão global
  • Comentários (1)
  • Discussão
  • O que há de novo

High Low Time Frame Levels MT5

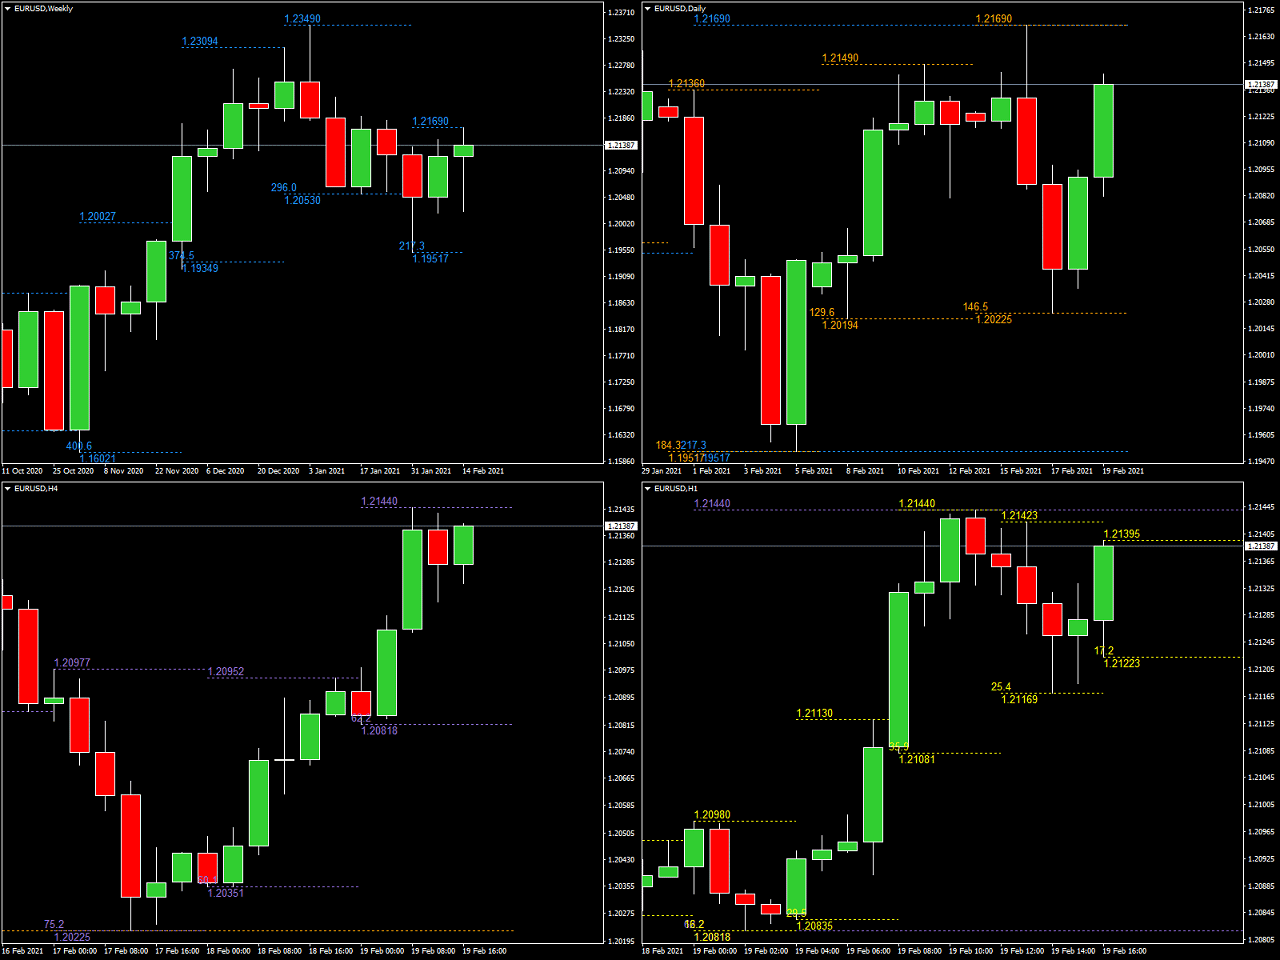
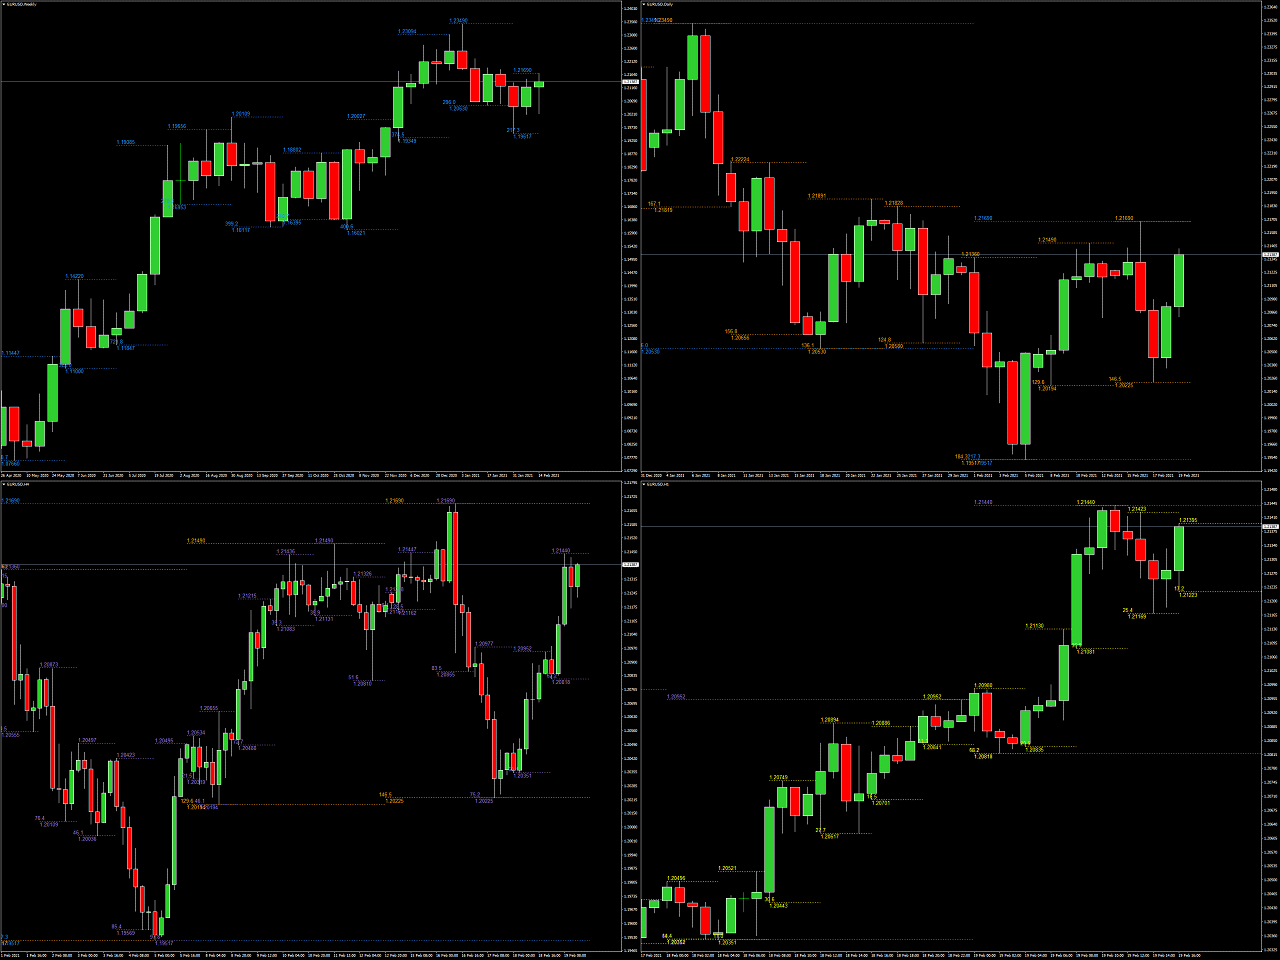
The utility helps to locate in the lower time frames the maximum and minimum of the upper time frame. The length of time frame level line represents the temporal length of the upper time frame. It's possible to OnOff the levels with a button or keys


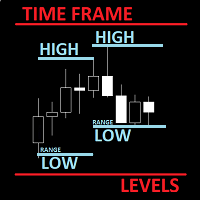
    The indicator draws lines that delimit the upper time frames candle and highlights his high-low price and the pips candle range.

    How it works:

    • Firstly. Choose which time frames levels to represent in the lower ones: monthly, weekly, daily, H4, H1, M30, M15, M5. The default  is set to display in the current time frame all the upper ones.
    • Finally  for each time frame level that you have decided to represent, you need to choose how many  N candles  will produce levels  in the lower time frame.


    Input

    • It is possible to setups for each time frame levels the N candle to represent in the lower time frames
    • You can shut downsingle time frame level  for  all time frames  or you can esclude his representation in a single lower time frame
    • It is possible to customize the color in every time frame level
    • You can shut down separately the text for the  high low  and their  pips ranges. It is also possibile to personalize the  size  and the  angle  of the  texts
    • You can add a text nearby the text of the maximum


      Produtos recomendados
      WT Vwap Bands
      Ricardo Almeida Branco
      O indicador WT Vwap Bands é um indicador que combina o preço e o volume, ajudando a mostrar se está o preço está dentro do "preço justo", sobrecomprado ou sobrevendido. O código do indicador foi pensado visando o desempenho e já testado em conta real de negociação. Além dos inputs visuais (cor, espessura e estilo da linha), o usuário pode definir um valor % que depende do preço. Os valores default trabalham com a banda mais afastada a 1% do preço e depois dividindo esta distância em 3,
      Este indicador é um indicador para análise automática de ondas que é perfeito para negociações práticas! Caso... Nota:   Não estou acostumado a usar nomes ocidentais para classificação de ondas. Devido à influência da convenção de nomenclatura de Tang Lun (Tang Zhong Shuo Zen), nomeei a onda básica como   uma caneta   e a banda de onda secundária como   um segmento   . ao mesmo tempo, o segmento tem a direção da tendência.   O segmento de tendência principal   é nomeado (esse método de nomenc
      The Rocket Trend indicator is trending. The indicator draws two-color points connected by lines along the chart. This is a trend indicator, it is an algorithmic indicator. It is easy to work and understand when a blue circle appears, you need to buy, when a red one appears, sell. The indicator is used for scalping and pipsing, and has proven itself well. Rocket Trend is available for analyzing the direction of the trend for a specific period of time. Ideal for novice traders learning the laws o
      Moving pivot Average Fibonacci The  indicator compares the selected period with its counterpart from the previous period. The indicator determines the moving Fibonacci levels for the day or any time interval to assess the price movement range from the time average. The indicator helps predict the expected high or low for the day based on historical time data. The pivot line can be considered an average trend line and use it in a variety of trading strategies. If you have any question about t
      A useful scanner/dashboard that shows the RSI values for multiple symbols and Time-frames. It can be easily hidden/displayed with a simple click on the scanner man top left of the dashboard. You can input upper and lower RSI values and the colours can be set to show when above/below these values. The default values are 70 and 30. There are also input colours for when the RSI is above or below 50 (but not exceeding the upper/lower levels Symbols and time-frames are input separated by commas.
      Bullish Harami GA
      Osama Echchakery
      The   Bullish Harami candlestick pattern   is formed by two candles. Here’s how to identify the Bullish Harami candlestick pattern: The first candle must be bearish and have a big body The second candle must be small and bullish The second candle is inside the body of the first candle This 2-candle bullish candlestick pattern is a reversal pattern, meaning that it’s used to find bottoms. For this reason, we want to see this pattern after a move to the downside, showing that bulls are starting to
      Mean Reversal Heikin Ashi Indicator calculates special trade reversal points based on Heikin Ashi candlesticks patterns. This indicator can be used on all symbols, even in Forex or B3 Brazillian Markets. You can configure just the position of each arrow. Then, after include the indicator on the graphic, pay attention on each arrow that indicates a long or short trade.
      KT DMA is a modified and advanced version of the classic Displaced Moving Averages with buy/sell crossover alerts and a Multi-Timeframe scanner that shows DMA's direction across each real-time time frame. A Displaced Moving Average is a simple moving average that moves ahead or backward in a time frame (either short-term or long-term). It also allows you to predict price movement more accurately. Features Depicts the trend direction using the alignment of three moving averages. Buy/Sell signa
      SMC Structure Markup
      Seyed Mohammad Hosseini Hejazi
      5 (1)
      Overview The Smart Money Structure Markup Indicator for MetaTrader 5 is a powerful tool designed to help traders identify key market structures based on popular Smart Money Concepts (SMC) strategies. This indicator detects micro-market structures, providing insights into price movements and potential trend changes. It highlights important elements such as valid Break of Structure (BOS), Change of Character (CHoCH), and Inducement (IDM), helping traders to make informed decisions. Key Features Ma
      FREE
      Santo Oscilator
      Gustavo Goncalves
      5 (1)
      Oscilador bem próximo que o indicador SANTO mostrado pelo Bo Williams em sua metodologia PhiCube, para mim este indicador ainda é melhor que o próprio SANTO original. Ótimo para entender a força e tendência de movimentos e possíveis divergências. Preço fazendo topo e o SANTO não renovando máxima, tudo indica que teremos uma reversão ou no mínimo um drawback.
      KT Price Border MT5
      KEENBASE SOFTWARE SOLUTIONS
      KT Price Border creates a three-band price envelope that identifies potential swing high and low areas in the market. These levels can also be used as dynamic market support and resistance. The mid-band can also be used to identify the trend direction. As a result, it also functions as a trend-following indicator. In addition, its ease of use and more straightforward conveyance of trade signals significantly benefit new traders. Features It works well on most of the Forex currency pairs. It
      Signal Eskiya, in addition to channel lines, reflects entry signals in the form of arrows. Trading strategies using the channel indicator belong to the classic methods of technical analysis, are easy to execute, and therefore available even to beginners. Price ranges work equally well on any trading assets and timeframes, they can be used both independently and with additional confirmation from oscillators and market volumes. American traders say: “Trend is your friend”, which means “Trend is
      O indicador ajuda a entrar em uma negociação seguindo a tendência, ao mesmo tempo, após alguma correção. Ele encontra fortes movimentos de tendência de um par de moedas em um determinado número de barras e também encontra níveis de correção para essa tendência. Se a tendência for forte o suficiente e a correção se tornar igual à especificada nos parâmetros, o indicador sinalizará isso. Você pode definir diferentes valores de correção, 38, 50 e 62 (níveis de Fibonacci) são melhores. Além disso,
      Apresentando o Trend Enthusiasm Indicator (TEI), a melhor ferramenta para maximizar os lucros no pregão. Este indicador inovador combina o poder da análise de tendências com a empolgação do sentimento do mercado, proporcionando aos traders uma vantagem única nos mercados financeiros em constante mudança. O TEI usa algoritmos avançados para analisar a tendência subjacente de um instrumento financeiro e o entusiasmo dos traders para identificar oportunidades de alto lucro. Isso permite que os
      SupportResistence
      Eduardo Borges Mariani
      SupportResistance é um indicador de suporte e resistência dinâmico baseado na máxima e na mínima dos candles anteriores. Os parâmetros de cálculo são configuráveis. Pode-se usar como referência os valores máximos e mínimos do candle anterior ou se pode usar a máxima e a mínima de um grupo de candles anteriores. O indicador utiliza de uma linha vermelha para indicar a resistência e uma linha verde para indicar o suporte. Quando um suporte ou uma resistência é rompida, sua linha fica pontilhada, s
      Spike Oscillator
      Vitalii Kondratiuk
      Indicator for searching for price reversals Works well on commodity indices and currency pairs On charts such as Boom Cash, it shows the beginning of a protracted movement well. You can also catch splashes. The indicator uses algorithms, an oscillator and a trend indicator that work together. The indicator shows a candle opening signal (does not disappear, does not redraw and does not recalculate its readings) A good quality tool that can become the basis for creating your own trading system.
      Keltner Channels (ou   Canais de Keltner ) é mais um indicador de   volatilidade   utilizado pela   análise técnica. Também chamado de   envelope , esse canal foi criado por Chester Keltner para monitorar os seus investimentos no mercado futuro de café na década de 1960. Porém, com o passar do tempo, passou também a ser utilizado para outros ativos e, atualmente, é uma das ferramentas mais utilizadas pelos traders. Nesta versão customizada foram adicionados novas opções de método de média movel
      Fibo Ruby
      Ignacio Agustin Mene Franco
      Fibo Ruby indicator 5/5 pack ruby fibo ruby ​​has the strategy of a programmed fibonacci to capture the bullish trend as bass player ideal for grabbing rebounds at the points of 23.6, 38.2, 50.0 and 61.8 It adapts to any temporality, be it for scalping or intraday. works for forex markets, all pairs It is used for synthetic index markets, all pairs great for boom and crash!
      Contact me for instruction, any questions! Introduction The Elliott Wave in technical analysis describes price movements in the financial market that are related to changes in trader sentiment and psychology. The 5 W Pattern (Known as 3 Drives) is an Elliott Wave pattern that is formed by 5 consecutive symmetrical moves up or down. In its bullish form, the market is making 5 drives to a bottom before an uptrend forms. In a bearish 5-drive, it is peaking before the bears take over.  5W Pattern
      Este indicador do painel de controle de zona de oferta e demanda com vários períodos e vários símbolos envia alertas quando o preço atinge uma zona de oferta / demanda. Também é possível usá-lo para ser alertado sobre topos / fundos duplos regulares em vez de zonas. Ele pode ser usado com todos os intervalos de tempo de M1 a MN.       No máximo 9 períodos de tempo podem ser mostrados no painel ao mesmo tempo.   É possível usar RSI, divergência (MACD, OsMA, RSI ou Awesome) e filtros de padrões de
      As   well   as   SuperTrend, SuperTrend Alerts offers alerts . You   can   also   get   alerts   with   SuperTrend   Alerts . Besides   SuperTrend, SuperTrend Alerts   also   offers alerts . SuperTrend   Alerts offers alerts   along   with SuperTrend . In addition to SuperTrend, SuperTrend Alerts   has   alerts . Also , SuperTrend Alerts offers alerts . The   SuperTrend   Alerts   add-on   works   with   SuperTrend   as well. As   well   as   SuperTrend, SuperTrend Alerts   has   alerts   too .
      DTFX Algo Zones are auto-generated Fibonacci Retracements based on market structure shifts. These retracement levels are intended to be used as support and resistance levels to look for price to bounce off of to confirm direction.   USAGE Figure 1 Due to the retracement levels only being generated from identified market structure shifts, the retracements are confined to only draw from areas considered more important due to the technical Break of Structure (BOS) or Change of Character
      Koala Trend Line
      Ashkan Hazegh Nikrou
      4.33 (6)
      Koala Trend Line atualizado para a versão 1.2 Última atualização de melhoria: Novo parâmetro adicionado que permite ao usuário conectar a linha de tendência ao 2º, 3º ou Xº ponto mais alto ou mais baixo. Meu pedido : ** Prezados clientes, por favor, liberem sua avaliação sobre a linha de tendência Koala e deixe-me melhorar com seus comentários. POR QUE O KOALA TREND LINE É INDICADOR GRÁTIS? Acredito que o indicador livre deve ser uma ferramenta qualificada. E OS OUTROS PRODUTOS G
      FREE
      The indicator is the advanced form of the MetaTrader 4 standard Fibonacci tool. It is unique and very reasonable for serious Fibonacci traders. Key Features Drawing of Fibonacci retracement and expansion levels in a few seconds by using hotkeys. Auto adjusting of retracement levels once the market makes new highs/lows. Ability to edit/remove any retracement & expansion levels on chart. Auto snap to exact high and low of bars while plotting on chart. Getting very clear charts even though many ret
      Product Description: Adaptive Y-Axis Scaling is a powerful MT5 indicator designed to enhance your trading experience by providing precise control over the Y-axis (price) scaling of your charts. This innovative tool allows you to customize the price scaling by specifying the number of pips from the visible chart's highs and lows. The calculated price range from this input is then used to set the maximum and minimum prices for the open chart, ensuring an optimized and comprehensive view of market
      FREE
      Over Trend MT5
      Mansour Babasafary
      Trend based indicator Identify trends with this indicator A simple-to-use trend indicator No complicated settings Attributes: Can be used in all symbols Can be used in all time frames Relatively high signals No complicated settings Specific to the trend Lifetime support Settings: Alarm Show Alert: By activating these settings, after receiving the signal, you will receive an alarm in Metatrader Alarm Show Notification: By activating these settings, after receiving the signal, you will rec
      Para um download gratuito, junte-se ao nosso grupo. Oferta por tempo limitado! Apresentamos nosso inovador indicador MQL5, projetado para melhorar sua experiência de negociação fornecendo sinais visuais claros dos limites das velas diárias em timeframes menores. Esta ferramenta é perfeita para traders que desejam se manter informados sobre o progresso da vela diária, garantindo uma melhor tomada de decisões e execução de estratégias. Principais características Visualização da Caixa de Vela Diári
      WT Vwap 5 Bands
      Ricardo Almeida Branco
      WT Vwap 5 Bands O indicador WT Vwap Bands é um indicador que combina o preço e o volume, ajudando a mostrar se está o preço está dentro do "preço justo", sobrecomprado ou sobrevendido. O código do indicador foi pensado visando o desempenho e já testado em conta real de negociação. Além dos inputs visuais (cor, espessura e estilo da linha), o usuário pode definir um valor % que depende do preço. Os valores default trabalham com a banda mais afastada a 1% do preço e depois dividindo est
      Bem-vindo ao Indicador Provlepsis "Provlepsis" é um indicador altamente avançado projetado para o Mercado MQL. Ao analisar barras anteriores no mesmo horário do dia, ele calcula com precisão o potencial intervalo de movimento do mercado, fornecendo informações valiosas sobre futuras flutuações de preço. Ao contrário do indicador ATR tradicional, "Provlepsis" leva em consideração o fator tempo, resultando em uma ferramenta mais poderosa que se adapta às diferentes condições de mercado. Durante a
      FREE
      Xtrade Trend Detector
      Dago Elkana Samuel Dadie
      Xtrade Trend Detector is an indicator capable of finding the best opportunities to take a position in any stock market. Indeed, it is a great tool for scalpers but also for Daytraders. You could therefore use it to identify areas to trade, it fits easily on a chart. I use it to detect trends on Big timeframes and take positions on Small timeframes. Don't hesitate to give me a feedback if you test it.
      Os compradores deste produto também adquirem
      Trend Screener Pro MT5
      STE S.S.COMPANY
      4.88 (68)
      Desbloqueie o poder da negociação de tendências com o indicador Trend Screener: sua solução definitiva de negociação de tendências, alimentada por lógica difusa e sistema de múltiplas moedas! Eleve sua negociação de tendências com o Trend Screener, o revolucionário indicador de tendências alimentado por lógica difusa. É um poderoso indicador de acompanhamento de tendências que combina mais de 13 ferramentas e recursos premium e 3 estratégias de negociação, tornando-o uma escolha versátil para to
      TPSproTREND PrO MT5
      Roman Podpora
      4.54 (13)
      TPSpro TREND PRO  - is a trend indicator that automatically analyzes the market and provides information about the trend and each of its changes, as well as giving signals for entering trades without redrawing! The indicator uses each candle, analyzing them separately. referring to different impulses - up or down impulse. Exact entry points into transactions for currencies, crypto, metals, stocks, indices!  INSTRUCTIONS     RUS   -    ENG              R ecommended to use with an indicator   - 
      Agora US $ 147 (aumentando para US $ 499 após algumas atualizações) - Contas ilimitadas (PCs ou Macs) Manual do usuário do RelicusRoad + vídeos de treinamento + acesso ao grupo de discórdia privado + status VIP UMA NOVA FORMA DE OLHAR PARA O MERCADO O RelicusRoad é o indicador de negociação mais poderoso do mundo para forex, futuros, criptomoedas, ações e índices, oferecendo aos traders todas as informações e ferramentas necessárias para se manterem rentáveis. Fornecemos análises técnica
      TPSpro RFI Levels MT5
      Roman Podpora
      4.67 (15)
      INSTRUÇÕES         Russo   -        ENG       R   ecomendado para uso com um indicador       -       TPSpro   TREND PRO -   Versão MT4         Um elemento-chave na negociação são as zonas ou níveis a partir dos quais as decisões de comprar ou vender um instrumento de negociação são tomadas. Apesar das tentativas dos principais participantes de esconder sua presença no mercado, eles inevitavelmente deixam rastros. Nossa tarefa era aprender como identificar esses rastros e interpretá-los corretame
      CBT Quantum Maverick Sistema de Negociação de Opções Binárias de Alta Eficiência O CBT Quantum Maverick é um sistema de opções binárias de alto desempenho, projetado para traders que buscam precisão, simplicidade e um enfoque disciplinado. Não exige personalização: o sistema está otimizado para resultados eficazes desde o início. Basta seguir os sinais, que podem ser dominados com um pouco de prática. Principais características: Precisão nos sinais: Sinais baseados na próxima vela, utilizand
      Golden Trend Indicator MT5
      Noha Mohamed Fathy Younes Badr
      4.78 (9)
      Golden Trend indicator  is The best indicator for predicting trend movement this indicator never lags and never repaints and never back paints    and give  arrow buy and sell    before the candle appear  and it will help you and  will make your trading decisions clearer its work on all currencies and  gold and crypto and all time frame This unique  indicator uses very secret algorithms to catch the  trends, so you can trade using this indicator and see the trend clear on charts  manual guide and
      Quantum TrendPulse
      Bogdan Ion Puscasu
      5 (4)
      Apresentando   Quantum TrendPulse   , a ferramenta de negociação definitiva que combina o poder do   SuperTrend   ,   RSI   e   Stochastic   em um indicador abrangente para maximizar seu potencial de negociação. Projetado para traders que buscam precisão e eficiência, este indicador ajuda você a identificar tendências de mercado, mudanças de momentum e pontos de entrada e saída ideais com confiança. Principais características: Integração SuperTrend:   siga facilmente a tendência predominante do
      FX Power MT5 NG
      Daniel Stein
      5 (7)
      Desbloquear todo o poder do FX Power NG: o derradeiro medidor de força da moeda Durante mais de oito anos, o FX Power capacitou os operadores de todo o mundo com uma análise fiável e precisa da força da moeda. Agora, o FX Power NG leva esta ferramenta de confiança para o próximo nível, oferecendo funcionalidades avançadas que proporcionam uma precisão, personalização e conhecimentos inigualáveis à sua negociação. O que faz do FX Power NG uma ferramenta indispensável para os operadores sérios
      Antes de tudo, vale ressaltar que esta Ferramenta de Negociação é um Indicador Não Repintante, Não Redesenhante e Não Atrasado, o que a torna ideal para negociação profissional. Curso online, manual do utilizador e demonstração. O Indicador de Conceitos de Ação de Preço Inteligente é uma ferramenta muito poderosa tanto para traders novos quanto experientes. Ele combina mais de 20 indicadores úteis em um único, combinando ideias avançadas de negociação como Análise do Trader do Círculo Intern
      FX Volume MT5
      Daniel Stein
      4.93 (14)
      Ganhe uma verdadeira vantagem no Forex com o Volume FX: O melhor indicador de volume O FX Volume é o primeiro e único indicador de volume a revelar o sentimento genuíno do mercado a partir de uma perspetiva interna. Ao fornecer informações exclusivas sobre como os participantes do mercado institucional e os corretores estão posicionados, o FX Volume permite que você negocie com a previsão geralmente reservada para os principais participantes. Diga adeus aos atrasos dos relatórios COT - o FX Vo
      Este painel mostra os últimos   padrões harmónicos   disponíveis para os símbolos seleccionados, pelo que poupará tempo e será mais eficiente /   versão MT4 . Indicador gratuito:   Basic Harmonic Pattern Colunas do indicador Symbol :   aparecem os símbolos seleccionados Trend :   de alta ou de baixa Pattern :   tipo de padrão (gartley, borboleta, morcego, caranguejo, tubarão, cifra ou ABCD) Entry :   preço de entrada SL:   preço de paragem de perda TP1:   preço do 1º take profit TP2:   preç
      Primeiramente, vale ressaltar que este Sistema de Trading é um Indicador Não Repintado, Não Redesenho e Não Atrasado, o que o torna ideal tanto para o trading manual quanto para o automatizado. Curso online, manual e download de predefinições. O "Sistema de Trading Inteligente MT5" é uma solução completa de trading projetada para traders novos e experientes. Ele combina mais de 10 indicadores premium e apresenta mais de 7 estratégias de trading robustas, tornando-o uma escolha versátil para dive
      Matrix Arrow Indicator MT5
      Juvenille Emperor Limited
      5 (13)
      O   Matrix Arrow Indicator MT5   é uma tendência única 10 em 1 seguindo um indicador multi-timeframe   100% sem repintura   que pode ser usado em todos os símbolos/instrumentos:   forex ,   commodities ,   criptomoedas ,   índices ,   ações .  O  Matrix Arrow Indicator MT5  determinará a tendência atual em seus estágios iniciais, reunindo informações e dados de até 10 indicadores padrão, que são: Índice de movimento direcional médio (ADX) Índice de canal de commodities (CCI) Velas clássicas de
      FX Dynamic - O único indicador ATR de que você sempre precisará Pronto para turbinar suas estratégias de negociação com precisão e perceção incomparáveis? Conheça o FX Dynamic , o primeiro e único indicador ATR projetado para análise baseada em moeda e o ajuste automático para mudanças de GMT dos corretores . Diga adeus às ferramentas ultrapassadas e abrace a solução definitiva para dominar a volatilidade do mercado. Por que o FX Dynamic é um divisor de águas Análise ATR baseada em moeda -
      MetaForecast M5
      Vahidreza Heidar Gholami
      5 (2)
      MetaForecast prevê e visualiza o futuro de qualquer mercado com base nas harmonias nos dados de preços. Embora o mercado nem sempre seja previsível, se houver um padrão nos preços, o MetaForecast pode prever o futuro com a maior precisão possível. Em comparação com outros produtos similares, o MetaForecast pode gerar resultados mais precisos ao analisar as tendências do mercado. Parâmetros de entrada Past size (Tamanho do passado) Especifica o número de barras que o MetaForecast usa para criar
      TPA True Price Action indicator reveals the true price action of the market makers through 100% non-repainting signals strictly at the close of a candle! TPA shows entries and re-entries, every time the bulls are definitely stronger than the bears and vice versa. Not to confuse with red/green candles. The shift of power gets confirmed at the earliest stage and is ONE exit strategy of several. There are available now two free parts of the TPA User Guide for our customers. The first "The Basics"
      Atomic Analyst MT5
      Issam Kassas
      4.32 (19)
      Primeiramente, vale ressaltar que este Indicador de Negociação não repinta, não redesenha e não apresenta atrasos, tornando-o ideal tanto para negociação manual quanto automatizada. Manual do utilizador: configurações, entradas e estratégia. O Analista Atômico é um Indicador de Ação de Preço PA que utiliza a força e o momentum do preço para encontrar uma vantagem melhor no mercado. Equipado com filtros avançados que ajudam a remover ruídos e sinais falsos, e aumentam o potencial de negociação.
      Apresentando       Quantum Breakout PRO   , o inovador Indicador MQL5 que está transformando a maneira como você negocia Breakout Zones! Desenvolvido por uma equipe de traders experientes com experiência comercial de mais de 13 anos,       Quantum Breakout PRO       foi projetado para impulsionar sua jornada comercial a novos patamares com sua estratégia de zona de fuga inovadora e dinâmica. O Quantum Breakout Indicator lhe dará setas de sinal em zonas de breakout com 5 zonas-alvo de lucro e
      Descubra os níveis de FX: O seu melhor indicador de suporte e resistência para o sucesso da negociação O FX Levels é mais do que apenas um indicador de suporte e resistência; é um divisor de águas para traders sérios que desejam precisão, confiabilidade e funcionalidade contínua em todos os símbolos de negociação - sejam pares de moedas, índices, ações ou commodities. Construído com base no comprovado método Lighthouse e aprimorado com adaptabilidade dinâmica e em tempo real, o FX Levels traz
      IX Power MT5
      Daniel Stein
      4.17 (6)
      Apresentamos o IX Power - a ferramenta definitiva para aumentar a sua precisão de negociação! Concebido com a mesma precisão imbatível do FX Power, o IX Power permite-lhe dominar qualquer símbolo de negociação, desde índices e acções a mercadorias, ETFs e até criptomoedas. Prepare-se para elevar a sua negociação com informações precisas sobre tendências de curto, médio e longo prazo em todos os seus activos favoritos. Porquê escolher a IX Power? Com o IX Power, seu tempo se torna nítido, ajud
      Easy Buy Sell is a market indicator for opening and closing positions. It becomes easy to track market entries with alerts. It indicates trend reversal points when a price reaches extreme values ​​and the most favorable time to enter the market. it is as effective as a Fibonacci to find a level but it uses different tools such as an algorithm based on ATR indicators and Stochastic Oscillator. You can modify these two parameters as you wish to adapt the settings to the desired period. It canno
      ATrend
      Zaha Feiz
      4.88 (8)
      ATREND: Como Funciona e Como Usá-lo #### Como Funciona O indicador "ATREND" para a plataforma MT5 é projetado para fornecer aos traders sinais robustos de compra e venda, utilizando uma combinação de metodologias de análise técnica. Este indicador aproveita principalmente o Intervalo Verdadeiro Médio (ATR) para medir a volatilidade, juntamente com algoritmos de detecção de tendências para identificar possíveis movimentos de mercado. Deixe uma mensagem após a compra e receba um brinde especial.
      Enjoy a   50% OFF   Christmas holiday sale!   Offer ends 27 December 2025 . After your purchase, feel free to contact me for more details on how to receive a bonus indicator called VFI, which pairs perfectly with Easy Breakout for enhanced confluence!     Easy Breakout MT5   is a powerful price action trading system built on one of the most popular and widely trusted strategies among traders: the   Breakout strategy ! This indicator delivers crystal-clear Buy and Sell signals based on bre
      Auto Order Block with break of structure based on ICT and Smart Money Concepts (SMC) Futures Break of Structure ( BoS )             Order block ( OB )            Higher time frame Order block / Point of Interest ( POI )    shown on current chart           Fair value Gap ( FVG ) / Imbalance   -  MTF      ( Multi Time Frame )    HH/LL/HL/LH  -  MTF      ( Multi Time Frame )  Choch  MTF      ( Multi Time Frame )  Volume Imbalance     ,  MTF          vIMB Gap’s Power of 3 Equal High
      Torne-se um Negociador Breaker e lucre com as mudanças na estrutura do mercado à medida que o preço reverte. O indicador de quebra de bloco de pedidos identifica quando uma tendência ou movimento de preço está chegando à exaustão e pronto para reverter. Ele o alerta sobre mudanças na estrutura do mercado, que normalmente ocorrem quando uma reversão ou uma grande retração está prestes a ocorrer. O indicador usa um cálculo proprietário que identifica rupturas e momento do preço. Toda vez que
      Este é um indicador para MT5 que fornece sinais precisos para entrar em uma negociação sem redesenhar. Ele pode ser aplicado a qualquer ativo financeiro: forex, criptomoedas, metais, ações, índices. Ele fornecerá estimativas bastante precisas e informará quando é melhor abrir e fechar um negócio. Assista o vídeo (6:22) com um exemplo de processamento de apenas um sinal que compensou o indicador! A maioria dos traders melhora seus resultados de negociação durante a primeira semana de negociação c
      O Support And Resistance Screener está em um indicador de nível para MetaTrader que fornece várias ferramentas dentro de um indicador. As ferramentas disponíveis são: 1. Screener de estrutura de mercado. 2. Zona de retração de alta. 3. Zona de retração de baixa. 4. Pontos de Pivô Diários 5. Pontos Pivot semanais 6. Pontos Pivot mensais 7. Forte suporte e resistência com base no padrão harmônico e volume. 8. Zonas de nível de banco. OFERTA POR TEMPO LIMITADO: O indicador de suporte e resistência
      MetaBands M5
      Vahidreza Heidar Gholami
      4.5 (2)
      MetaBands utiliza algoritmos poderosos e únicos para desenhar canais e detectar tendências, a fim de fornecer aos traders pontos potenciais para entrar e sair de negociações. É um indicador de canal mais um indicador de tendência poderoso. Inclui diferentes tipos de canais que podem ser mesclados para criar novos canais simplesmente usando os parâmetros de entrada. O MetaBands usa todos os tipos de alertas para notificar os usuários sobre eventos de mercado. Recursos Suporta a maioria dos algori
      Berma Bands
      Muhammad Elbermawi
      The Berma Bands (BBs) indicator is a valuable tool for traders seeking to identify and capitalize on market trends. By analyzing the relationship between the price and the BBs, traders can discern whether a market is in a trending or ranging phase. Berma Bands are composed of three distinct lines: the Upper Berma Band, the Middle Berma Band, and the Lower Berma Band. These lines are plotted around the price, creating a visual representation of the price movement relative to the overall trend.
      Contact me for instruction, any questions! Related Product:  Gold Trade Expert MT5 Introduction The breakout and retest strategy is traded support and resistance levels. it involves price breaking through a previous level.  The break and retest strategy is designed to help traders do two main things, the first is to avoid false breakouts. Many false breakouts start with a candlestick that breaks out of a level but ends with an immediate candlestick that brings the price back into the level. T
      Mais do autor
      The Better Volume indictator improves the comprehension on volume by coloring the classical histogram bars . The colors point out differents nature of volume . The Better Volume OnOff   allows to  open/close the subwindow   through  a botton   or using the keyboard   only.  There is the possibility to customize 3 symbols  and assign them  different parameters   for each time frame . The indicator   improves the comprehension   on volume by coloring the classical histogram bars : CLIMAX UP -
      The Moving Averages On-Off  let you  control the indicator  using  the keyboard  or a  button . You can choose if you want the indicator always shown or always hided while switching among different time frames or financial instruments .    --->  This indicator is part of Combo Indicator OnOff It's possible to  setup three Moving Averages : Short ,  Medium ,  Long   Input You can customize the price type used for calculation : close, open, high, low, median price, typical price, weighted It
      FREE
      The Bolliger Bands On-Off let you control the indicator  using  the keyboard  or a  button . You can choose if you want the indicator always shown or always hided while switching among different time frames or financial instruments .    --->  This indicator is part of Combo Indicator OnOff The Bollinger Bands identify the degree of real-time volatility for a financial instruments . A lower amplitude corresponds to a low volatility, conversely a greater bandwidth corresponds to high volatility
      FREE
      The purpose of the Combo OnOff indicator is combine differerent tecniques and approachs to the market in order to spot signals that occur simultaneosly. A signal is more accurate if it is validate from more indicators as the adaptive expectations can be used to predict prices.The On-Off  feature and alarms help to look for the better prices to enter/exit in the markets Moving Averages are statistics that captures the average change in a data series over time Bollinger Bands is formed by upp
      Returns MT5
      Fabrizio Malavasi
      This indicator shows the value of returns in the selected time frame They are calculated as logarithm of returns , rather than price or raw returns. For small returns, arithmetic and logarithmic returns will be similar. The benefit of using returns, versus prices, is normalization. It is possible measures all variables in a comparable metric despite originating from price series of unequal values Inputs You can display data both as a Histogram  or a   Line It's also possible to display  the
      FREE
      The Bolliger Bands On-Off let you control the indicator  using  the keyboard  or a  button . You can choose if you want the indicator always shown or always hided while switching among different time frames or financial instruments . --->  This indicator is part of Combo Indicator OnOff The Bollinger Bands identify the degree of real-time volatility for a financial instruments . A lower amplitude corresponds to a low volatility, conversely a greater bandwidth corresponds to high volatility. N
      FREE
      This utility allows to switch among symbols. You have to insert in the input your favorite tickers. it is possible to customize up to 5 symbols   Shortcut Keys :   Switch among  Symbols :   A  -Forward    D  -Backward Inputs You can setup your favorite  keys to switch among symbols. You can customize the color of background   and the edge   of the buttons . You can customize the labels : dimension and font.
      FREE
      Returns MT4
      Fabrizio Malavasi
      This indicator shows the value of returns in the selected time frame . They are calculated as logarithm of returns , rather than price or raw returns. For small returns, arithmetic and logarithmic returns will be similar. The benefit of using returns, versus prices, is normalization. It is possible measures all variables in a comparable metric despite originating from price series of unequal values. Inputs You can display data both as a Histogram  or a    Line It's also possible to display
      FREE
      The Moving Averages On-Off  let you  control the indicator  using  the keyboard  or a  button . You can choose if you want the indicator always shown or always hided while switching among different time frames or financial instruments . --->  This indicator is part of Combo Indicator OnOff It's possible to use three Moving Averages , defined as  Short ,  Medium ,  Long or Raimbow MA 5,10,20,50,100,200. Input MOVING AVERAGES You can customize the price type used for calculation : close,
      FREE
      This utility allows to switch among symbols. You have to insert in the input your favorite tickers. it is possible to customize up to 5 symbols   Shortcut Keys :   Switch among  Symbols :   A  -Forward    D  -Backward Inputs You can setup your favorite  keys to switch among symbols. You can customize the color of background   and the edge   of the buttons . You can customize the labels : dimension and font.
      FREE
      The purpose   of this utility is to manage one or more subwindow in the same chart by opening and closing them through a button or the keyboard keys How it works: If you want to handle more than one subwindow you need to reinstall the indicator . In this case some setups has to be customized onlu in the last subwindow installed and others setups in the installed subwindow during the first time installation. They are denoted in the input rispectively as ' LW ' and ' IW '. First of all insta
      The utility helps to locate in the  lower time frames  the maximum and minimum of the upper  time frame.  The length of time frame level line  represents the temporal  length of the upper time frame. The indicator draws lines that delimit the upper time frames candle and highlights his high-low price, the pips candle range, the returns and the volatility. How it works: Firstly . Choose which time frames levels to represent in the lower ones : monthly, weekly, daily, H4, H1, M30, M15, M5.
      The Better Volume indictator improves the comprehension on volume by coloring the classical histogram bars . The colors point out differents nature of volume . Further through two buttons and without change the main chart it is possibile to change the time frames and navigate among three symbols . The alerts will work accordingly. For each symbol can be  choosed the LookBack and Ma periods . The possibility to show/hide the indicator allows you to focus on the price . The subwindow can be hid
      This utility can compare simultaneously time frames of different instruments and keep under control   the nine major time frames  of an instrument. It is composed by two changers, a crosshair and some additional components : the  multicharts time frames changer   is designed to  compare  simultaneously  up to thirty time frames  of different symbols with the  keyboard or the button the multicharts symbols changer can  link up to nine charts and control simultaneously the nine major time frame b
      The Multicharts Crosshair draws a cross hair in any linked chart. The indicator can be used for comparison of symbol price levels in different time frame or to compare candles of different instruments in the same time frame How it works: It can works from every linked charts where the indicator is installed towards the others or from the chart where is istalled towards the following linked charts . It can be shown just pressing a the key of keyboard. After installing the indicators in the cha
      The purpose of the Combo OnOff indicator is combine differerent tecniques and approachs to the market in order to spot signals that occur simultaneosly. A signal is more accurate if it is validate from more indicators as the adaptive expectations can be used to predict prices.The On-Off  feature and alarms help to look for the better prices to enter/exit in the markets Moving Averages are statistics that captures the average change in a data series over time Bollinger Bands is formed by upp
      The purpose   of this utility is to manage one or more subwindow in the same chart by opening and closing them through a button or the keyboard keys How it works: If you want to handle more than one subwindow you need to reinstall the indicator . In this case some setups has to be customized onlu in the last subwindow installed and others setups in the installed subwindow during the first time installation. They are denoted in the input rispectively as ' LW ' and ' IW '. First of all insta
      This utility can compare simultaneously time frames of different instruments and keep under control   the nine major time frames  of an instrument. It is composed by two changers, a crosshair and some additional components : the  multicharts time frames changer   is designed to  compare  simultaneously  up to thirty time frames  of different symbols with the  keyboard or the button the multicharts symbols changer can  link up to nine charts and control simultaneously the nine major time frame b
      The Multicharts Crosshair draws a cross hair in any linked chart. The indicator can be used for comparison of symbol price levels in different time frame or to compare candles of different instruments in the same time frame How it works: It can works from every linked charts where the indicator is installed towards the others or from the chart where is istalled towards the following linked charts . It can be shown just pressing a the key of keyboard. After installing the indicators in the cha
      Filtro:
      krisnara123
      1916
      krisnara123 2022.10.24 12:58 
       

      O usuário não deixou nenhum comentário para sua avaliação

      Responder ao comentário
      Versão 1.1 2022.10.24
      - Added a button and shortcut keys to OnOff the levels