MA Dashboard MT5
- Indicadores
- Taras Slobodyanik
- Versão: 3.60
- Atualizado: 22 maio 2024
- Ativações: 10
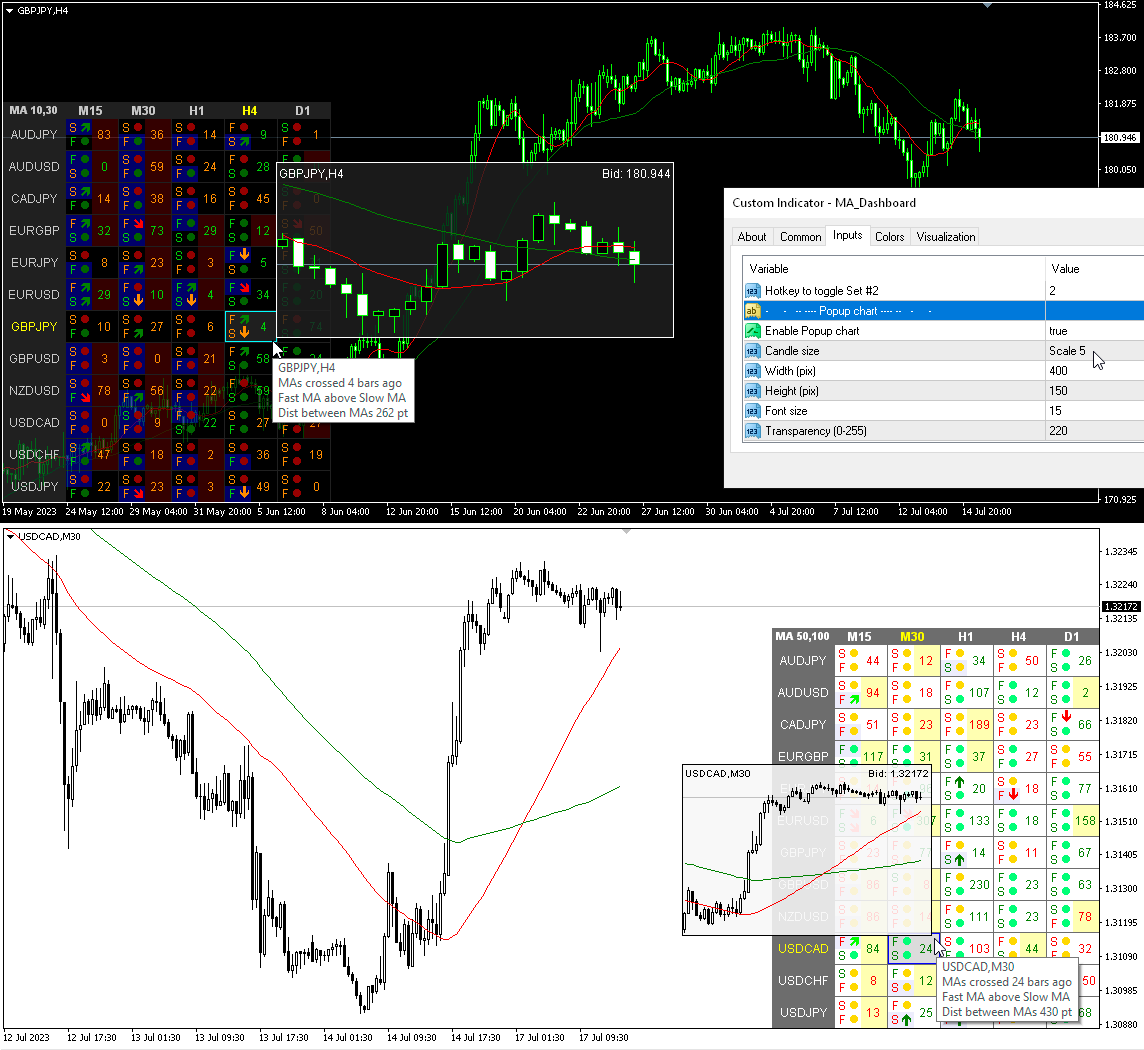
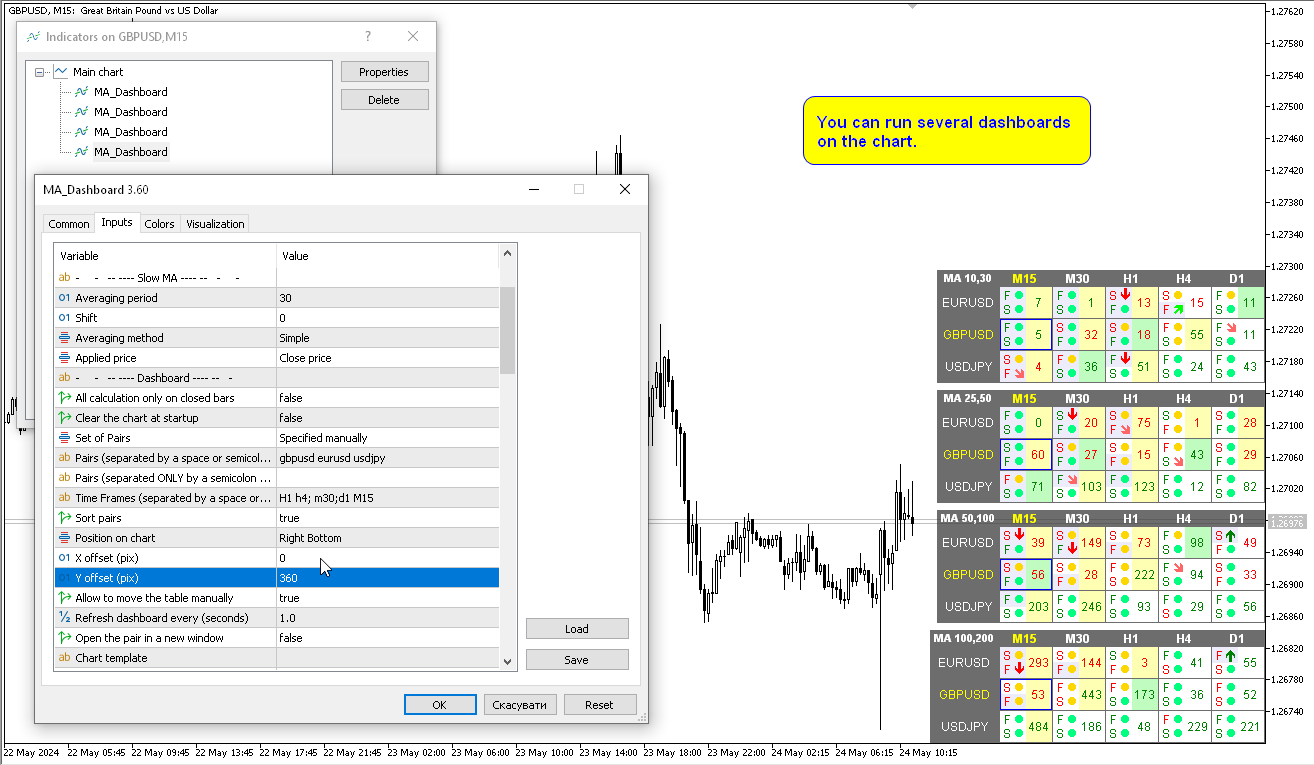
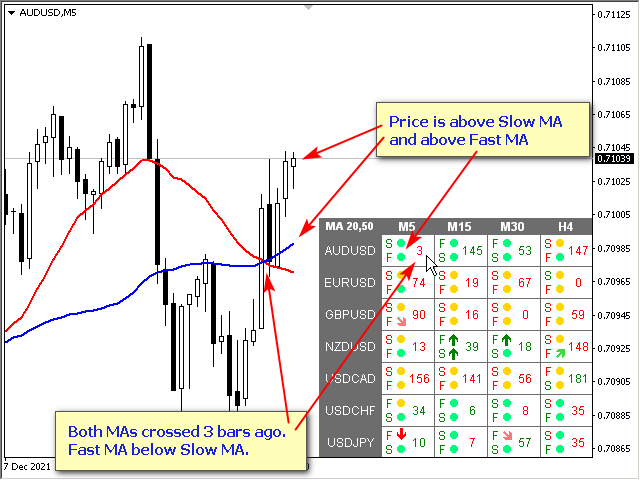
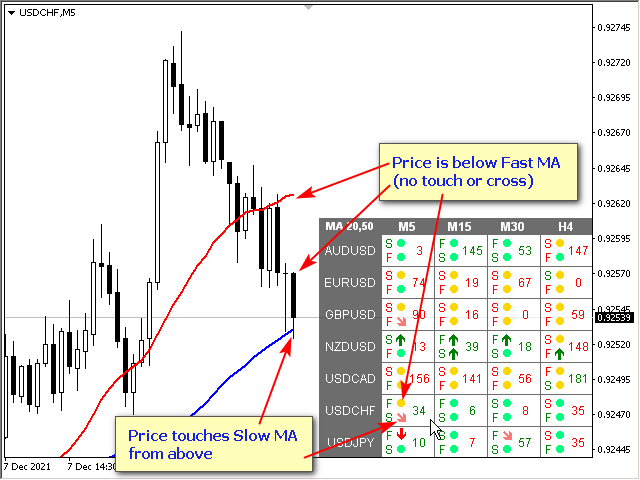
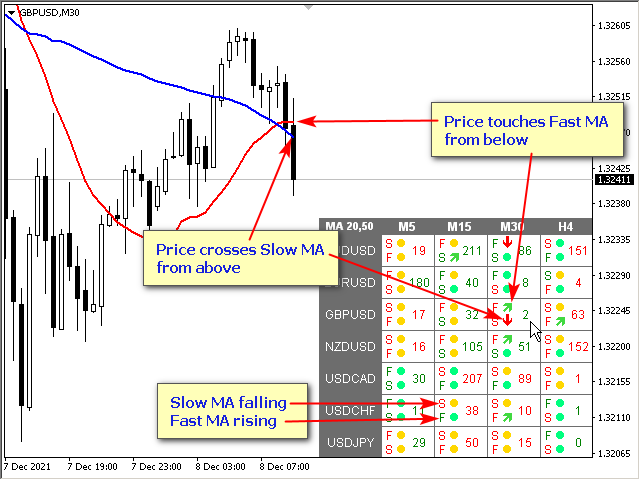
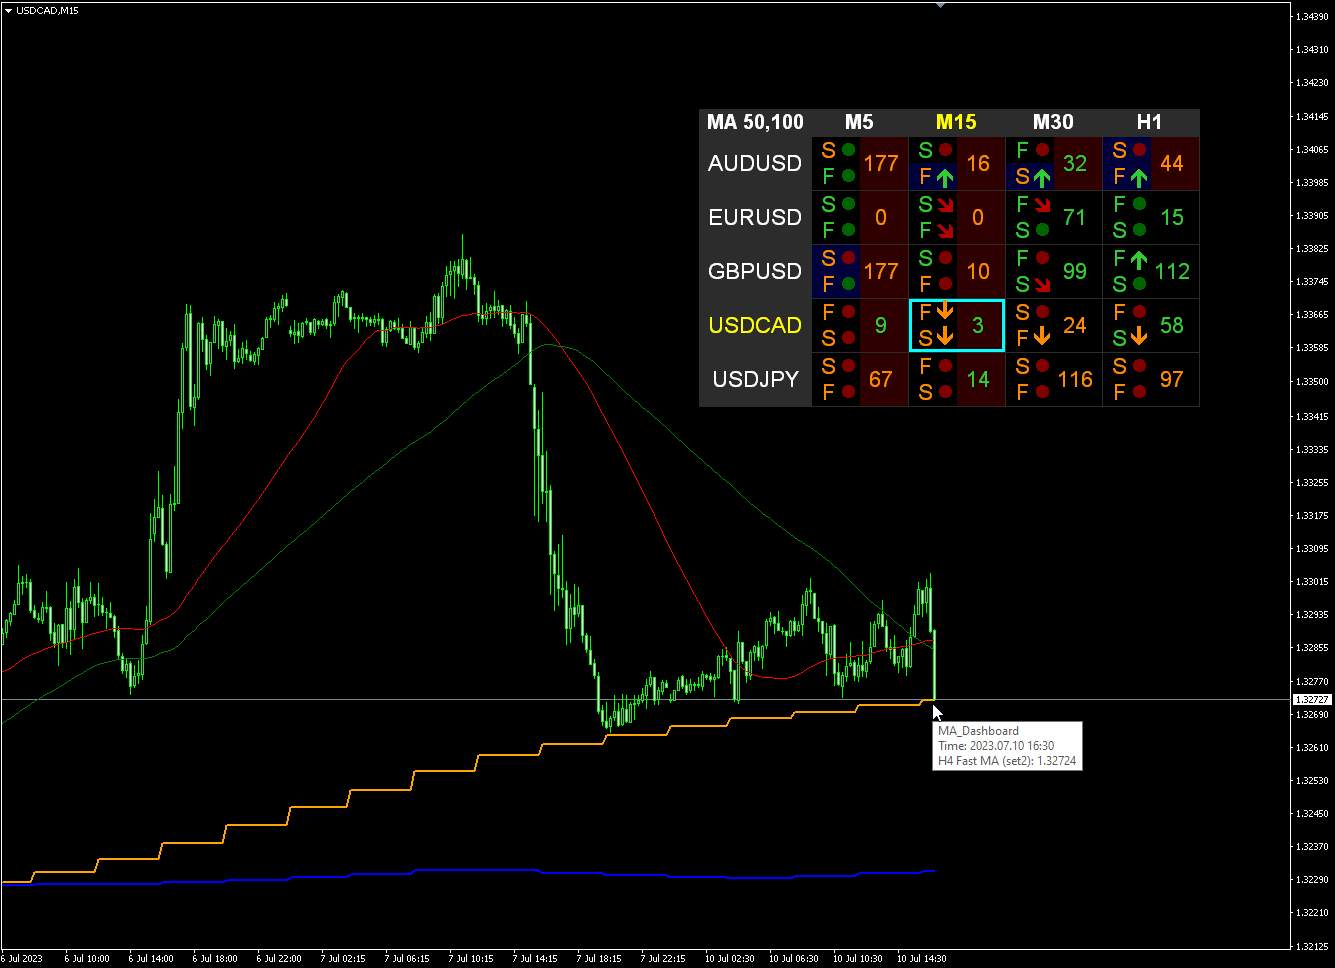
Modificação multimoeda e multitimeframe do indicador Moving Average (MA). No painel você pode ver o estado atual do indicador - rompimentos e toques (por preço) do MA Rápido e MA Lento, bem como a intersecção das linhas MA entre si (cruzamento da média móvel). Nos parâmetros você pode especificar quaisquer moedas e prazos desejados. Além disso, o indicador pode enviar notificações sobre o preço tocando as linhas e sobre o seu cruzamento. Ao clicar em uma célula com ponto final, este símbolo e ponto final serão abertos. Este é o scanner MTF. Você pode executar vários painéis no gráfico.
O indicador exibe linhas MA rápida e MA lenta no gráfico atual. Você pode selecionar o período MA para o gráfico e observar o MA de outros períodos (MTF MA). As teclas de atalho para os dois conjuntos de MA são “1” e “2” por padrão.
A chave para ocultar o painel do gráfico é “D” por padrão.
Parâmetros
Fast MA — MA rápido
Averaging period — Período médio.
Shift — Mudança.
Averaging method — Método de média.
Applied price — Preço aplicado.
Slow MA — MA lento
Averaging period — Período médio.
Shift — Mudança.
Averaging method — Método de média.
Applied price — Preço aplicado.
Painel
All calculation only on closed bar — Todos os cálculos somente em barra fechada.
Clear the chart at startup — limpe o gráfico na inicialização.
Set of Pairs — Conjunto de Pares
— Market Watch — pares do "Market Watch".— Specified manually — pares especificados manualmente, nos parâmetros "Pares".— Current pair — mostra apenas o par atual.
Pairs (separated by a space or semicolon) — lista de símbolos separados por espaço ou ponto e vírgula. Os nomes das moedas devem ser escritos exatamente como os da corretora, mantendo a caixa e o prefixo/sufixo.
Time Frames (separated by a space or semicolon) — lista de prazos separados por espaços ou ponto e vírgula (vários prazos).
Sort pairs — classificando a lista de pares.
Position on chart — canto para exibir o painel no gráfico.
X offset (pix) — desloca o painel ao longo do eixo X;
Y offset (pix) — desloca o painel ao longo do eixo Y;
Refresh dashboard every (seconds) — período de atualização para todos os pares e intervalos de tempo.
Open the pair in a new window — abra um símbolo em uma nova janela do gráfico clicando.
Chart template — o nome do modelo do gráfico, se o gráfico for aberto em uma nova janela.
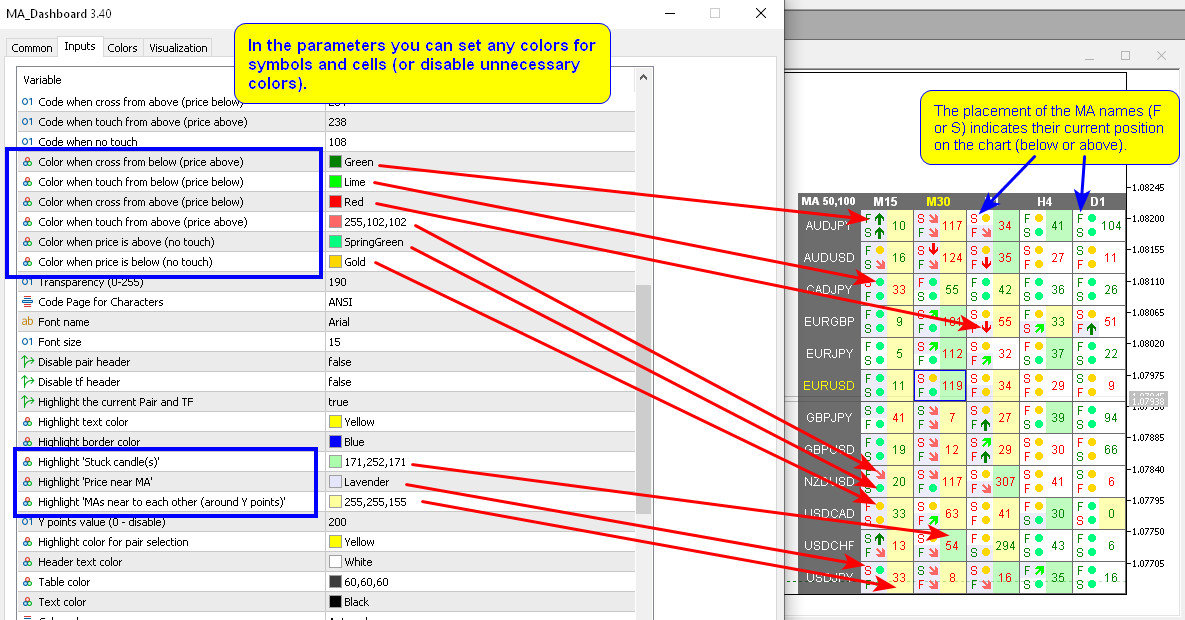
Code when cross from below (price above) — Código quando cruzado por baixo (preço acima);
Code when touch from below (price below) — Código ao tocar por baixo (preço abaixo);
Code when cross from above (price below) — Código quando cruzado de cima (preço abaixo);
Code when touch from above (price above) — Código ao tocar por cima (preço acima);
Code when no touch — Codifique quando não houver toque;
Transparency (0-255) — Transparência (0-255);
Font name — Nome da fonte;
Font size — Tamanho da fonte.
Alertas
Timeframes for alerts (separated by a space or semicolon) — Prazos para alertas (separados por espaço ou ponto e vírgula).
Fast MA crosses Slow MA — MA rápida cruza MA lenta;
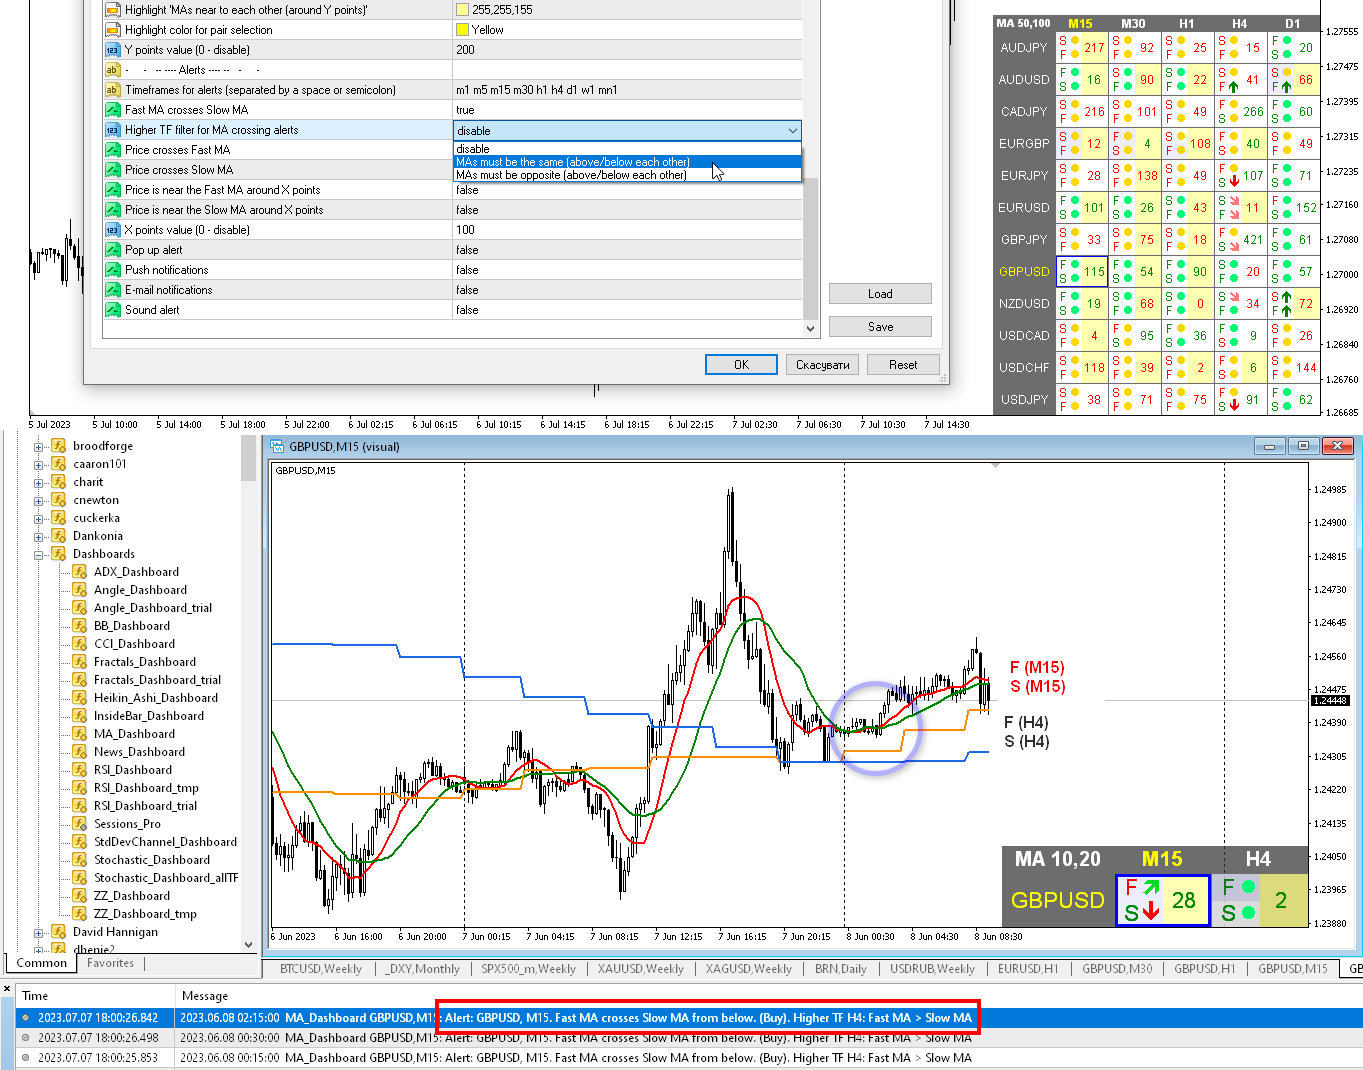
Higher TF filter for MA crossing alerts — Filtro TF mais alto para alertas de cruzamento MA — quando o filtro estiver habilitado, quando as MAs cruzarem, o indicador verificará os valores da MA do próximo período superior (no painel). Caso os MAs do período superior atendam às condições especificadas, será enviado o alerta de cruzamento do MA, caso contrário não haverá alerta.
- disable — desabilitar
- MAs must be the same (above/below each other) — MAs devem ser iguais (acima/abaixo um do outro)
- MAs must be opposite (above/below each other) — MAs devem ser opostos (acima/abaixo um do outro)
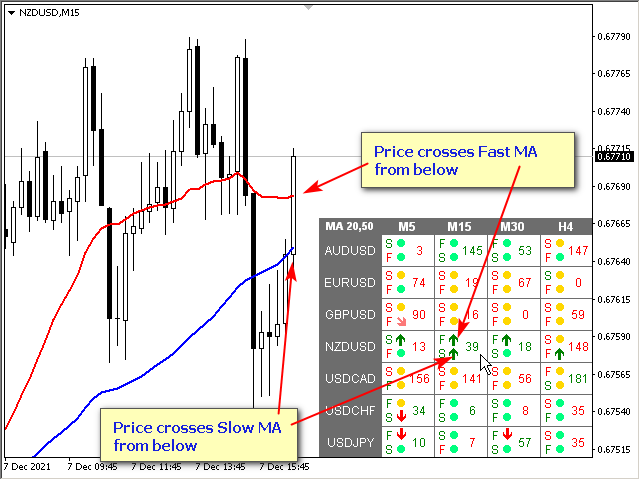
Price crosses Fast MA — Preço cruza Fast MA;
Price crosses Slow MA — Preço cruza Slow MA;
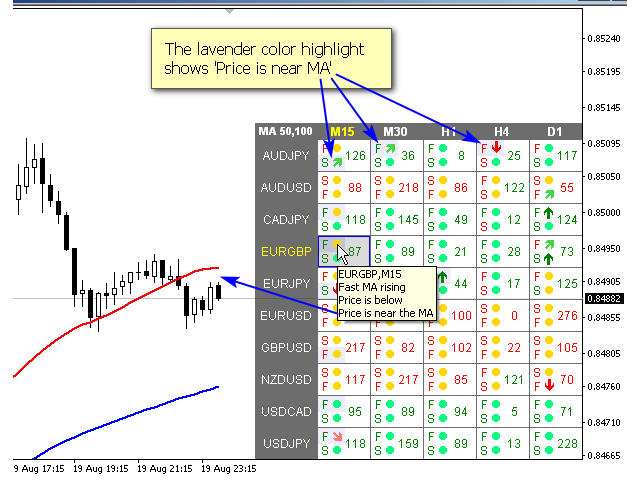
Price is near the Fast MA around X points — O preço está próximo do MA rápido em torno de X pontos
Price is near the Slow MA around X points — O preço está próximo do Slow MA em torno de X pontos
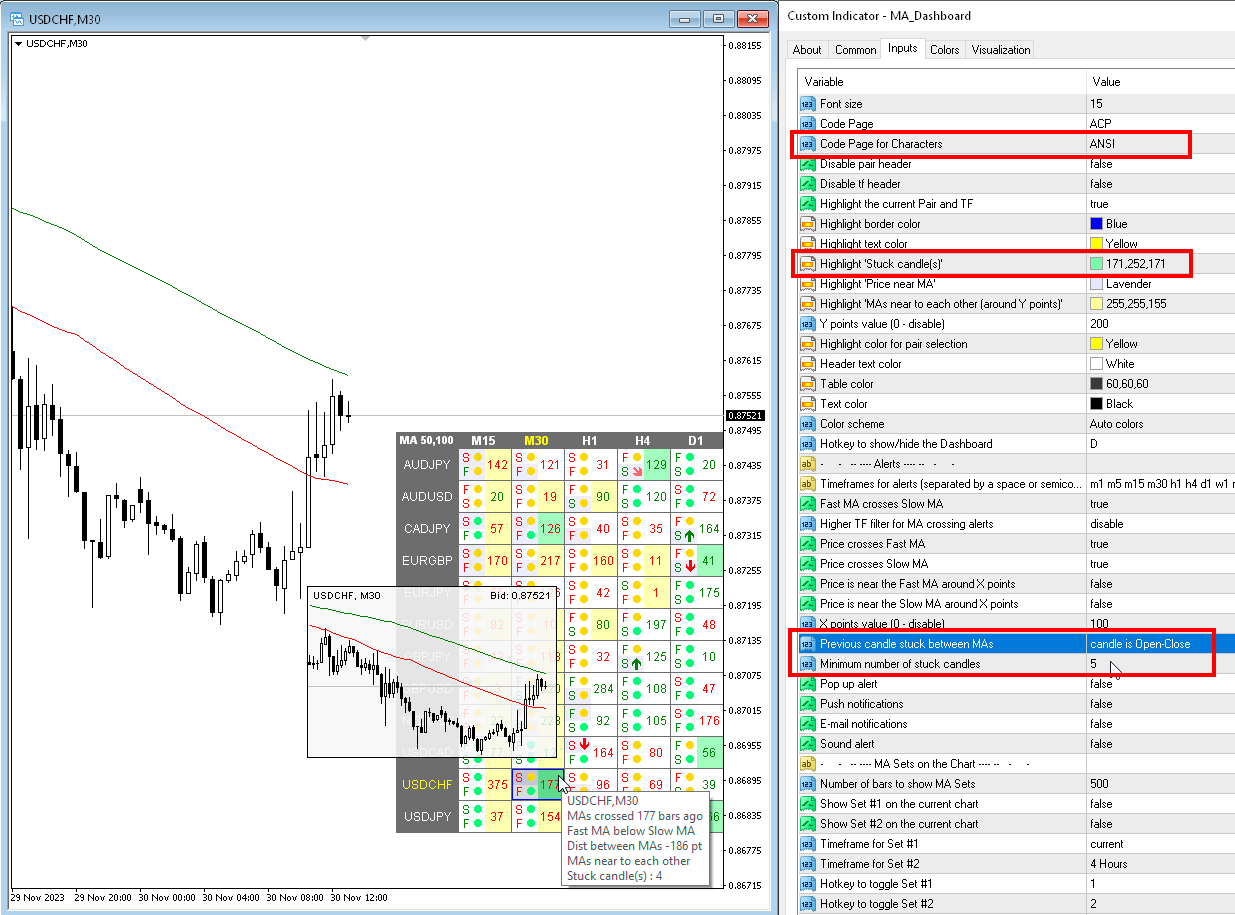
Previous candle stuck between MAs — Se as velas anteriores estiverem entre duas MAs, você poderá receber um alerta sobre isso ou vê-lo na tabela.
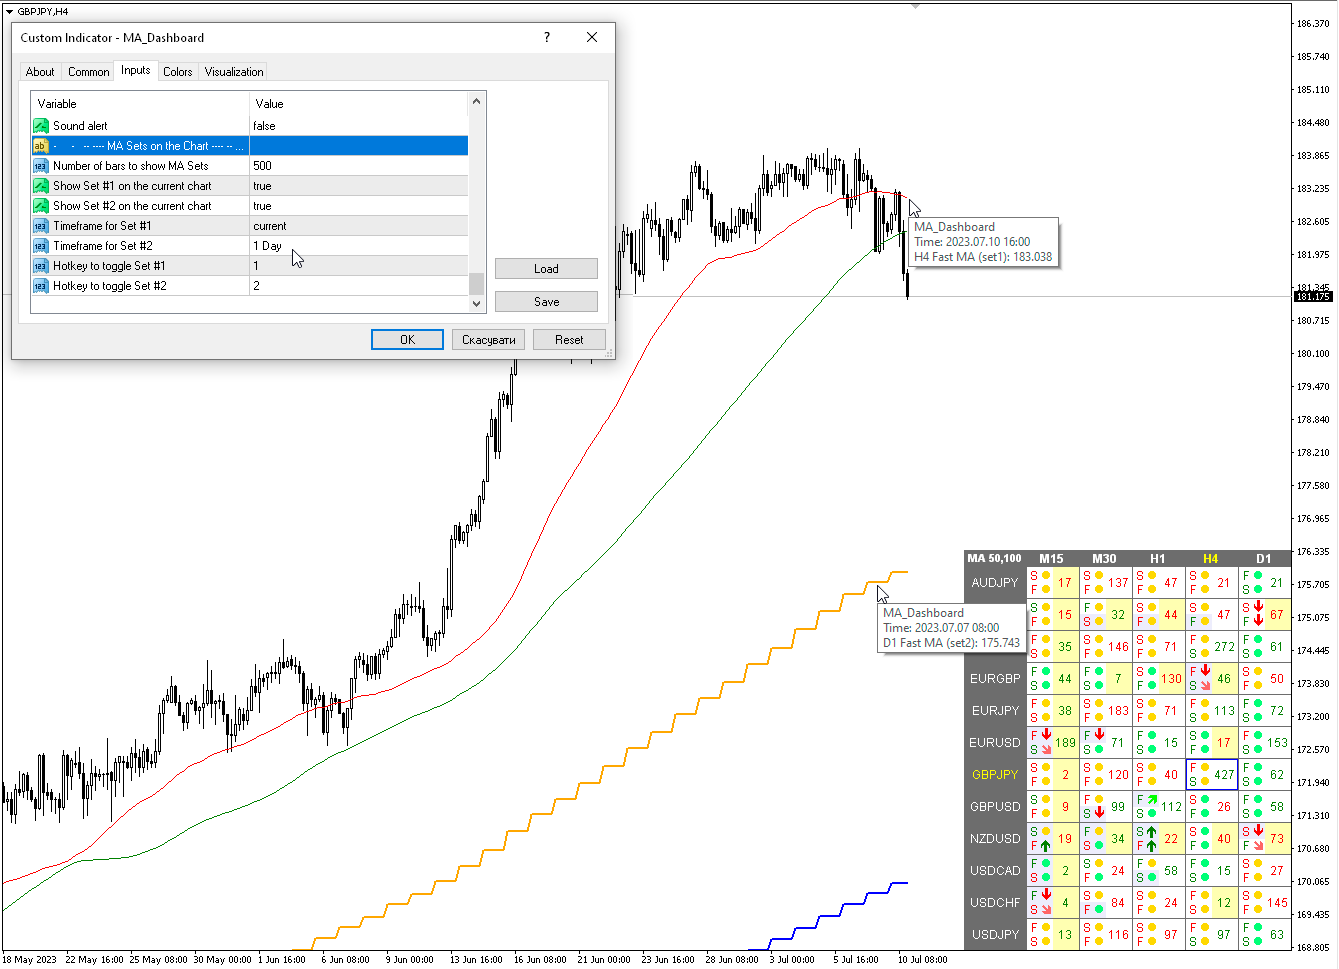
MA Sets on the Chart — MA define no gráfico
Number of bars to show MA Sets — Número de barras para mostrar conjuntos MA
Show Set #1 on the current chart — Mostrar o conjunto nº 1 no gráfico atual
Show Set #2 on the current chart — Mostrar o conjunto nº 2 no gráfico atual
Timeframe for Set #1 — Prazo para o conjunto nº 1
Timeframe for Set #2 — Prazo para o conjunto nº 2
Hotkey to toggle Set #1 — Tecla de atalho para alternar o Conjunto nº 1
Hotkey to toggle Set #2 — Tecla de atalho para alternar o Conjunto #2
Popup chart — Gráfico pop-up
Enable Popup chart — Ativar gráfico pop-up
Candle size — Tamanho da vela
Width (pix) — Largura (pix)
Height (pix) — Altura (pix)
Font size — Tamanho da fonte
Transparency (0-255) — Transparência (0-255)


I bought this indicator a few days ago and I can say it is really very use- and helpful !! As A. Forex already told it would be a good idea to integrate the MT5-standard indicators "Double Exponential Moving Average" and "Triple Exponential Moving Average" to this wonderful tool. To me I am using this both indicators constantly.