The Trend Professor
- Indicadores
- Elias Mtwenge
- Versão: 1.0
- Ativações: 20
The Trend Professor is a moving average based indicator designed for the purpose of helping the community of traders to analyse the price trend.
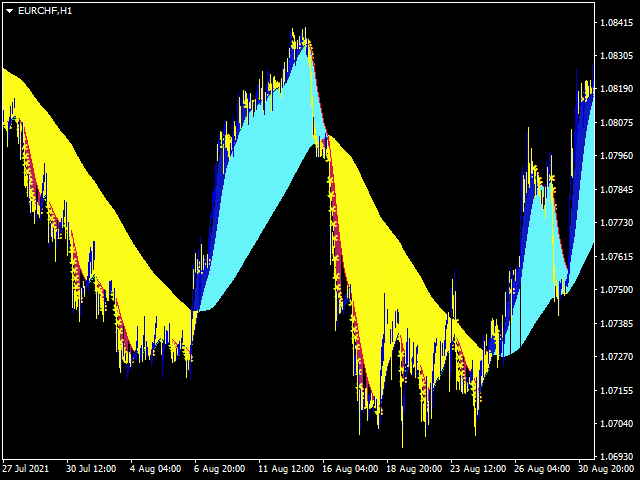
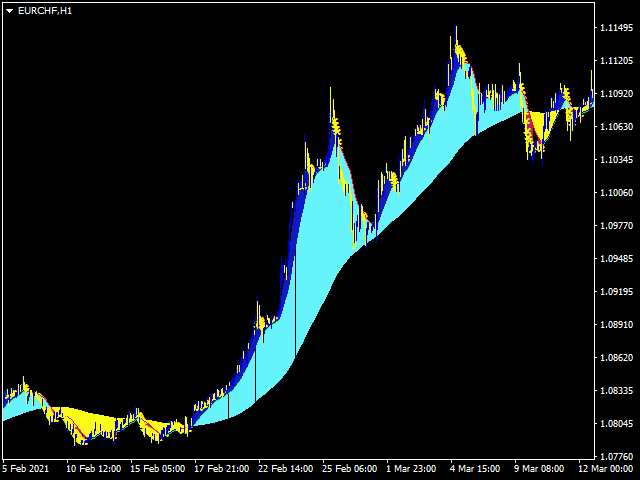
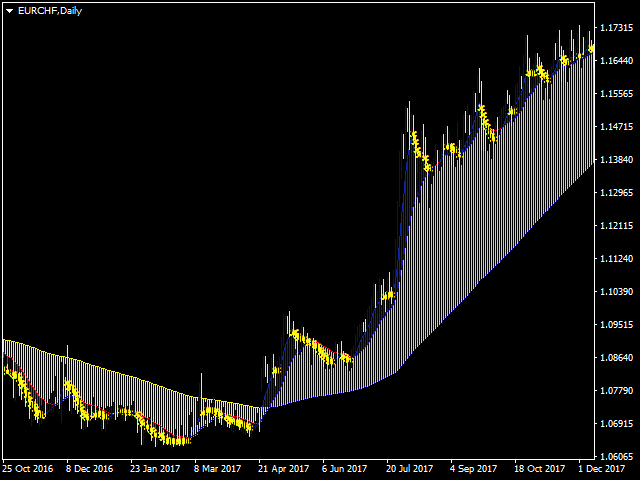
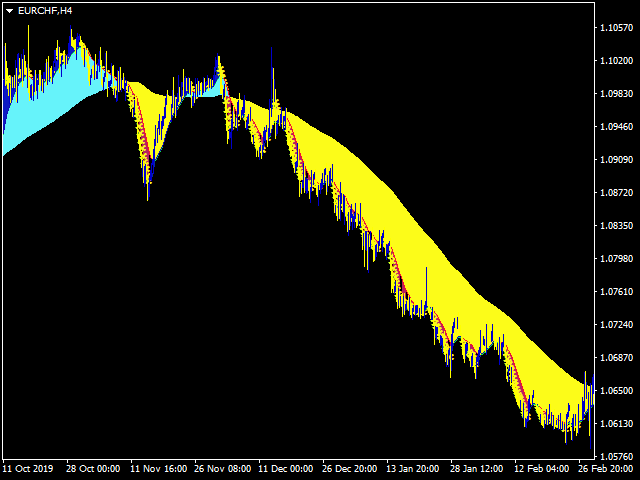
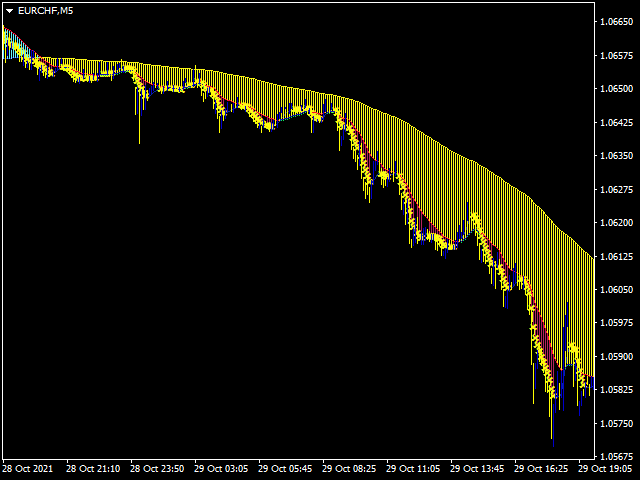
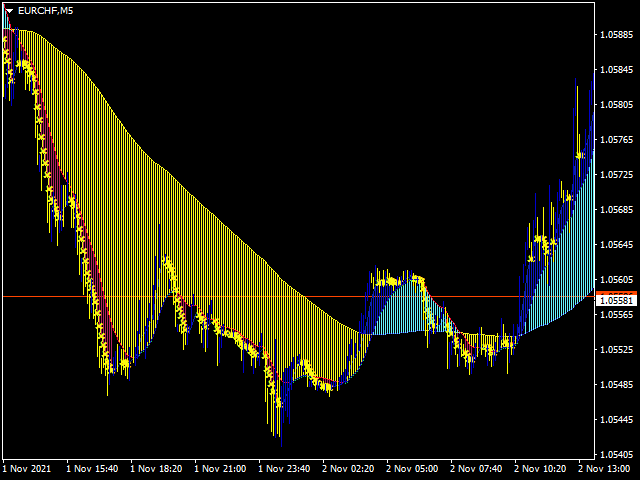
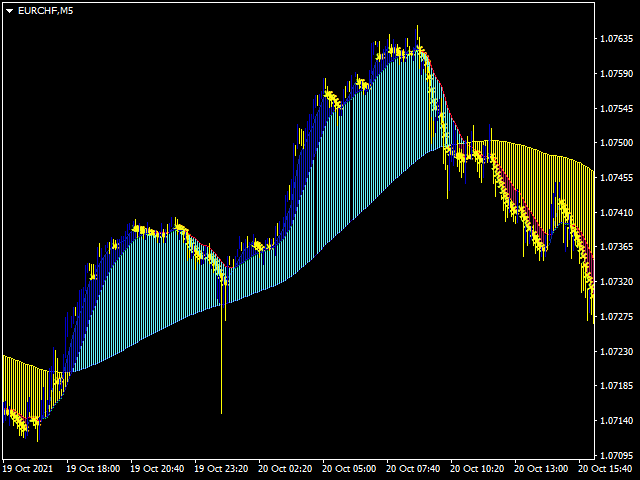
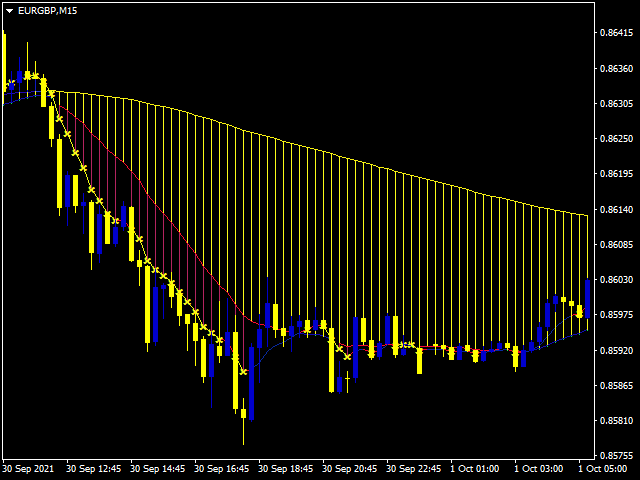
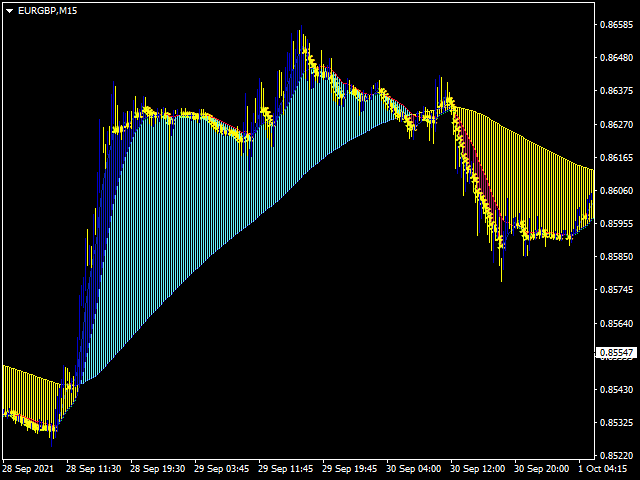
The indicator will be displayed in the main chart as it is indicated on the screenshot section.
How it works
- The indicator has lines of moving averages and colored histograms to depict the direction of the trend.
- There will be a fast signal line colored blue/yellow/red at some points. The red/yellow colored lines stands for bearish trend/signal while the blue/light blue color will stand for bullish trend/signal. You may zoom in and out to visualize the trend indicator in a more clear way as you wish.
- The fast signal line is for capturing the new direction of the trend while still in its beginning stage.
- There is a base line which is used as a reference line for telling whether the trend is bullish/bearish.
- Watch careful when the short period moving averages crosses each other either to the bottom or upward. This could be the sign of trend change.
- Sometimes the base line will be used as a resistance level if the downward trend is very strong and vise-versa is true for the strong bullish trend whereby we expect the baseline to act as a support level.
Last words.
Disclaimer: Not all signals will result into a profitable trades and you should not consider this tool's signal as the final in making financial decisions. You are responsible for all losses you incur as the result of using this tool. Invest wisely.

