Automatic Range Identifier
- Indicadores
- Libertas LLC
- Versão: 1.0
Free download for a limited time! We hope you enjoy, with our very best wishes during this pandemic!
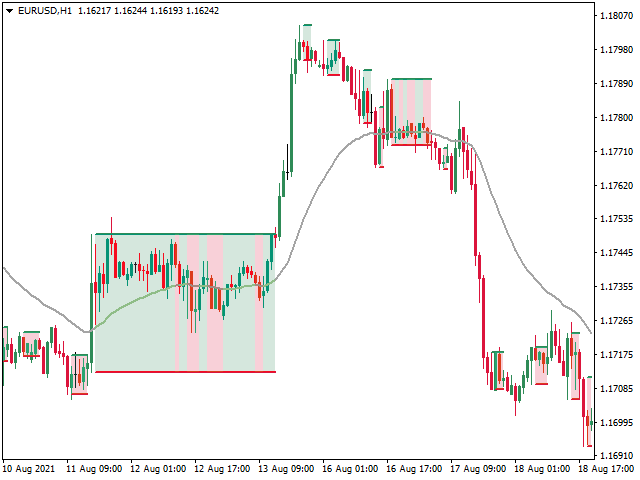
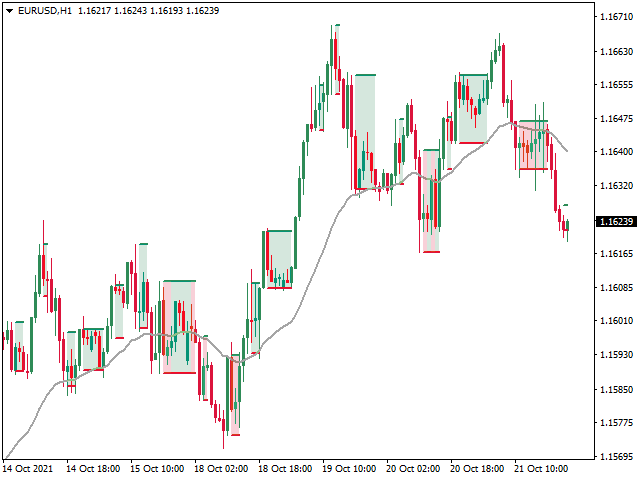
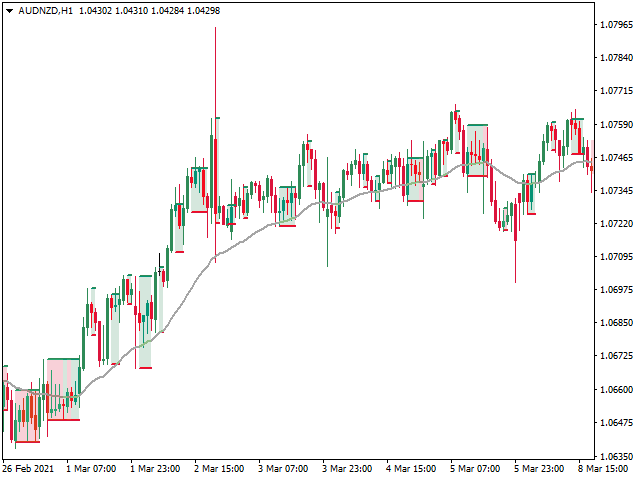
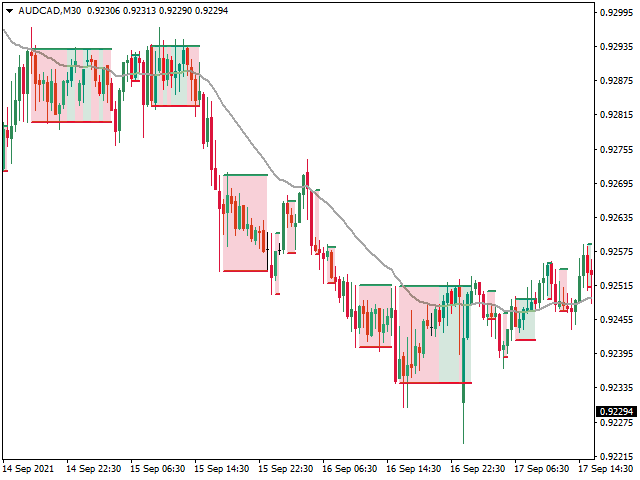
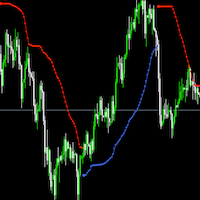
The issue with identifying ranges is some ranges and patterns are easy to miss, and subject to human error when calculated on the fly. The Automatic Range Identifier calculates both current and historically-formed ranges, and plots these in a clear way on your chart. It's a simple concept: the algorithm looks for recent maxima and minima points, and detects range-bound price action that stays within these points. This is also quite helpful as a starting point to plot relevant lines of support and resistance.
This is a simple and extremely useful tool that every trader should have in their toolbox.
How to Use
We recommend checking the identified ranges across different timeframes, to give you the most perspective on price actions in your main timeframe of choice... higher timeframes will generally show the stronger lines of support and resistance that may impact your timeframe, and, lower timeframes may give early warning indications of changes in price movement. e.g., if you're trading on a 15M interval, make sure you also check 5M and 1H!
Parameters
- Connect ranges (default=False): Draw lines and connect fill between different ranges for a continuous plot
- Show EMA (default=True): Show EMA line
- EMA length: # bars to use to calculate EMA
- Highlight ranges: plot a semi-opaque fill for identified ranges
- Colors: specify colors for fills and lines
- Fill opacity: Specify opacity of fill on chart







Excelente indicador.